data science and machine learning certification Archives - DexLab Analytics | Big Data Hadoop SAS R Analytics Predictive Modeling & Excel VBA

Time Series Analysis & Modelling with Python (Part II) – Data Smoothing

dexlab_time_series

Data Smoothing is done to better understand the hidden patterns in the data. In the non- stationary processes, it is very hard to forecast the data as the variance over a period of time changes, therefore data smoothing techniques are used to smooth out the irregular roughness to see a clearer signal.

In this segment we will be discussing two of the most important data smoothing techniques :-

  • Moving average smoothing
  • Exponential smoothing

Moving average smoothing

Moving average is a technique where subsets of original data are created and then average of each subset is taken to smooth out the data and find the value in between each subset which better helps to see the trend over a period of time.

Lets take an example to better understand the problem.

Suppose that we have a data of price observed over a period of time and it is a non-stationary data so that the tend is hard to recognize.

QTR (quarter)Price
110
211
318
414
515
6?


In the above data we don’t know the value of the 6th quarter.

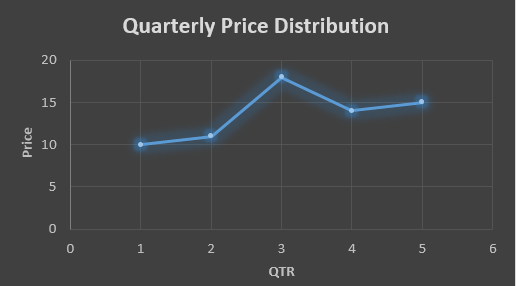
….fig (1)

The plot above shows that there is no trend the data is following so to better understand the pattern we calculate the moving average over three quarter at a time so that we get in between values as well as we get the missing value of the 6th quarter.

To find the missing value of 6th quarter we will use previous three quarter’s data i.e.

MAS =  = 15.7

QTR (quarter)Price
110
211
318
414
515
615.7

MAS =  = 13

MAS =  = 14.33

QTR (quarter)PriceMAS (Price)
11010
21111
31818
41413
51514.33
615.715.7


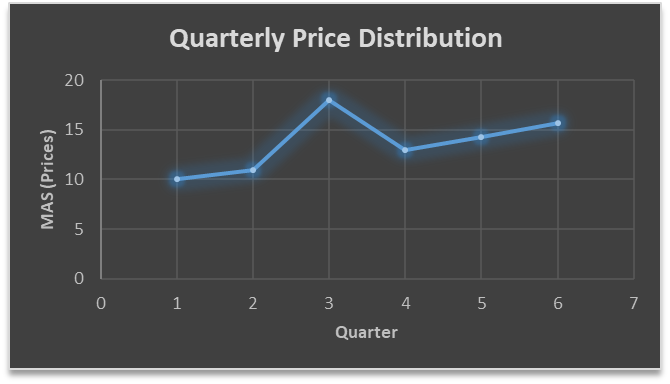
….. fig (2)

In the above graph we can see that after 3rd quarter there is an upward sloping trend in the data.

Exponential Data Smoothing

In this method a larger weight ( ) which lies between 0 & 1 is given to the most recent observations and as the observation grows more distant the weight decreases exponentially.

The weights are decided on the basis how the data is, in case the data has low movement then we will choose the value of  closer to 0 and in case the data has a lot more randomness then in that case we would like to choose the value of  closer to 1.

EMA= Ft= Ft-1 + (At-1 – Ft-1)

Now lets see a practical example.

For this example we will be taking  = 0.5

Taking the same data……

QTR (quarter)Price

(At)

EMS Price(Ft)
11010
211?
318?
414?
515?
6??


To find the value of yellow cell we need to find out the value of all the blue cells and since we do not have the initial value of F1 we will use the value of A1. Now lets do the calculation:-

F2=10+0.5(10 – 10) = 10

F3=10+0.5(11 – 10) = 10.5

F4=10.5+0.5(18 – 10.5) = 14.25

F5=14.25+0.5(14 – 14.25) = 14.13

F6=14.13+0.5(15 – 14.13)= 14.56

QTR (quarter)Price

(At)

EMS Price(Ft)
11010
21110
31810.5
41414.25
51514.13
614.5614.56

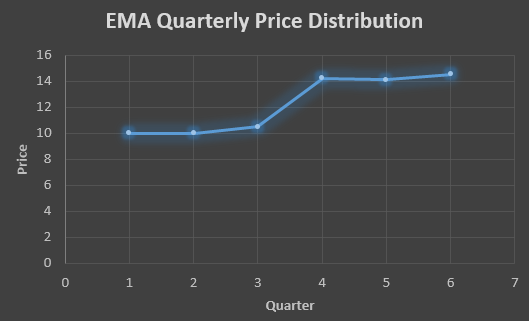
In the above graph we see that there is a trend now where the data is moving in the upward direction.

So, with that we come to the end of the discussion on the Data smoothing method. Hopefully it helped you understand the topic, for more information you can also watch the video tutorial attached down this blog. The blog is designed and prepared by Niharika Rai, Analytics Consultant, DexLab Analytics DexLab Analytics offers machine learning courses in Gurgaon. To keep on learning more, follow DexLab Analytics blog.


.
Data Science and Machine Learning: In What State They Are To Be Found?

Keen to have a sweeping view of data science and machine learning as a whole? 

Want to crack who is playing tricks with data and what’s happening in and around the budding field of machine learning across industries?

Looking for ways to know how aspiring, young data scientists are breaking into the IT field to invent something new each day?

Hold your breath, tight. The below report showcases few of our intrinsic findings – which we derived from Kaggle’s industry-wide survey. Also, interactive visualizations are on the offer.

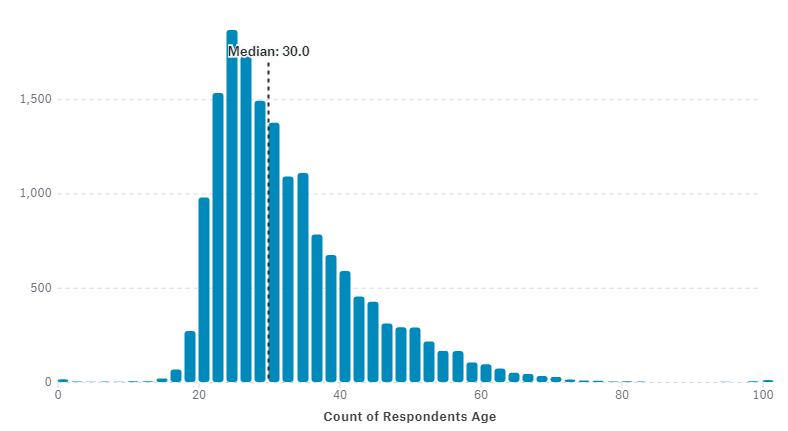
  1. On an average, data scientists fall under the age bar of 30 years old, but as a matter of fact, this age limit is subject to change. For example, the average age of data scientists from India tends to be 9 years younger than the average scientists from Australia.
  2. Python is the most commonly used language programs in India, but data scientists at large are relying on R now.
  3. Most of the data scientists are likely to possess a Master’s degree, however those who bags a salary of more than $150K mostly have a doctoral degree under their hood.

Who’s Using Data?

A lot of ways are there to nab who’s working with data, but in here we will fix our gaze on the demographic statistics and the background of people who are working in data science.

What is your age?

To kick start our discussion, according to the Kaggle survey, the average age of respondents was 30 years old subject to some variation. The respondents from India were on an average 9 years younger than those from Australia.

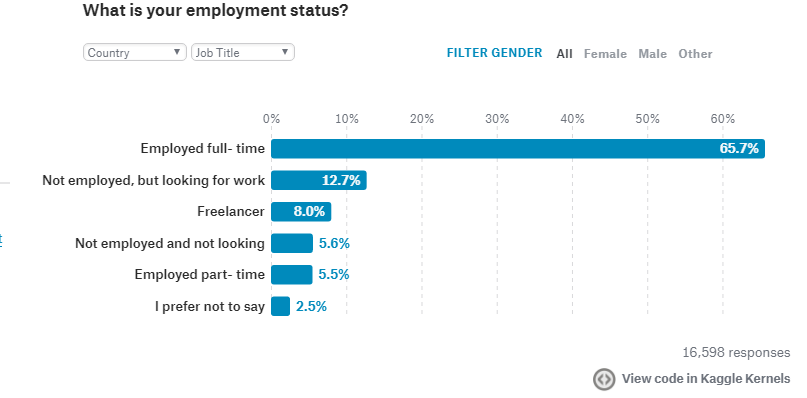
What is your employment situation?

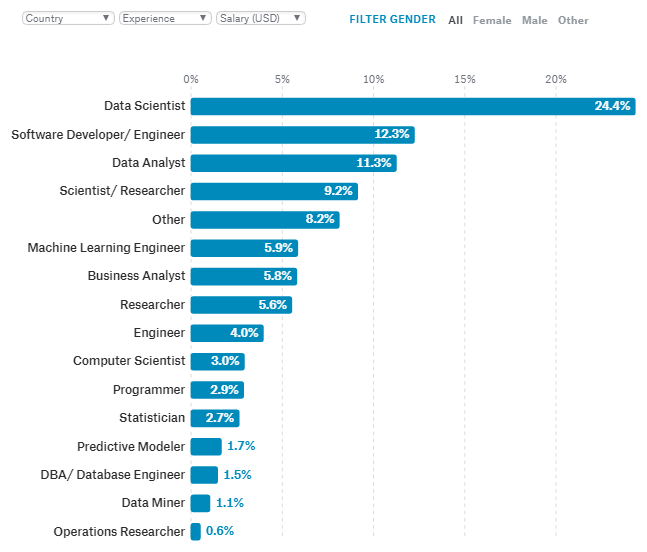
What kind of job title you bag?

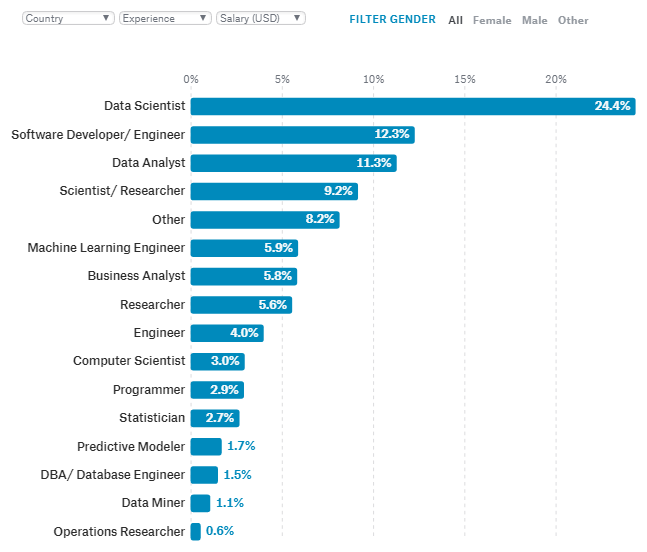
Anyone who uses code for data analysis is termed as a data scientist. But how true is this? In the vast realm of data science, there are a series of job titles that can be pegged. For instance, in Iran and Malaysia, the job title of data scientist is not so popular, they like to call data scientists by the name Scientist or Researcher. So, keep a note of it.

How much is your full-time annual salary?

While “compensation and benefits” ranked a little lower than “opportunities for professional developments”, the best part remains it can still be considered a reasonable compensation.

Check out how much a standard machine learning engineer brings home to in the US

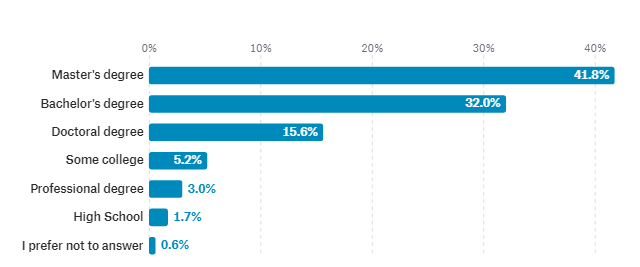
What should be the highest formal education?

So, what’s going on in your mind? Should you get your hands on the next formal degree? Normally, most of the data scientists have obtained a full-time master’s degree, even if they haven’t they are at least data analytics’ certified. But professionals who come under a higher salary slab are more likely to possess a doctoral degree.

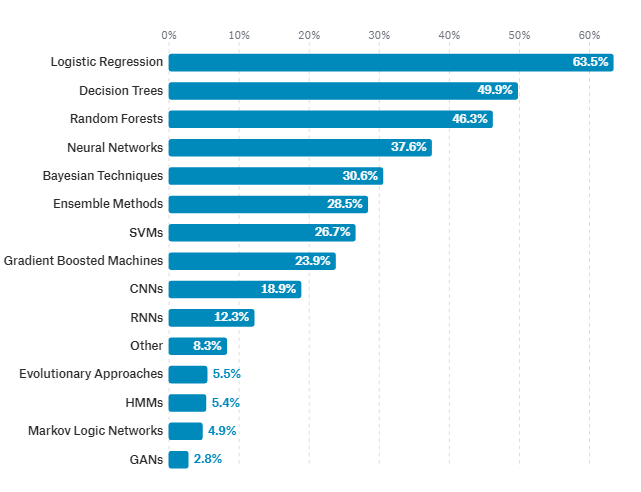
What are the most commonly used data science methods at work?

Largely, logistic regression is used in all the work areas except the domain of Military and Security, because in here Neural Networks are being implemented extensively.

Which tool is used at work?

Python was once the most used data analytics tool, but now it is replaced by R.

The original article can be viewed in Kaggle.

Kaggle: A Brief Note

Kaggle is an iconic platform for data scientists, allowing ample scope to connect, understand, discover and explore data. For years, Kaggle has been a diverse platform to drag in hundreds of data scientists and machine learning enthusiasts, and is still in the game.

For excellent data science certification in Gurgaon, look no further than DexLab Analytics. Opt for their intensive data science and machine learning certification and unlock a string of impressive career milestones.


Interested in a career in Data Analyst?

To learn more about Data Analyst with Advanced excel course – Enrol Now.
To learn more about Data Analyst with R Course – Enrol Now.
To learn more about Big Data Course – Enrol Now.

To learn more about Machine Learning Using Python and Spark – Enrol Now.
To learn more about Data Analyst with SAS Course – Enrol Now.
To learn more about Data Analyst with Apache Spark Course – Enrol Now.
To learn more about Data Analyst with Market Risk Analytics and Modelling Course – Enrol Now.

Call us to know more