data science Archives - DexLab Analytics | Big Data Hadoop SAS R Analytics Predictive Modeling & Excel VBA

Netflix develops in own data science management tool and open sources it

Netflix develops in own data science management tool and open sources it

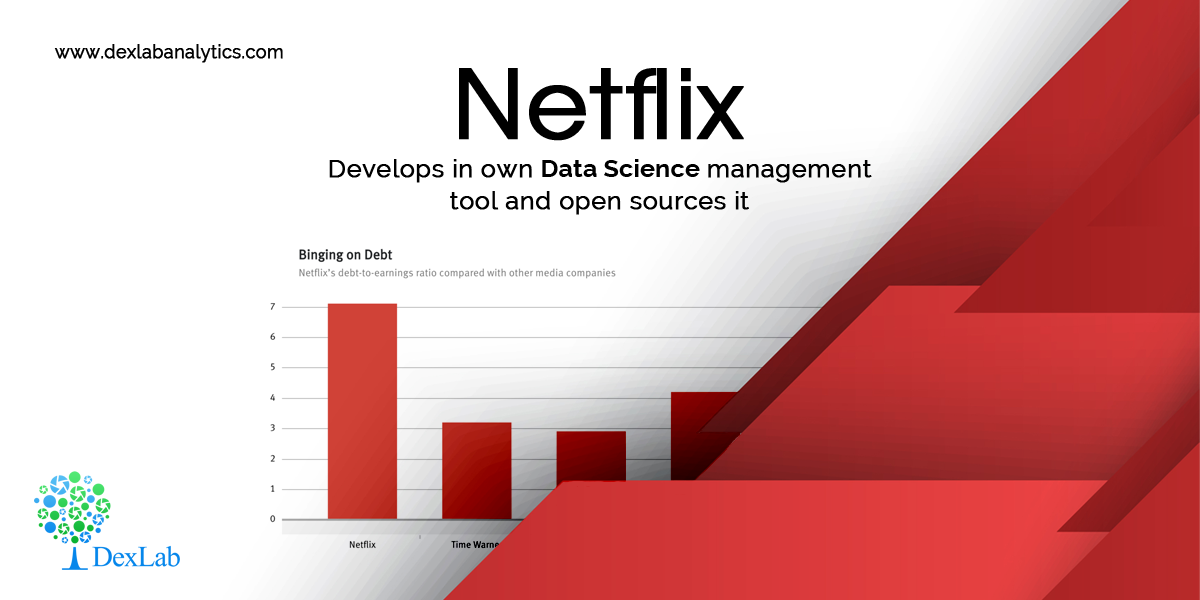
Netflix in December last year introduced its own python framework called Metaflow. It was developed to apply to data science with a vision to make scalability a seamless proposition. Metaflow’s biggest strength is that it makes running the pipeline (constructed as a series of steps in a graph) easily movable from a stationary machine to cloud platforms (currently only the Amazon Web Services (AWS)).

What does Metaflow really do? Well, it primarily “provides a layer of abstraction” on computing resources. What it translates to is the fact that a programmer can concentrate on writing/working code while Metaflow will handle the aspect which ensures the code runs on machines.

Metaflow manages and oversees Python data science projects addressing the entire data science workflow (from prototype to model deployment), works with various machine learning libraries and amalgamates with AWS.

Machine learning and data science projects require systems to follow and track the trajectory and development of the code, data, and models. Doing this task manually is prone to mistakes and errors. Moreover, source code management tools like Git are not at all well-suited to doing these tasks.

Metaflow provides Python Application Programming Interfaces (APIs) to the entire stack of technologies in a data science workflow, from access to the data, versioning, model training, scheduling, and model deployment, says a report.

Netflix built Metaflow to provide its own data scientists and developers with “a unified API to the infrastructure stack that is required to execute data science projects, from prototype to production,” and to “focus on the widest variety of ML use cases, many of which are small or medium-sized, which many companies face on a day to day basis”, Metaflow’s introductory documentation says.

Data Science Machine Learning Certification

Metaflow is not biased. It does not favor any one machine learning framework or data science library over another. The video-streaming giant deploys machine learning across all aspects of its business, from screenplay analysis, to optimizing production schedules and pricing. It is bent on using Python to the best limits the programming language can stretch. For the best Data Science Courses in Gurgaon or Python training institute in Delhi, you can check out the Dexlab Analytics courses online.


Interested in a career in Data Analyst?

To learn more about Data Analyst with Advanced excel course – Enrol Now.
To learn more about Data Analyst with R Course – Enrol Now.
To learn more about Big Data Course – Enrol Now.

To learn more about Machine Learning Using Python and Spark – Enrol Now.
To learn more about Data Analyst with SAS Course – Enrol Now.
To learn more about Data Analyst with Apache Spark Course – Enrol Now.
To learn more about Data Analyst with Market Risk Analytics and Modelling Course – Enrol Now.

Fundamental Concepts of Statistics for Data Science Beginners- Part One

Fundamental Concepts of Statistics for Data Science Beginners- Part One

Do you aspire to be a data scientist? Then is it essential that you have a solid understanding of the core concepts of statistics. Everyone doesn’t have a Ph.D. in Statistics. And that isn’t the only way to excel in the field of data science. But yes, knowing stats well is a prerequisite for data science.

Nowadays, popularly used libraries, like Tesorflow, liberate the user from the intricacies of complex mathematics. Still, it is advisable to be familiar with the fundamental principles on which they work, because that will enable you to use the libraries better.

In this blog, we attempt to shed light on some basic concepts, theorems and equations of statistics for data science.

Statistical Distributions:

Statistical distributions are important tools that you must arm yourself with to be a skilled data scientist. Here, we shall talk about two important distributions, namely Poisson distribution and Binomial distribution.

Poisson distribution:
This distribution is used to find out the number of events that are expected to occur during an interval of time. For example, the number of page views in one second, the number of phone calls in a particular period of time, number of sales per hour, etc.

The symbols used in the equation are:

x: exact number of successes

e: constant equal to 2.71828 approximately

λ: average number of successes per time interval

Poisson distribution is used for calculating losses in manufacturing. Let us consider that a machine generates metal sheets that have ‘x’ flaws per yard. Suppose the error rate is 2 per yard of sheet (λ). Applying this information to Poisson distribution, we can calculate the probability of having exactly two errors in a yard.

Source: Brilliant.org

Poisson distribution is used for faster detection of anomalies.

Binomial distribution:

This is a very common distribution in Statistics. Suppose you have flipped a coin thrice. Using basic combinatorics for flipping a coin thrice, we see that there are eight combinations possible. We find out the probabilities of getting 0, 1, 2 or 3 heads and plot this on a graph. This gives us the binomial distribution for this particular problem. It must be remembered that Binomial distribution curve is similar to a Normal distribution Curve. Normal distribution is used when values are continuous and Binomial distribution is used for discrete values.

Source: mathnstuff.com

Binomial distribution is a discrete probability distribution where number of trials is predetermined and there are two possible outcomes– success and failure, win or lose, gain or loss. Depending on a few conditions, like the total number of trails is large, the probability of success is near 1 and the probability of failure is near 0, the trails are independent and identical, etc., the binomial distribution is approximated to a normal distribution.

Source: MathBitsNotebook

Binomial distribution has many applications in business. For example, it is estimated that 5% of tax returns for individuals with high net worth in USA is fraudulent. These frauds might be uncovered through audits. Binomial distribution is used to find out for ‘n’ number of tax returns that are audited, what is the probability for say 5 fraudulent returns to be uncovered.

There are some more probability distributions, like Bernoulli and Geometric distributions. We shall cover that and more in the following blogs. So, stay tuned and follow DexLab Analytics. The experts here offer top-quality data science courses in Delhi. Go through the data science certification details right now!


References:

upgrad.com/blog/basics-of-statistics-for-data-science

anomaly.io/anomaly-detection-poisson-distribution

analyticsvidhya.com/blog/2017/09/6-probability-distributions-data-science


Interested in a career in Data Analyst?

To learn more about Data Analyst with Advanced excel course – Enrol Now.
To learn more about Data Analyst with R Course – Enrol Now.
To learn more about Big Data Course – Enrol Now.

To learn more about Machine Learning Using Python and Spark – Enrol Now.
To learn more about Data Analyst with SAS Course – Enrol Now.
To learn more about Data Analyst with Apache Spark Course – Enrol Now.
To learn more about Data Analyst with Market Risk Analytics and Modelling Course – Enrol Now.

The Big Data Driven Future of Fashion: How Data Influences Fashion

The Big Data Driven Future of Fashion: How Data Influences Fashion

Big Data is revolutionizing every industry, including fashion. The nuanced notion of big data is altering the ways designers create and market their clothing. It’s not only aiding designers in understanding customer preferences but also helps them market their products well. Hadoop BI is one of the potent tools of technology that provides a wide pool of information for designers to design range of products that will sell.

2

How Does the Mechanism Work?

Large sets of data help draw patterns and obviously trends play a crucial role across the fashion industry. In terms of nature, fashion and trends both are social. Irrespective of the nature of data, structured or unstructured, framing trends and patterns in the fashion industry leads to emerging ideas, strategies, shapes and styles, all of which ushers you into bright and blooming future of fashion.

What Colors To Choose For Your Line?

KYC (Know Your Customer) is the key here too. A fashion house must know which colors are doing rounds amongst the customers. Big data tells a lot about which color is being popular among the customers, and based on that, you can change your offerings subject to trend, style picks and customer preferences.

Men’s or Women’s Clothing: Which to Choose?

Deciding between men’s or women fashion is a pivotal point for any designer. Keep in mind, target demographic for each designer is different, and they should know who will be their prospective customers and who doesn’t run a chance.

Big data tool derive insights regarding when customers will make purchases, how large will be the quantity and how many items are they going to buy. Choosing between men’s and women’s fashion could make all the difference in the world.

Arm yourself with business analyst training courses in Gurgaon; it’s high time to be data-friendly.

Transforming Runway Fashion into Retail Merchandise

Launching a brand in the eyes of the public garners a lot of attention, and the designs need to be stellar. But, in reality the fashion that we often see on runways is rarely donned by the ordinary customers; because, the dresses and outfits that are showcased on the ramp are a bit OTT, thus altered before being placed in the stores. So, big data aids in deciphering which attires are going to be successful, and which will fail down the line. So, use the power of big data prudently and reap benefit, unimaginable across the global retail stores.

Deciding Pricing of the Product

As soon as the garbs leave the runway, they are tagged with prices, which are then posted inside the stores, after analyzing how much the customers are willing to pay for a particular product. For averaging, big data is a saving grace. Big data easily averages the prices, and decides a single mean price, which seems to be quite justifiable.

However, remember, while pricing, each garments are designed keeping in mind a specified customer range. Attires that are incredibly expensive are sold off to only a selected affluent user base, while the pricing of items that are designed for general public are pegged down. Based on previous years’ data, big data consultants can decide the pricing policy so that there’s something for all.

The world of fashion is changing, and so is the way of functioning. From the perspective of fashion house owner, collect as much data as possible of customers and expand your offerings. Big data analytics is here to help you operate your business and modify product lines that appeals to the customers in future.

And from the perspective of a student, to harness maximum benefits from data, enroll in a data analyst course in Gurgaon. Ask the consultants of DexLab Analytics for more deets.


The article has been sourced from

channels.theinnovationenterprise.com/articles/8230-big-data-hits-the-runway-how-big-data-is-changing-the-fashion-industry

iamwire.com/2017/01/big-data-fashion-industry/147935

bbntimes.com/en/technology/big-data-is-stepping-into-the-fashion-world


Interested in a career in Data Analyst?

To learn more about Data Analyst with Advanced excel course – Enrol Now.
To learn more about Data Analyst with R Course – Enrol Now.
To learn more about Big Data Course – Enrol Now.

To learn more about Machine Learning Using Python and Spark – Enrol Now.
To learn more about Data Analyst with SAS Course – Enrol Now.
To learn more about Data Analyst with Apache Spark Course – Enrol Now.
To learn more about Data Analyst with Market Risk Analytics and Modelling Course – Enrol Now.

How Data Scientists Take Their Coffee Every Morning

How Data Scientists Have Their Coffee

To a data scientist we are all sources of data, from the very moment we wake up in the morning to visit our local Starbucks (or any other local café) to get our morning coffee and swipe the screen of our tablets/iPads or smart phones to go through the big headlines for the day. With these few apparently simple regular exercises we are actually giving the data scientists more data which in-turn allows them to offer tailor-made news articles about things that interest us, and also prepares our favorite coffee blend ready for us to pick up every morning at the café.

The world of data science came to exist due to the growing need of drawing valuable information from data that is being collected every other day around the world. But is data science? Why is it necessary? A certified data scientist can be best described as a breed of experts who have in-depth knowledge in statistics, mathematics and computer science and use these skills to gather valuable insights form data. They often require innovative new solutions to address the various data problems.

Data Science: Is It the Right Answer? – @Dexlabanalytics.

As per estimates from the various job portals it is expected that around 3 million job positions are needed to be fulfilled by 2018 with individuals who have in-depth knowledge and expertise in the field of data analytics and can handle big data. Those who have already boarded the data analytics train are finding exciting new career prospects in this field with fast-paced growth opportunities. So, more and more individuals are looking to enhance their employability by acquiring a data science certification from a reputable institution. Age old programs are now being fast replaced by new comers in the field of data mining with software like R, SAS etc. Although SAS has been around in the world of data science for almost 40 years now, but it took time for it to really make a big splash in the industry. However, it is slowly emerging to be one the most in-demand programming languages these days.What a data science certification covers?

Tracing Success in the New Age of Data Science – @Dexlabanalytics.

This course covers the topics that enable students to implement advanced analytics to big data. Usually a student after completion of this course acquires an understanding of model deployment, machine language, automation and analytical modeling. Moreover, a well-equipped course in data science helps students to fine-tune their communication skills as well.

Keep Pace with Automation: Emerging Data Science Jobs in India – @Dexlabanalytics.

Things a data scientist must know:

All data scientists must have good mathematical skills in topics like: linear algebra, multivariable calculus, Python and linear algebra. For those with strong backgrounds in linear algebra and multivariable calculus it will be easy to understand all probability, machine learning and statistics in no time, which is a requisite for the job.

More and more data-hungry professionals are seeking excellent Data Science training in Delhi. If you are one of them, kindly drop by DexLab Analytics: we are a pioneering Data Science training institute. Peruse through our course details for better future.


Interested in a career in Data Analyst?

To learn more about Data Analyst with Advanced excel course – Enrol Now.
To learn more about Data Analyst with R Course – Enrol Now.
To learn more about Big Data Course – Enrol Now.

To learn more about Machine Learning Using Python and Spark – Enrol Now.
To learn more about Data Analyst with SAS Course – Enrol Now.
To learn more about Data Analyst with Apache Spark Course – Enrol Now.
To learn more about Data Analyst with Market Risk Analytics and Modelling Course – Enrol Now.

Call us to know more