data analytics certification courses Archives - Page 4 of 4 - DexLab Analytics | Big Data Hadoop SAS R Analytics Predictive Modeling & Excel VBA

What Makes Tableau 10 So Desirable Among the IT Nerds

What Makes Tableau 10 So Desirable Among the IT Nerds

Your data just got better, say thanks to Tableau 10. The big data geeks have worked on both the beauty and brains of Tableau, to make the analyses easier, faster and exceptionally delightful. Tableau 10 features an exciting new look and feel, loaded with cute fonts and beautiful colours to make your viz sparkle.

We are thrilled. We have been waiting for days to gauge how some of the Tableau 10 new features will synchronise with our conventional business interface for Hadoop. We have culled out some of the best features of Tableau 10, which had made us zealous and left us buzzing. And here they are ..

An extremely visually appealing new interface

Connect the little dots to get a bigger picture. The new interface pays enough attention to minute details making the entire visualization environment pleasant and engaging.

For example: When you name a worksheet tab, the same name pops up as an inline title, blending seamlessly with the viz – now isn’t that great!

atscale1

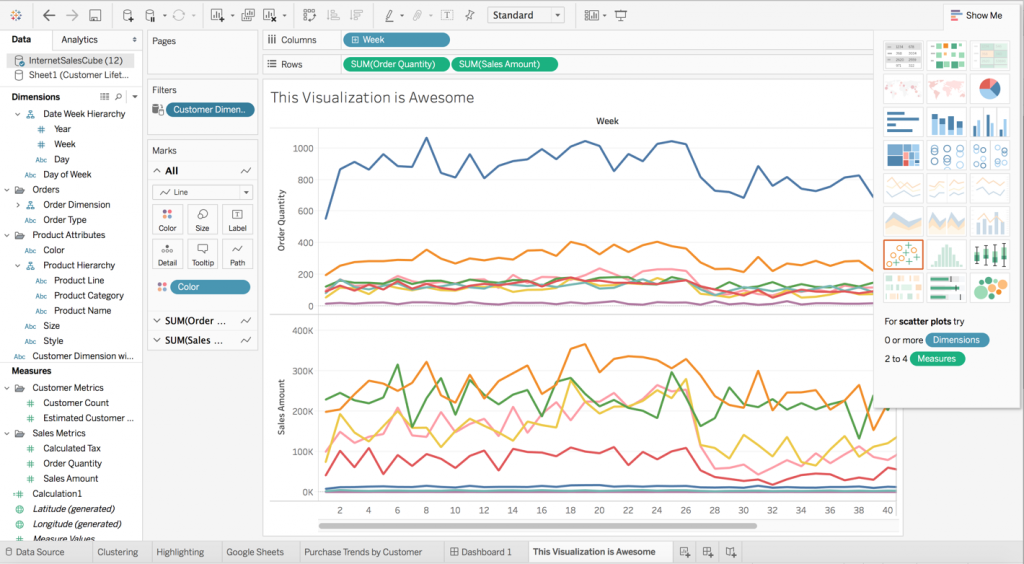
Ten on ten to Tableau’s clustering feature

Owing to Tableau’s outstanding analytics capabilities, Tableau 10’s clustering feature is the next best thing. The feature focuses on the elements of a pool of data values and visually highlights an inconspicuous number of clusters, which is found in the data. This makes it easier for an analyst to run his eyes through the data sets they need to investigate.

Spotting the zip codes was never so easy before, come and take a look at the following video.

Tableau 10’s highlighting feature helps in finding a needle from the big data haystack

While developing interesting data visualizations, we often need to present the most comprehensive view of the data, so that the consumers get the right information they are looking for, without foraging here and there. With Tableau 10’s highlighting feature, this goal is easily achieved.

In the video shared below, we can see the weekly trend of sales and numbers of customer across the states included in the sales transaction data.

Multisource data integration and blending

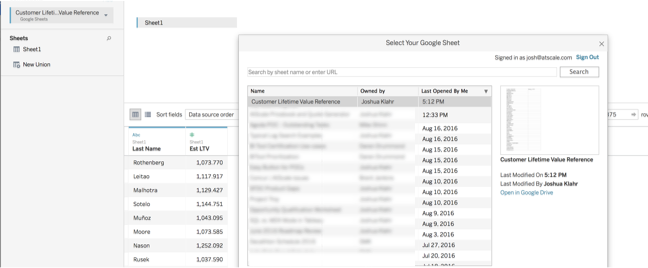
By using Tableau 10, the users will be able to directly connect to data stored in Google Sheets.

Scroll down:

atscale2 (1)

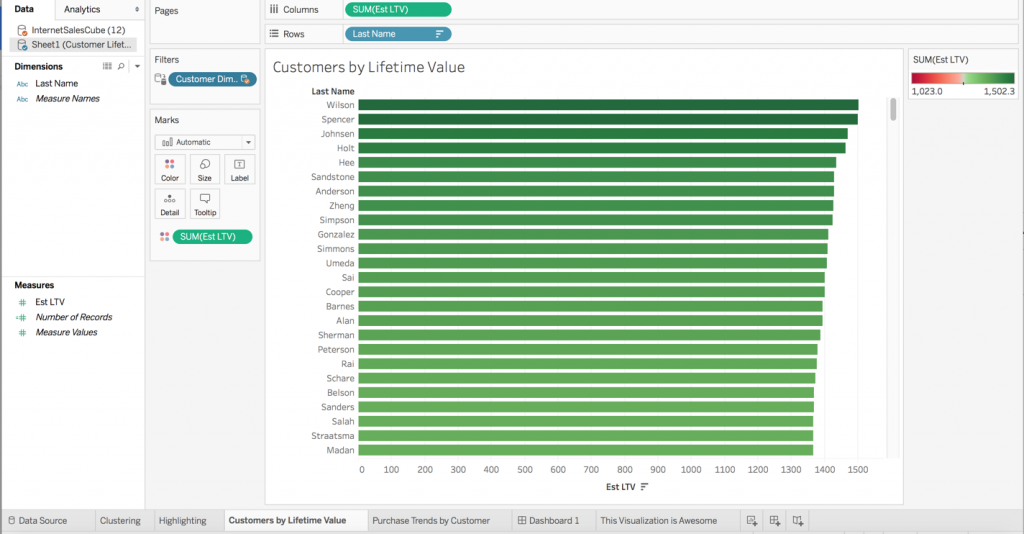
Develop visual representation of the most-favoured customers, based on estimated lifetime value.

005

Once the new data source is created, you can now use the data-relationships feature to let Tableau know that the Last Name column from the Google Sheets data set is mapped to the Customer Dimension column from my AtScale big data virtual cube.

004

Soon after the above relation has been accomplished, a filter is initiated on my Purchase Trends by Ranked Customers dashboard. Watch the video, to get a clearer picture.

These are some of the slivers of what’s new in Tableau 10. Want even more? Join DexLab Analytics for intensive Tableau Certification Training. This premier data science training institute excels in data analytics certification courses. Get interesting data knowledge and Tableau insights from the veterans!


Sources: tableau.com
 

Interested in a career in Data Analyst?

To learn more about Data Analyst with Advanced excel course – Enrol Now.
To learn more about Data Analyst with R Course – Enrol Now.
To learn more about Big Data Course – Enrol Now.

To learn more about Machine Learning Using Python and Spark – Enrol Now.
To learn more about Data Analyst with SAS Course – Enrol Now.
To learn more about Data Analyst with Apache Spark Course – Enrol Now.
To learn more about Data Analyst with Market Risk Analytics and Modelling Course – Enrol Now.

Demystifying Tableau Jargons: Interact With Data like Never Before

Demystifying Tableau Jargons: Interact With Data like Never Before

Businesses are flourishing. Managerial data are in abundance. The need for efficient BI softwares is at the pinnacle. Structured BI softwares are nimble and up to the minute. Tableau is one such BI tool, which is not only simple and comprehensible, but also extremely purposeful, enough to fulfil high-end professional commitments. It works just the way you want it to, instruct it in a particular way and wait for the results, without compromising the security of various confidential data.</span

Here in this FAQ blog, we have pulled out some of the top of the line frequently asked queries, regarding Tableau and R Programming. Both are highly functional, user friendly and efficient. Scroll down to grasp the basics and decode the fundamentals of Tableau.

Also read: Most Commonly Asked Tableau Interview Questions

What is Tableau?

Tableau is one of the finest data visualization tools that empower the enterprises to represent the data in the most flawless and explicit manner. It has proved its worth by being at par with its dominant predecessors, who analysed data visually and ruled the market for long.

How Tableau is classified?

Tableau can be classified as follows:

  • Tableau Desktop
  • Tableau Server
  • Tableau Online

What makes Tableau so popular?

With superb visualizations at an affordable price, Tableau is unrivalled. It can easily connect to any database – you don’t have to plug-in and is equipped with a robust memory processing.

Also read: Power BI or Tableau? Which is Better and Why?

Can we use precompiled models, packages, etc. with Tableau and R?

The answer is YES. If you can do it with R, you can easily incorporate it with Tableau. It includes any parallel computing modules, packages, libraries and statistical packages. It also involves commercialized versions of R, including Revolution Analytics.

Also read: How to Connect Oracle BI Server with Tableau

While you integrate Tableau and R, what is the best measure to debug R scripts or discover errors?

This is a vital question. There are mainly two ways. The first way to do this is by using ‘write.csv’ command within the studied field that calls an R script. The second one considers the use of debug version of the unparalleled executable of Rserve (Rserve_d.exe), which is ideal to print out any code that R is performing, and will be called R scripts.

Also read: Are You Trying to Ace Your Tableau Interview?

Can R be used to reshape data?

Yes, R possesses the ability of reshaping data.

Can data be transferred from a relational database to R, using Tableau?

Well, yes. Tableau can transfer data from any given source and run R scripts on that particular data set, irrespective of data type – be it relational database, flat-file, cube or unstructured.

2

What is Tableau Reader?

Tableau Reader is an effective tool to open the .twbx(Tableau packaged Workbook) files. However, keep in mind, it can only open files and cannot develop new connections and workbooks.

What do you mean by Tableau Public?

Tableau Public is a fantastic tool for anyone who wants to share his interesting stories on the web with others. You will gain access to data, develop interactive data visualizations and publish them on your website for others to see. And all of this, without writing a single line of code.

As parting thoughts, if you want to make something promising out of your mundane organisational data or want to make your frantic schedule of data handling and management a bit easier and enjoyable, then surely Tableau certification Gurgaon will work wonders for you! Contact us at DexLab Analytics, the pioneering data science online learning institute. We will be happy to help you.


Interested in a career in Data Analyst?

To learn more about Machine Learning Using Python and Spark – click here.
To learn more about Data Analyst with Advanced excel course – click here.
To learn more about Data Analyst with SAS Course – click here.
To learn more about Data Analyst with R Course – click here.
To learn more about Big Data Course – click here.

Power BI or Tableau? Which is Better and Why?

Power-BI-or-Tableau--Which-is-Better--and-Why

In the present data frenzy setting, data visualization is the new Talk of the Town. Various companies are developing and launching their own data visualization tools in the market. For quite some time now, Tableau has been the pioneering data visualization platform and till date the best to consider. Tableau’s data visualization tool is unbeatable to any other emerging product in the digital community. 

Apparently, Tableau has a remarkable competitor, recently. It is the Power BI, a decisive and dynamic BI tool, brought into by Microsoft. It is catching the trend with Tableau fast and appears to be on its way to become the number one BI tool in the digital market.

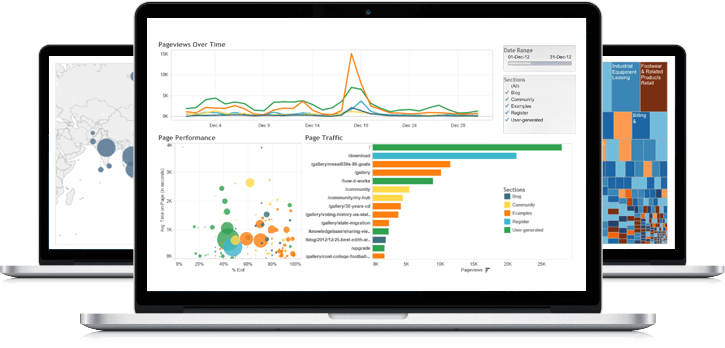
tableau_dashboard

Talking about features, there is little room to establish a set of comparisons between Power BI and Tableau, as Power BI is better equipped with scintillating features. Putting it aside, Tableau comes with its own respective advantages, like high-end visualizations and superb scalability.

Is data visualization your business’ prime focus? If yes, Tableau will be the perfect solution for your venture. However, if you are on a look out for a platform, excelling on versatile analytic capabilities, including predictive modelling, optimizing and reporting, Power BI suite will be the real deal-breaker.  

In terms of tools and abilities, Power BI and Tableau boasts of two major differences:

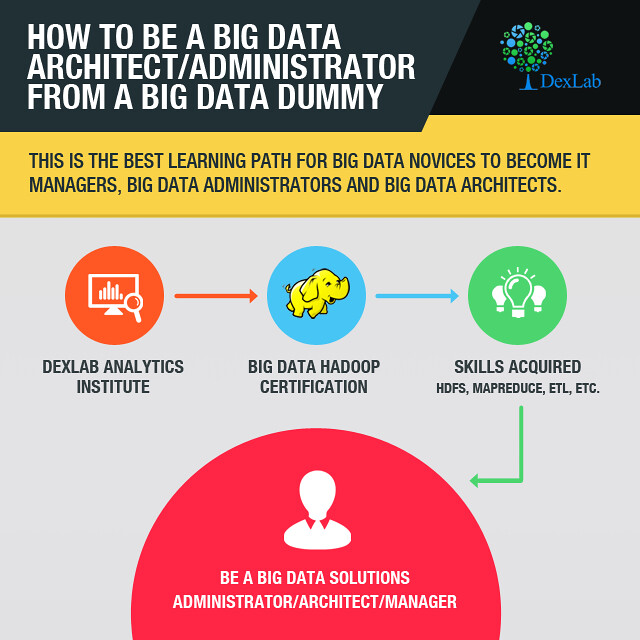
Dummies guide to being a Data Architect / Administrator

Visualizations

Data visualization is crucial. Tableau strongly emphasizes on visuals, while Power BI mostly stresses on dynamic data manipulation features along with providing access to basic visualizations. Under Power BI, users select the visualization first and then drag the data into it. It is easy to upload data sets. On the other hand, Tableau offers sophisticated visualizations for larger data sets as compared to Power BI. Here, users can select the data and switch between visualizations on the go. Hoping between visualizations is easier in Tableau.


5

In-depth analysis

Analysis of data by each solution is distinctive in its own ways. Where Tableau lays stress on the front end, Power BI works more on the back-end depth. Better analyses of data is possible with Power BI than it was with Excel. The meat and potatoes of Power BI is to provide faster analyses of standard data sets. In case of Tableau, the features highlighted here ensure users ways to answer questions while they delve deeper into investigating data visualizations. The strategy displays basic trends as forecasts, implement ‘what if’ questions to calibrate data hypothetically and visualize ingredients of data dynamically for better comparison and contrast.

When it comes to investigating familiar sets of data and Excel is no more efficacious, Power BI is highly recommended. Contrarily, for interactive superior visualizations, Tableau remains unparalleled. However, it fails to casts its charm in manipulating data, where its tailing counterpart Power BI proves its superiority.

2016-09-23-1474621255-9641969-bibusinessintelligencets100646689primary.idge_

Drawing an inference – Tableau is my personal favourite and is still the most productive BI Tool available in the market. However, from a business perspective, Power BI is continuously on its endeavour to elevate its quality and is at present one of the most appealing products in the data viz world.  

For a bright career in data analytics, enrol for intensive tableau training courses. DexLab Analytics is a top-notch data science online learning platform. Run your eyes through their tableau BI training courses today.


Interested in a career in Data Analyst?

To learn more about Data Analyst with Advanced excel course – Enrol Now.
To learn more about Data Analyst with R Course – Enrol Now.
To learn more about Big Data Course – Enrol Now.

To learn more about Machine Learning Using Python and Spark – Enrol Now.
To learn more about Data Analyst with SAS Course – Enrol Now.
To learn more about Data Analyst with Apache Spark Course – Enrol Now.
To learn more about Data Analyst with Market Risk Analytics and Modelling Course – Enrol Now.
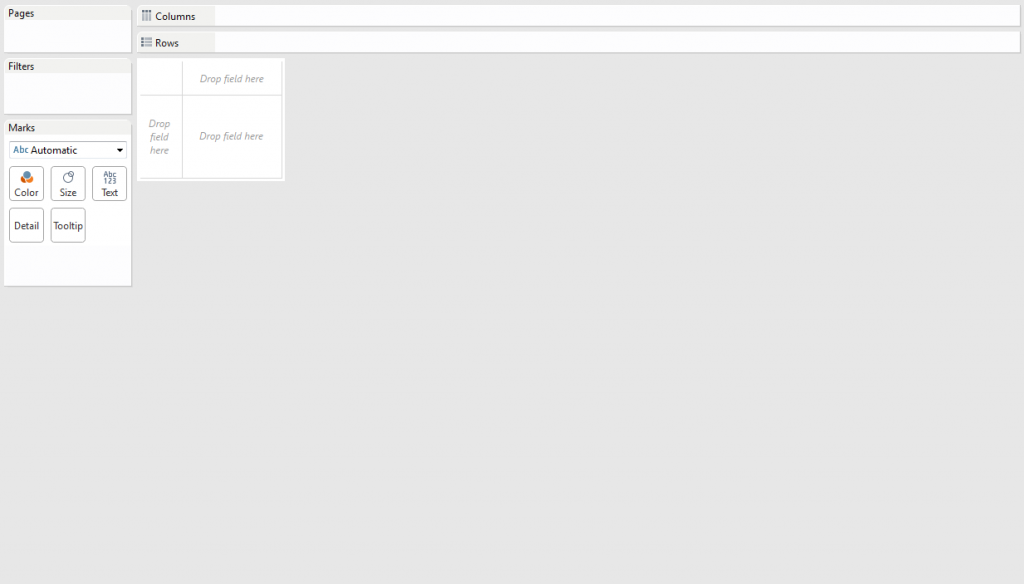
Battle the Blank Tableau Canvas Blues with These Nifty Tips

Battle the Blank Tableau Canvas Blues with These Nifty Tips

Do you experience vizzer’s block? Do you feel paralyzed by choices? Do you stare at the blank Tableau canvas, wondering from where to start your viz?

1

Though brimming with stories to tell, you are stuck at the get-go. Fortunately, here are a few tricks to help you get over the blank-canvas woes and get yourself rolling.

Draw your mind out

Doodling does help! Draw, doodle or sketch, just kick-start your cognitive thinking abilities. The scribbles don’t need to be pretty or legible, but they have to spur the creative process. So, grab a paper and pen, and start brainstorming.

2

And, you don’t have to go it alone. From academic researchers and lifestyle bloggers to professional visual consultants, the entire world is drawing.

Get inspired by ace visualizers

People inspire you, or they drain you – pick them wisely. Keep the right people by your side, they will lift you up and get the better out of you. Be in association with hotshot vizzes, follow maven data journalists and data vizzers, jot down notes and read data-viz pdfs.

ALWAYS, keep your eyes open to stumble across fetching viz, whose idea might work out well for you!

For example, this visualization by Washington Post tells a gripping food-survey story.

3

Develop a formidable structure to understand the data better

Frazzled about starting your viz? If affirmative, then this checklist can save your day. It is segregated into two parts – data preparation and data exploration.

Taking the first one first, i.e. Data Preparation:

As boring as it sounds, physical inspection of your data sometimes helps you comprehend the data set’s possibilities and challenges. To draw a clearer picture, here are few things to look into a data set:


  • The kind of data in each field
  • The pattern of data structure and format
  • Fields covered and not covered by the data set
  • Highest and lowest values in each field
  • Are there fields that contain null values


If you follow the above example, you will find there are multiple levels of data infused in the food-survey data set – where some food items boasts of four sub-categories, while others has only two. Situations like this make it hard to establish a comparison between two food items unless you know that they are at their minimum sub-category.

4

Coming to the second one, Data Analysis:

Analyse a data set just like interviewing it. Whenever you feel like going blank by staring at a Tableau canvas, start grilling yourself about data. Do it in a traditional interview way and you are sorted.
 

  • What, how, who, why, when, and where – Evaluate each field and ponder how to apply these questions on each field.
  • Let your inner child smile, while you ask “Why? Why? Why?” to your data.


To pop colours on your blank-canvas, interviewing is indispensable.

Remember: Every end is a new beginning

What if my final viz fails to shed light upon the deepest cognizance? Or, how will I feel if my viz cannot do justice to my story. Don’t worry, pondering is common. Get up and hit the road. There are countless number of ways to address a viz and remember that once you finish a viz, it doesn’t mean an end. Remaking and telling stories in newer and innovative ways are something you can always look up to anytime.

5

Turn the volume up and focus

Crank up the music, boost productivity and tune out distractions! Music helps in focusing on work, by diminishing outside noise (phone buzzing, colleagues chatting, TV blasting). Irrespective of the kind of tunes you like, plug in your headphones and say goodbye to the world!

original

Recently, tableau bi training courses are gaining a lot of attention. If you are seeking comprehensive tableau certification delhi, scroll through DexLab Analytics.


Interested in a career in Data Analyst?

To learn more about Data Analyst with Advanced excel course – Enrol Now.
To learn more about Data Analyst with R Course – Enrol Now.
To learn more about Big Data Course – Enrol Now.

To learn more about Machine Learning Using Python and Spark – Enrol Now.
To learn more about Data Analyst with SAS Course – Enrol Now.
To learn more about Data Analyst with Apache Spark Course – Enrol Now.
To learn more about Data Analyst with Market Risk Analytics and Modelling Course – Enrol Now.
Shadowing a Data Architect for a Day!

Shadowing a Data Architect for a Day!

A data architect is a noteworthy role in the present analytics industry. One can naturally evolve from a data analyst or a database designer to a data architect after gathering sufficient experience in the field. The prominence of this role showcases the emergence of the online websites and other internet avenues which require the integration of data from several unrelated data sources.

These data sources can be anything from:

  • External sources, like market feeds (for e.g. Bloomberg) or other News Agencies (like, Reuters)
  • Or they could be internal sources like exiting systems that collect data, for instance HR operations that gather employee data

Here is a depiction of a day in the life of a successful data architect:

Data analyst certification from a reputable analytics-training institute can help to speed up your process of evolution from being a data analyst to becoming a successful data architect!


Shadowing a Data Architect for a Day! from Infographics


Interested in a career in Data Analyst?

To learn more about Data Analyst with Advanced excel course – Enrol Now.
To learn more about Data Analyst with R Course – Enrol Now.
To learn more about Big Data Course – Enrol Now.

To learn more about Machine Learning Using Python and Spark – Enrol Now.
To learn more about Data Analyst with SAS Course – Enrol Now.
To learn more about Data Analyst with Apache Spark Course – Enrol Now.
To learn more about Data Analyst with Market Risk Analytics and Modelling Course – Enrol Now.

2.5 Quintillion Bytes of Data are Being Created Everyday

Astounding amounts of 2.5 quintillion bytes of data are created everyday today. Attached with this post is an informative infographic made by our team of trainers at DexLab Analytics.


The process of Big Data accumulation is best described as the collection of complex and large datasets of such an amount that it becomes difficult to process, capture, store, analyze and search them with the use of conventional data base systems.


It requires the use of more advanced mechanisms to do the same. Currently the use of Big Data is shaping the world around us, offering a deeper qualitative insight within our daily lives.

Continue reading “2.5 Quintillion Bytes of Data are Being Created Everyday”

CRACKING A WHIP ON BLACK MONEY HOARDERS WITH DATA ANAYTICS

Tax officials are tightening up their ropes with improved Big Data analytics to crack a whip on hoarders of black money.


  • Under the bill for amending Section 115BBE of the Income Tax Act, transactions with unexplained deposits in banks will be taxed.
  • As per this amendment, tax officials can now tax people on such deposits at a rate of 60 percent (cess additional) as opposed to the previously determined 30 percent.
  • This new tax law is applicable from the 1st of April, starting this year!


Cracking a Whip on Black Money Hoarders With Data Anaytics

Cracking a Whip on Black Money Hoarders With Data Anaytics

How are the Income Tax officials leveraging Big Data Analytics to curb black money?

Here are the simple signals that showcase a rise of Big data analytics use and a more planned crack down on Black Money hoarding:


  1. The IT department is now increasingly becoming tech savvy, it is now making use of analytics tools to assess the personal bank deposits for an improved black money crack down action plan.
  2. The income tax officials are making use of Big Data analytics tools for the first time ever done in the history of the Indian economy, to further maintain a hawk’s eye affixed on the target of bringing down black money.
  3. This is a new venture and earlier such advanced tools were only employed on corporate tax assessments.

Continue reading “CRACKING A WHIP ON BLACK MONEY HOARDERS WITH DATA ANAYTICS”

You Must Know These 7 Data Analytics Job Titles

You Must Know These 7 Data Analytics Job Titles

These days leveraging data be it big or small has become a powerful tool for all enterprises. IT firms are successfully transitioning to digital businesses and opportunities within the companies themselves are increasing to fulfil the growing demands.

So, if you want to join this megatrend in the job market, read on to find out the most in-demand data analytics job titles for today’s professionals:

Data scientist:

This job title has been getting a lot of attention since the past few years now. So much so, that even Glassdoor named it as the best career choice for optimum work/life balance. Their salaries are also comparatively higher.

But the field is still cloudy in terms of the job functions. So, let us understand what it actually means to be a data scientist.

According to Burch Works data scientists are people who “apply sophisticated quantitative measures and computer skills to both structure and analyze the massive amount of unstructured data sets or stream data continuously with an intention to derive information and prescribe action.

The executive recruiting firm says that the coding skills of these professionals are the main distinguishing factor that separates them from other predictive analytics professionals and allows them to exploit data regardless of its size, source and format.

These data professionals often have a master’s degree or a PhD in quantitative disciplines, such as applied math or statistics. They have expert skills and knowledge in statistical and machine learning methods and know tools like SAS, R etc. they are also proficient in other Big Data software like Hadoop and Spark.

2

Advanced analytics professional:

The professionals with this job role perform predictive analysis, prescriptive analysis, simulations, and all other forms of advanced analytics. Their role is however, significantly different from data scientists as they do not work with very large data sets and also not with unstructured data.

Data analyst:

A gamut of responsibilities fall under the job listings of a data analyst. They include ensuring data quality and governance, building different systems that enable businesses to gain user insights, performing actual data analysis and much more. However, the skill sets are similar and typically these professionals fit into the same category as advanced analytics professionals and data scientists, because they all can analyze data. But despite such similarities data analysts may be considered as more junior-level employees who are still in a way generalists and can fit into several different job roles within the organization.

Data engineers:

These are the wizards who work behind the scenes to make the jobs of data analysts and data scientists easier. They are technical professionals who have a deep understanding of Hadoop and other Big Data technologies like MapReduce, Hive, SQL and Pig, NoSQL technologies and other data warehousing systems.

Their primary job role is to construct the plumbing, build the data pipelines that clean, collect and aggregate data, organize it from different sources and then load them in data warehouses and databases.

Note that data engineers do not analyze data, but in other words keep the data flowing for processing so that other professionals can analyze them.

Business Analyst:

Business analysts can perform all the tasks that are almost the same for those who perform data analysis. However, business analysts generally have specialized knowledge of their specific business domain and then they apply that knowledge and analysis specifically for the business operations. For example, they may use their analytical skills to recommend improvement suggestions for the business.

Database Administrator:

These professionals are responsible for all things relevant to the operations, monitoring, and maintenance of the databases, often SQL or other relational database management systems also form their jurisdiction. Their tasks include installation, configuration, schemas definition, user training, and maintaining documents.

The database vendors like IBM, Oracle, Microsoft and others often offer certifications specific to their own proprietary technologies for such pros.

Business Intelligence professional:

BI professionals are responsible for adapting themselves with OLAP tools, reports and other data dashboards for looking at historical trends within data sets. Business Intelligence can have data visualization, and also include popular business intelligence platforms like Qlik, Tableau and Microsoft Power BI.

These were the most in-demand job titles in the data analysis industry, to help turn your career into the right direction take a look at our Big Data courses and have a job that you would thoroughly enjoy.


Interested in a career in Data Analyst?

To learn more about Data Analyst with Advanced excel course – Enrol Now.
To learn more about Data Analyst with R Course – Enrol Now.
To learn more about Big Data Course – Enrol Now.

To learn more about Machine Learning Using Python and Spark – Enrol Now.
To learn more about Data Analyst with SAS Course – Enrol Now.
To learn more about Data Analyst with Apache Spark Course – Enrol Now.
To learn more about Data Analyst with Market Risk Analytics and Modelling Course – Enrol Now.
Data analysis resources to keep you updated

Data analysis resources to keep you updated

One should always be proactive about building upon what they already know and have learnt, and with explosion of the web such resources can be obtained fairly easily. The problem is not the availability of resources but the abundance from it. Due to the availability of too many choices it often becomes difficult to gauge if the sources are actually authentic.

2

So, here is a list of books, websites and other resources which we think are authentic:

To stay on top of the latest trends and analyses reports and what’s new in the realm of analytics here are the best latest blogs:

  • FiveThirtyEight: the main man behind this blog is Nate Silver, a data whiz kid, this blog is the place to find out data analysis and visualizations of political, economic and cultural issues. The content in his blogs are usually light-hearted and interactive yet pointed with illustrative examples of data can be used in day-to-day activities.
  • Flowing Data: this is an interesting blog where Dr. Nathan Yau, PhD reveals how the data personnel – like designers, analysts, scientists and statisticians can analyze and visualize data to gather a better understanding of the world around us. It is especially fun to read as Yau offers a funny approach about the regular challenges faced by a data professional in this field. One can also find job recommendations, tutorials and other resources in this blog.
  • Simply statistics: this is another blog that is managed by expert professors each from Ivy League colleges like Johns Hopkins University, Harvard University and the Dana Ferber Cancer Institute. These professors also talk about how data is being used or misused around the world in different industries.
  • Hunch: this blog has been created by John Langford from Microsoft Research, he is the doctor of learning there and his blog talks about machine learning basics of what we know and how we use what we know. This is a good read for those who are new in the field of machine learning and do not yet know how things work in machine learning as it provides an in-depth view of new ideas and events going on in this industry.

To connect to other fellow data scientists and analysts to inquire about questions that may arise while you try the tread the treacherous roads of the data world, these are few communities of data analysts you can follow.

    1. Kaggle competitions: this is a popular community that all data scientists are likely to come across. This is a platform where one can find data prediction competitors. This is a platform where one can search for upcoming competitions in data analysis the website also features a forum where a visitor can ask any question or find a partner for the competition, share resources and ask for support to make a good career in data science.
    2. Metaoptimize: this is a question and answer community for people who are into machine learning, natural language processing, data mining and more. Badges are awarded as per votes on questions are awarded. Thus, making it becomes simpler for the visitors to discover the most popular helpful answers to the questions.
    3. Datatau: this website is best described as hacker news for data scientists and it lives up to this description to the last word. People share career advice with each other; interesting articles are shared amongst the users and then commented upon also the people here share useful information to those new to the world of data analytics.
    4. DexLab Analytics blogs: while DexLab Analytics is one of the leading data analytics training institute in Gurgaon, but they maintain regular blogs about the latest developments in the field of data science and provide India-specific as well global data related news. For students pursuing or aspiring to pursue a career in data science must follow the daily posts from this institute.

In conclusion we would like to add that while there are several resources from where one can obtain valuable information about data analysis. Thus, keeping this list as a starting point you can find several other experts out there to help you learn more about data analytics.


Interested in a career in Data Analyst?

To learn more about Data Analyst with Advanced excel course – Enrol Now.
To learn more about Data Analyst with R Course – Enrol Now.
To learn more about Big Data Course – Enrol Now.

To learn more about Machine Learning Using Python and Spark – Enrol Now.
To learn more about Data Analyst with SAS Course – Enrol Now.
To learn more about Data Analyst with Apache Spark Course – Enrol Now.
To learn more about Data Analyst with Market Risk Analytics and Modelling Course – Enrol Now.
Call us to know more