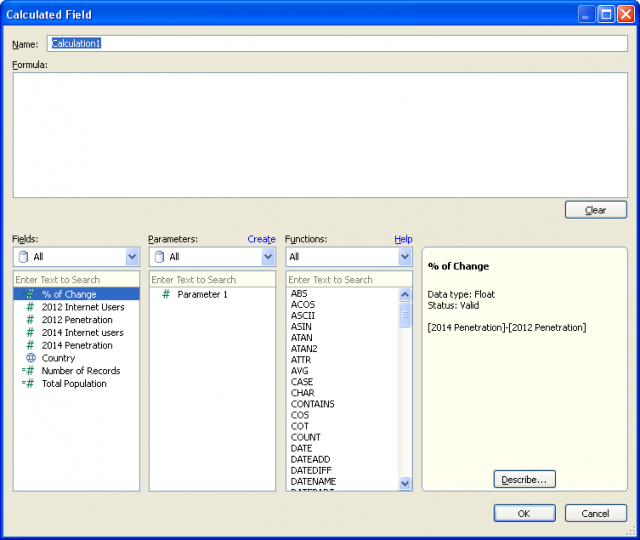
In this blog, we introduce Type Conversion Functions. In the earlier blogs of the Comprehensive Tableau Reference Guide blog series, we have covered Logical Functions, Number Functions and Date Functions. These blogs are easy-to-read and particularly helpful for Tableau rookies who want to develop a foundational knowledge about the Calculated Field fundamentals. These step-by-step guides are perfect for Tableau enthusiasts who want to understand how and when to use the various functions available in Tableau’s calculated fields.
Today, we will explain Type Conversion Functions. This group of functions enables users to change the data type of fields. You can convert the result of an expression to another data type. For example, using the Type Conversion functions, you can convert numbers, like age values, to strings. These functions are useful when the underlying data source needs some groundwork to harness the full potential of your visualization.
These functions are uncomplicated and easy to understand. So, let’s dive right in!
DATE Function
DATE(expression)
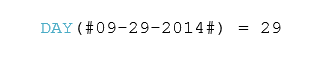
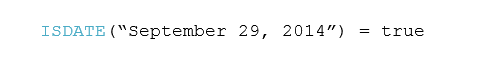
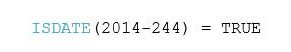
The date function is used to convert a number, string or date expression to a date. Example:
![]()
DATETIME Function
DATETIME(expression)
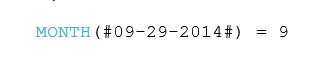
Datetime function takes the functionality of the Date function mentioned above a step further as it can be used to return a time component. This function is used to get back a datetime from a date, number or string expression. Example:
![]()
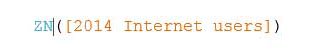
FLOAT Function
FLOAT(expression)
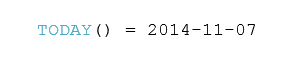
The Float function is used to return its argument as a floating point number. Example:
![]()
INT Function
INT(expression)
The INT function is used to convert its argument into an integer. This function truncates result of an expression to the integer closest to zero. Example:
![]()
STR Function
STR(expression)
The STR function is used to convert its argument into string data type. Example:
![]()
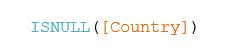
With the help of these functions, you can convert the result of arguments to different data types. For instance, if you want to make certain that all the values within date fields are date or datetime data types, then Date function and Datetime function comes very handy.
Want to learn about all the amazing features available in Tableau? Follow DexLab Analytics– we are among the leading institutes providing Tableau certification in Delhi. To know more about our Tableau BI training courses, visit our website. Check back for previous blogs where we have covered some essential Calculated Field functions.
This article has been sourced from: https://interworks.com/blog/ccapitula/2015/04/30/tableau-essentials-calculated-fields-type-conversion
Interested in a career in Data Analyst?
To learn more about Machine Learning Using Python and Spark – click here.
To learn more about Data Analyst with Advanced excel course – click here.
To learn more about Data Analyst with SAS Course – click here.
To learn more about Data Analyst with R Course – click here.
To learn more about Big Data Course – click here.