data analytics certification courses Archives - DexLab Analytics | Big Data Hadoop SAS R Analytics Predictive Modeling & Excel VBA

Not to Miss: The Startup India tableau at Republic Day 2020 parade

Not to Miss: The Startup India tableau at Republic Day 2020 parade

The commerce and industry ministry recently, in a written press briefing, said that it will showcase a tableau on Startup India, with an aim to promote innovation and entrepreneurship in the nation. The tableau will be displayed at the Republic Day Parade this year, in a first.

The name of the tableau is ‘Startups: Reach for the Sky’. It is themed on the stages of the life-cycle of a startup and the multifarious elements of support provided by the government, the ministry said in a press statement.

“The front of the tableau depicts a creative mind, full of ideas to solve real world problems. The Startup India Tree, in the middle will represent different kinds of support given,” a government official from the Department of Promotion of Industry & Internal Trade (DPIIT), said in the statement.

The staircase will stand for the various stages of growth – those are – coming up with a concept, creating a prototype, preparing a business plan, building a team, launching into markets and eventually scaling up, an Economic Times report said.

The wheel will denote sectors of economy where Indians have driven and given a fillip to economic growth and created employment opportunities on a big scale, the statement read. The wheel and the map of India together depict the width and the depth of the Startup India movement in the country.

Startup India is a flagship initiative of the Narendra Modi government, conceived with the intention of building a strong environment to nurture innovation, drive sustainable economic growth and generate large scale employment opportunities and job openings.

“We have a million problems, but at the same time we have over a billion minds,” Prime Minister Narendra Modi had said about the flagship programme started in January, 2016. In October, 2019 Prime Minister Narendra Modi said that the Indian startup ecosystem will help India achieve the $5 trillion target for the economy set by the government.  

The objective is to inspire and motivate youth to follow their dreams to generate wealth and become job creators and not just job seekers. Under the Startup India Scheme, eligible companies can get recognised as startups by the ministry in order to access a host of tax benefits, easier compliance, IPR fast tracking and other incentives.

More than 26,000 startups from 551 districts of 28 States and 7 Union Territories have been recognized so far. “Working across IT, Industry 4.0, education, healthcare, agriculture, energy, finance, space, defence and all other sectors of economy, Indian startups have attracted substantial global investments and created more than 2,91,000 jobs,” it added.

Besides DPIIT, the Department of Financial Services, Department of Drinking Water and Sanitation, NDRF Ministry of Home Affairs, CPWD Ministry of Housing and Urban Affairs, and Ministry of Shipping will also participate in the Republic Day parade.


Interested in a career in Data Analyst?

To learn more about Data Analyst with Advanced excel course – Enrol Now.
To learn more about Data Analyst with R Course – Enrol Now.
To learn more about Big Data Course – Enrol Now.

To learn more about Machine Learning Using Python and Spark – Enrol Now.
To learn more about Data Analyst with SAS Course – Enrol Now.
To learn more about Data Analyst with Apache Spark Course – Enrol Now.
To learn more about Data Analyst with Market Risk Analytics and Modelling Course – Enrol Now.

Most Popular Tableau Interview Questions with Answers to Learn Right Now

Most Popular Tableau Interview Questions with Answers to Learn Right Now

Tableau is dominating the business intelligence industry. It’s a powerful and fastest growing data viz tool used to simplify complicated raw data. It helps break the data into easy-to comprehend formats.

In this blog, we’ve compiled down the most popular Tableau Interview questions with their answers. The sample questions are framed by seasoned experts, who have encompassing knowledge on the subject matter – they have taken needed care and effort to help you get the correct answers. This will help you on your endeavor of job hunting!

2

Mention top 5 main products offered by Tableau.

Tableau specializes in these 5 products – Tableau Server, Tableau Desktop, Tableau Reader, Tableau Online and Tableau Public.

Name the latest version of Tableau Desktop.

Tableau Desktop Version 10.5.

Explain data visualization, and the use of Tableau.

Data visualization is an umbrella term referring to a set of well-defined techniques used for data communication through proper presentation and graphics (such as bars, diagrams, lines or points).

Tableau helps analyze data in an on-premise database, a cloud application, a normal database, a data warehouse or an Excel file – create interesting representations of data and share with your colleagues, friends and clients. You can also use Tableau to include other data too, and help keep your data up-to-date regularly.

Define filters. How many types of filters exist in Tableau?

In Tableau, there are several ways to filter and restrict your data – the outcome may be oriented towards improving performance, helping viewer get the right information or for highlighting something critical.

Three types of filters are as follows:

  • Context Filter
  • Quick Filter
  • Datasource Filter

Do you know how to remove all options from a Tableau auto-filter?

  1. Right click filter
  2. Customize
  3. Uncheck show all option

Why Tableau Extract is better over live connection?

Tableau Extract is easy to use, anywhere, anytime. For this, you don’t need any connection and can construct your own visualizations without connecting yourself with any database.

How many tables can you join in Tableau at the most?

Up to 32 tables can be joined in Tableau, but not more than that.

Define dimensions and facts.

To put simply, dimensions denotes text columns, while facts refer to measures, meaning numerical values.

Examples of dimensions – product name, city

Examples of facts – profit or sales

Highlight the difference between heat map and tree map.

Well, a heat map is an ideal method for comparing groups using size and color. Here, you can easily compare two distinct measures. On the other hand, a tree map is one of the most robust visualization, especially for graphically representing hierarchical data. 

For more in-depth knowledge on Tableau and its related applications, we recommend good Tableau training institutes in Delhi. Tableau certification Delhi is gaining a lot of prominence amidst the data analytics circuit. Hope this helps build a fine career for you!


The blog has been sourced fromintellipaat.com/interview-question/tableau-interview-questions


Interested in a career in Data Analyst?

To learn more about Data Analyst with Advanced excel course – Enrol Now.
To learn more about Data Analyst with R Course – Enrol Now.
To learn more about Big Data Course – Enrol Now.

To learn more about Machine Learning Using Python and Spark – Enrol Now.
To learn more about Data Analyst with SAS Course – Enrol Now.
To learn more about Data Analyst with Apache Spark Course – Enrol Now.
To learn more about Data Analyst with Market Risk Analytics and Modelling Course – Enrol Now.
3 Most Used Data Science Tools in 2018

The humongous amount of data calls for advanced data science tools – to completely understand and analyze the information.

Data analytics fuels digital transformation. The best way to do this is by arming an expert pool of statisticians, math pundits and business analysts with suitable data science tools with which they can squelch out crucial insights from the ever-growing silos of corporate data. This kind of initiatives promote a data-driven business culture, which acts as a present prerequisite – and this why here we’ve jotted down top 3 data science tools that’s weaving wonders with the new oil of the world, data:

2

Python

Both, well-performing software and a powerful programming language perfect for developing custom algorithms, Python is the most must-have tool for all data scientists. In a recent KDnuggets survey of 2052 users, Python language was recommended by 65.6% of respondents.

“We use Python both for data science and back end, which provides us with rapid development and machine learning model deployment,” shared Alexander Osipenko, lead data scientist at Cindicator Inc. “It’s also of great importance for us to ensure the security of implemented tools.”

Leslie De Jesus, innovation director and lead data scientist at Wovenware emphasized on the importance of Python libraries. “[We use] Python Libraries, including Scrapy, for web scraping and being able to extract data from the internet and upload it into a data frame for analysis,” said De Jesus.

Few others vouched for Python because of its multifaceted nature and strong optimization skills.

For Python Certification Training in Delhi, drop by DexLab Analytics.

R

Quite similar to Python, R is the go-to programming language for many data scientists and they depend on it wholly because it’s simpler and more specifically-built for data science. According to the KDnuggets poll, 48.5% respondents voted it to be one of the leading data science tools.

As for all, R programming language is blessed with cultivated capabilities for machine learning and statistics, and professionals love using it. It’s another favorite of data analysts, especially those who deals with a lot of data exploration.

“I can quickly see summary stats like mean, median and quartiles; quickly create different graphs; and create test data sets, which can be easily shared and exported to CSV format,” said Jon Krohn, chief data scientist at Untapt Inc.

Seeking R language certification in Delhi? We have DexLab Analytics for you!

Tableau

Bridging the gap between skilled data science teams and more business-oriented analytics consultants, Tableau Software is the fastest data visualization and dashboard tool. “It is a fantastic tool for data scientists and noobs working on data science,” said Pooja Pandey, senior executive for SEO at Entersoft Security. “[It’s a] quick dashboarding tool to visualize insights and analytical data with a very short learning curve.”

The lightening speed of Tableau’s visualization and reporting functions is commendable. It’s easy to learn, quick to implement and intuitive to use. Moreover, it helps different segments of a company to customize exhaustive reports according to their requirements.

Now, if you are looking for ways to hone your visualization skills, we would recommend Tableau BI training courses from DexLab Analytics. Their training courses are comprehensive, well-research and as per industry standards.


The blog has been sourced fromsearchbusinessanalytics.techtarget.com/feature/Data-scientists-weigh-in-5-data-science-tools-to-consider


Interested in a career in Data Analyst?

To learn more about Data Analyst with Advanced excel course – Enrol Now.
To learn more about Data Analyst with R Course – Enrol Now.
To learn more about Big Data Course – Enrol Now.

To learn more about Machine Learning Using Python and Spark – Enrol Now.
To learn more about Data Analyst with SAS Course – Enrol Now.
To learn more about Data Analyst with Apache Spark Course – Enrol Now.
To learn more about Data Analyst with Market Risk Analytics and Modelling Course – Enrol Now.
Fundamental Concepts of Statistics for Data Science Beginners- Part One

Fundamental Concepts of Statistics for Data Science Beginners- Part One

Do you aspire to be a data scientist? Then is it essential that you have a solid understanding of the core concepts of statistics. Everyone doesn’t have a Ph.D. in Statistics. And that isn’t the only way to excel in the field of data science. But yes, knowing stats well is a prerequisite for data science.

Nowadays, popularly used libraries, like Tesorflow, liberate the user from the intricacies of complex mathematics. Still, it is advisable to be familiar with the fundamental principles on which they work, because that will enable you to use the libraries better.

In this blog, we attempt to shed light on some basic concepts, theorems and equations of statistics for data science.

Statistical Distributions:

Statistical distributions are important tools that you must arm yourself with to be a skilled data scientist. Here, we shall talk about two important distributions, namely Poisson distribution and Binomial distribution.

Poisson distribution:
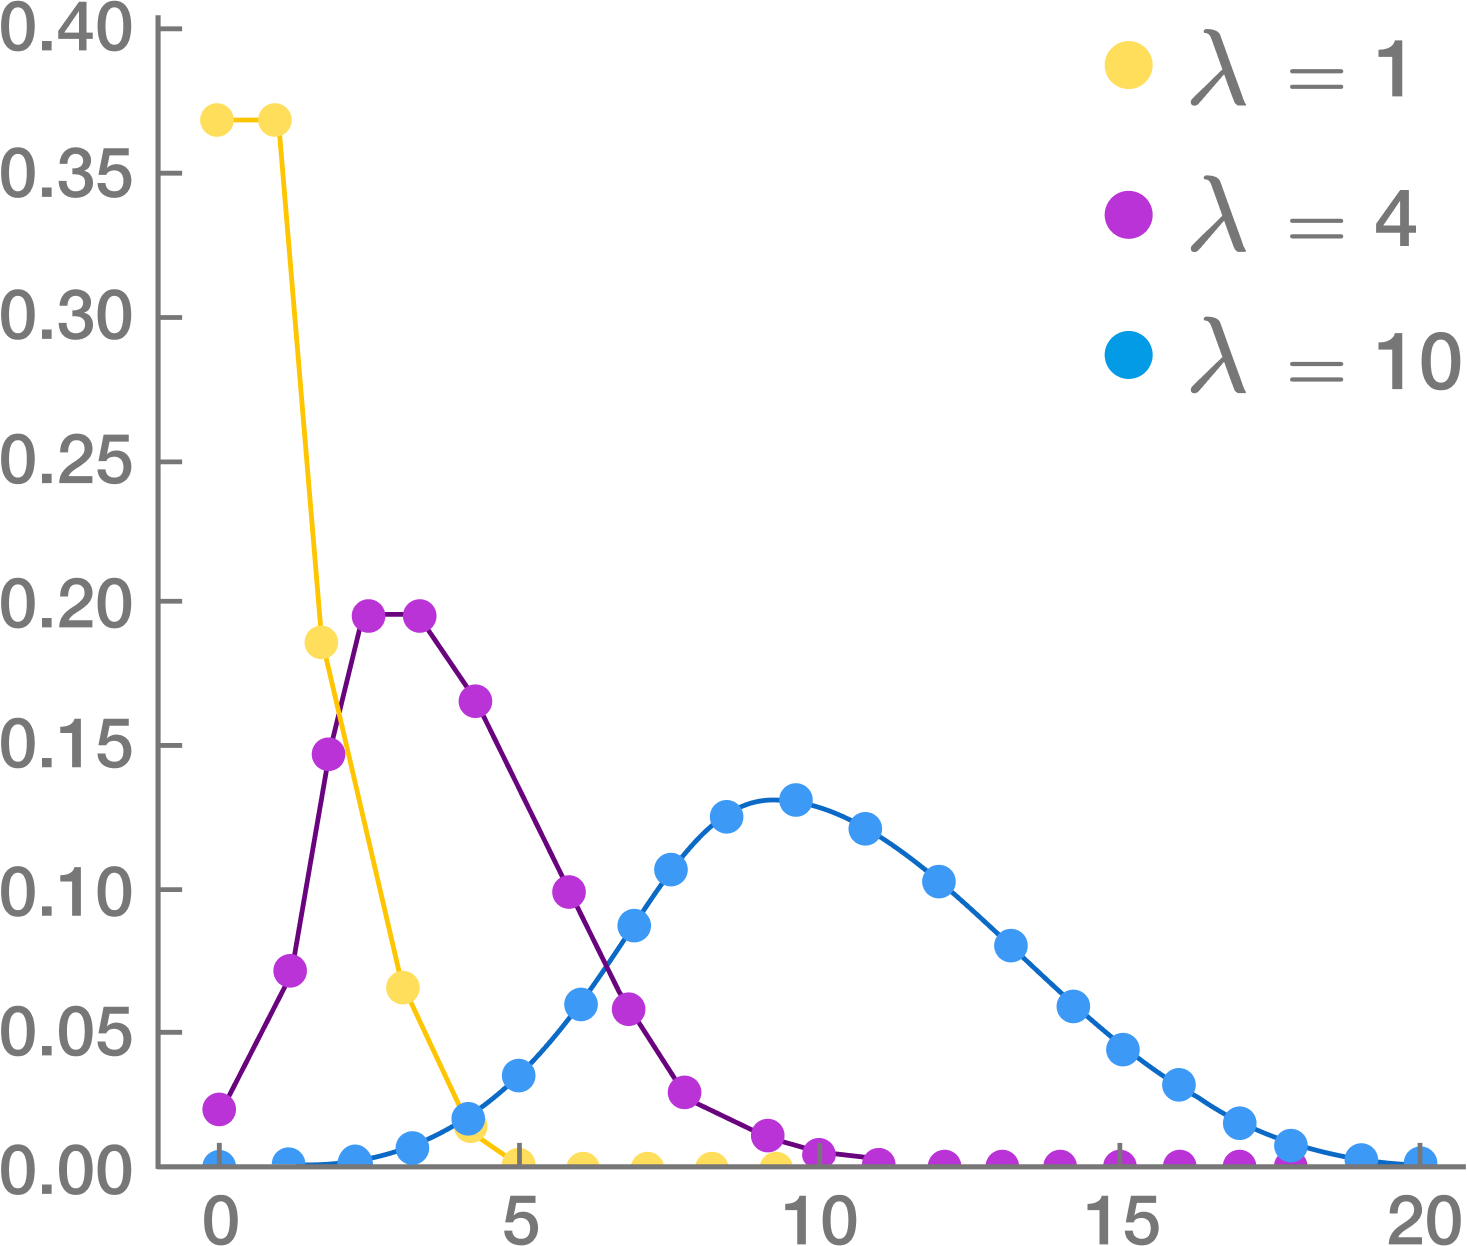
This distribution is used to find out the number of events that are expected to occur during an interval of time. For example, the number of page views in one second, the number of phone calls in a particular period of time, number of sales per hour, etc.

The symbols used in the equation are:

x: exact number of successes

e: constant equal to 2.71828 approximately

λ: average number of successes per time interval

Poisson distribution is used for calculating losses in manufacturing. Let us consider that a machine generates metal sheets that have ‘x’ flaws per yard. Suppose the error rate is 2 per yard of sheet (λ). Applying this information to Poisson distribution, we can calculate the probability of having exactly two errors in a yard.

Source: Brilliant.org

Poisson distribution is used for faster detection of anomalies.

Binomial distribution:

This is a very common distribution in Statistics. Suppose you have flipped a coin thrice. Using basic combinatorics for flipping a coin thrice, we see that there are eight combinations possible. We find out the probabilities of getting 0, 1, 2 or 3 heads and plot this on a graph. This gives us the binomial distribution for this particular problem. It must be remembered that Binomial distribution curve is similar to a Normal distribution Curve. Normal distribution is used when values are continuous and Binomial distribution is used for discrete values.

Source: mathnstuff.com

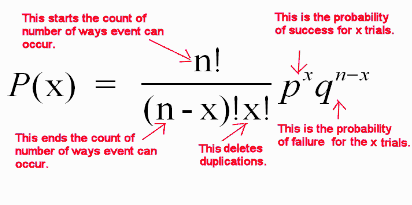
Binomial distribution is a discrete probability distribution where number of trials is predetermined and there are two possible outcomes– success and failure, win or lose, gain or loss. Depending on a few conditions, like the total number of trails is large, the probability of success is near 1 and the probability of failure is near 0, the trails are independent and identical, etc., the binomial distribution is approximated to a normal distribution.

Source: MathBitsNotebook

Binomial distribution has many applications in business. For example, it is estimated that 5% of tax returns for individuals with high net worth in USA is fraudulent. These frauds might be uncovered through audits. Binomial distribution is used to find out for ‘n’ number of tax returns that are audited, what is the probability for say 5 fraudulent returns to be uncovered.

There are some more probability distributions, like Bernoulli and Geometric distributions. We shall cover that and more in the following blogs. So, stay tuned and follow DexLab Analytics. The experts here offer top-quality data science courses in Delhi. Go through the data science certification details right now!


References:

upgrad.com/blog/basics-of-statistics-for-data-science

anomaly.io/anomaly-detection-poisson-distribution

analyticsvidhya.com/blog/2017/09/6-probability-distributions-data-science


Interested in a career in Data Analyst?

To learn more about Data Analyst with Advanced excel course – Enrol Now.
To learn more about Data Analyst with R Course – Enrol Now.
To learn more about Big Data Course – Enrol Now.

To learn more about Machine Learning Using Python and Spark – Enrol Now.
To learn more about Data Analyst with SAS Course – Enrol Now.
To learn more about Data Analyst with Apache Spark Course – Enrol Now.
To learn more about Data Analyst with Market Risk Analytics and Modelling Course – Enrol Now.

The Big Data Driven Future of Fashion: How Data Influences Fashion

The Big Data Driven Future of Fashion: How Data Influences Fashion

Big Data is revolutionizing every industry, including fashion. The nuanced notion of big data is altering the ways designers create and market their clothing. It’s not only aiding designers in understanding customer preferences but also helps them market their products well. Hadoop BI is one of the potent tools of technology that provides a wide pool of information for designers to design range of products that will sell.

2

How Does the Mechanism Work?

Large sets of data help draw patterns and obviously trends play a crucial role across the fashion industry. In terms of nature, fashion and trends both are social. Irrespective of the nature of data, structured or unstructured, framing trends and patterns in the fashion industry leads to emerging ideas, strategies, shapes and styles, all of which ushers you into bright and blooming future of fashion.

What Colors To Choose For Your Line?

KYC (Know Your Customer) is the key here too. A fashion house must know which colors are doing rounds amongst the customers. Big data tells a lot about which color is being popular among the customers, and based on that, you can change your offerings subject to trend, style picks and customer preferences.

Men’s or Women’s Clothing: Which to Choose?

Deciding between men’s or women fashion is a pivotal point for any designer. Keep in mind, target demographic for each designer is different, and they should know who will be their prospective customers and who doesn’t run a chance.

Big data tool derive insights regarding when customers will make purchases, how large will be the quantity and how many items are they going to buy. Choosing between men’s and women’s fashion could make all the difference in the world.

Arm yourself with business analyst training courses in Gurgaon; it’s high time to be data-friendly.

Transforming Runway Fashion into Retail Merchandise

Launching a brand in the eyes of the public garners a lot of attention, and the designs need to be stellar. But, in reality the fashion that we often see on runways is rarely donned by the ordinary customers; because, the dresses and outfits that are showcased on the ramp are a bit OTT, thus altered before being placed in the stores. So, big data aids in deciphering which attires are going to be successful, and which will fail down the line. So, use the power of big data prudently and reap benefit, unimaginable across the global retail stores.

Deciding Pricing of the Product

As soon as the garbs leave the runway, they are tagged with prices, which are then posted inside the stores, after analyzing how much the customers are willing to pay for a particular product. For averaging, big data is a saving grace. Big data easily averages the prices, and decides a single mean price, which seems to be quite justifiable.

However, remember, while pricing, each garments are designed keeping in mind a specified customer range. Attires that are incredibly expensive are sold off to only a selected affluent user base, while the pricing of items that are designed for general public are pegged down. Based on previous years’ data, big data consultants can decide the pricing policy so that there’s something for all.

The world of fashion is changing, and so is the way of functioning. From the perspective of fashion house owner, collect as much data as possible of customers and expand your offerings. Big data analytics is here to help you operate your business and modify product lines that appeals to the customers in future.

And from the perspective of a student, to harness maximum benefits from data, enroll in a data analyst course in Gurgaon. Ask the consultants of DexLab Analytics for more deets.


The article has been sourced from

channels.theinnovationenterprise.com/articles/8230-big-data-hits-the-runway-how-big-data-is-changing-the-fashion-industry

iamwire.com/2017/01/big-data-fashion-industry/147935

bbntimes.com/en/technology/big-data-is-stepping-into-the-fashion-world


Interested in a career in Data Analyst?

To learn more about Data Analyst with Advanced excel course – Enrol Now.
To learn more about Data Analyst with R Course – Enrol Now.
To learn more about Big Data Course – Enrol Now.

To learn more about Machine Learning Using Python and Spark – Enrol Now.
To learn more about Data Analyst with SAS Course – Enrol Now.
To learn more about Data Analyst with Apache Spark Course – Enrol Now.
To learn more about Data Analyst with Market Risk Analytics and Modelling Course – Enrol Now.
Step-by-Step Guide on Calculated Fields-String Functions in Tableau

Step-by-Step Guide on Calculated Fields-String Functions in Tableau

This blog is an easy-to-read article on String Functions in Tableau’s Calculated Field. Previously, we have covered many other functions in Calculated Fields, like Logical Functions, Date Function and Aggregate Functions. These step-by-step articles are meant for beginners who wish to be well acquainted with functions in Tableau. In fact, these blogs are great for all Tableau enthusiasts who want to explore the numerous amazing features available in Tableau.

So, let’s begin exploring String Functions.

Firstly, get to the Calculated Field window following the steps explained in the previous blog posts. Next, select the option ‘’String’’ from the Functions drop-down menu to view all the string functions.

ASCII Function

ASCII(string)

This function is used to return the ASCII code for the first character in a string. Example:

CHAR Function

CHAR(integer)

This function works in the reverse of ASCII function. CHAR function is used to change an integer ASCII code to a character. Example:

CONTAINS Function

CONTAINS(string, substring)

The CONTAINS function gives back the value TRUE if a string contains a specific substring and FALSE if it doesn’t contain it. Example:

ENDSWITH Function

ENDSWITH(string, substring)

This works in a similar way to the function described above. The function is used to indicate if a string ends with a selected substring or not, returning either TRUE or FALSE. Example:

FIND Function

FIND(string, substring, [start])

The FIND function is used to get the starting position of a substring within a string. The first character of the string is position 1. In case the substring is not located, then it returns the value 0. Example:

If the start argument is defined, any instance of the substring appearing before the start shall be ignored. Here’s an example:

ISDATE Function

ISDATE(string)

This function performs a logical test and is also included in the set of logical functions and date functions. It is used to test a string and determine if it is a valid date or not. Example:

LEFT Function

LEFT(string, num_chars)

A number is specified and using that this function returns the characters in the string. Example:

Incase start_of_week is excluded then it is determined based on the data source.

LEN Function

LEN(string)

This is the length function that is used to return the number of characters in a given string field. Example:

LOWER Function

LOWER(string)

This function is used to convert each and every character in a given string into lower case letters. Example:

LTRIM Function

LTRIM(string)

This function is used to remove spaces at the beginning of a string. Example:

MAX Function

MAX(a, b)

The Max function is included in many categories of functions. When used as a string function, the MAX function gives back the value that is highest in the sort sequence, which is defined by the database for that field’s column. If the field is NULL, then the function returns the value NULL. Example:

MID Function

MID(string, start, [length])

The MID function is used for obtaining characters from the middle of a text string. The start argument states the beginning of the returned value and the length argument gives the number of characters that is to be returned. In case the length isn’t included, then all the characters from the start position is considered. The first character in a string position is 1. Example:

MIN Function

MIN(a, b)

Works similary as the MAX function; the MIN function returns the minimum between a and b. Both must be of identical data type. With strings, the MIN function returns the lower value as per the sort sequence defined in the database. In case either of the argument is null, the function returns the value NULL. Example:

REPLACE Function

REPLACE(string, substring, replacement)

This function finds the occurrence of substring in a string and replaces them with the replacement string. If the substring cannot be located in the string then there’s no replacement. Example:

RIGHT Function

RIGHT(string, num_chars)

This works in reverse of the LEFT function. It gives back the characters starting at the end of a given string. And the amount of characters is determined by the argument giving the number of characters. Example:

RTRIM Functon

RTRIM(string)

This is similar to the LTRIM function and removes trailing spaces at the end of a string. Example:

SPACE Function

SPACE(number)

The SPACE function returns a string of spaces and the number of spaces is mentioned in the number argument. Example:

STARTSWITH Function

STARTSWITH(string, substring)

This works in reverse of the ENDSWITH function and returns TRUE or FALSE depending on whether a string starts with the given substring or not. Example:

TRIM Function

TRIM(string)

The TRIM function removes any leading or trailing spaces in a particular string. Example:

UPPER Function

UPPER(string)

The last function in the list of string function- the UPPER function works in reverse of the LOWER function. It is used to convert all the characters in the string to uppercase characters. Example:

This brings us to an end of the String functions. If you want to learn about the other functions in calculated fields then you must follow DexLab Analytics and check back for our previous blog posts.

This is the concluding blog of the blog series on Tableau’s Calculated Field functions. If you want to learn more about Tableau’s fantastic features then enroll for Tableau BI training courses. We offer professional Tableau certification in Delhi.

 
This article has been sourced from:
https://www.interworks.com/blog/ccapitula/2015/04/22/tableau-essentials-calculated-fields-string-functions
 

Interested in a career in Data Analyst?

To learn more about Data Analyst with Advanced excel course – Enrol Now.
To learn more about Data Analyst with R Course – Enrol Now.
To learn more about Big Data Course – Enrol Now.

To learn more about Machine Learning Using Python and Spark – Enrol Now.
To learn more about Data Analyst with SAS Course – Enrol Now.
To learn more about Data Analyst with Apache Spark Course – Enrol Now.
To learn more about Data Analyst with Market Risk Analytics and Modelling Course – Enrol Now.
Guide on Tableau Essentials: Get Started with Calculated-Field User Functions

Guide on Tableau Essentials: Get Started with Calculated-Field User Functions

We are back with another article on Calculated Fields in Tableau! These step-by-step guides are for helping Tableau rookies master the basics of Tableau software. Not just beginners, these articles are suitable for all Tableau enthusiasts who want to explore the multiple cool features available in Tableau’s Calculated Field.

In today’s blog, we are discussing User Functions. User functions can generate filters depending on the data source. It is used to reference the identity, domain and membership of the current user on Tableau Server or Tableau Online. To access the User Functions window, right click on the Measure or Dimension window and select the option ‘’Create Calculated Field’’. Next select the option ‘’User’’ from the function drop-down menu.

Now, let’s examine the different User Functions one by one.

FULLNAME Function

FULLNAME()

The FULLNAME Function is used to return the full name of the current user. The full name is the Tableau Server or Tableau Online name used to sign in. Except for that, the Tableau Desktop user’s local or network full name is used. Example:

ISFULLNAME Function

ISFULLNAME(string)

This function gives back the value ‘’TRUE’’ if the user’s full name matches the specified string and returns ‘’FALSE” if it doesn’t match. Example:

ISMEMBEROF Function

ISMEMBEROF(string)

If the logged-in person currently using Tableau is a member of the group that matches the string then the ISMEMBEROF function gives back ‘’TRUE’’.  It returns ‘’FALSE’’ if the member is not signed in. Example:

ISUSERNAME Function

ISUSERNAME(string)

The ISUSERNAME Function is used to perform a true/false test where it returns ‘’TRUE’’ when the logged-in user’s name matches the string. Example:

USERDOMAIN Function

USERDOMAIN()

Once the user is signed into Tableau Server, the USERDOMAIN function may be used to return his/her domain. It returns the Windows domain when the user is on a domain. If not, then the function returns a null string. Example:

USERNAME Function

USERNAME()

The USERNAME function returns the username of the current tableau desktop user, which is the Tableau Server or Tableau Online username if the user is signed in. In case the user isn’t signed in, the local or network username is shown. Example:

This brings us to a close on user functions. These functions are one of the many amazing features of Tableau Software that offer users high-level of flexibility. They are very useful for developing customized views on Tableau server or Tableau Online, as the functions work like filters that limit what is visible to users depending on their username and domain.

Calculated fields make Tableau dashboards way more functional. In these blogs, we are covering the basics so you understand how to apply the functions. If you are interested to learn more about Tableau, then you must follow DexLab Analytics. We are a leading Tableau training institute in Delhi. Check back for our previous blogs on Tableau’s Calculated Field functions and definitely go through the details of Tableau BI training courses, which are available on our website.


This article has been sourced from: https://www.interworks.com/blog/ccapitula/2015/05/14/tableau-essentials-calculated-fields-user-functions


Interested in a career in Data Analyst?

To learn more about Data Analyst with Advanced excel course – Enrol Now.
To learn more about Data Analyst with R Course – Enrol Now.
To learn more about Big Data Course – Enrol Now.

To learn more about Machine Learning Using Python and Spark – Enrol Now.
To learn more about Data Analyst with SAS Course – Enrol Now.
To learn more about Data Analyst with Apache Spark Course – Enrol Now.
To learn more about Data Analyst with Market Risk Analytics and Modelling Course – Enrol Now.
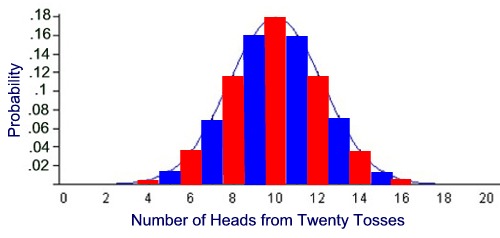
Tableau Basics: An Article on Aggregate Functions in Calculated Fields

Tableau Basics: An Article on Aggregate Functions in Calculated Fields

Want to be an expert in Tableau? Then you must start with the basics and learn them well. And to help you in your endeavors, we have created a blog series covering the fundamentals of Tableau. These articles are easy-to-follow and shall help you understand how and when to use the Calculated Field functions.

In this blog, we discuss Aggregate Functions. In Aggregate Functions, we group together multiple rows of values to form a single input value that is more meaningful, like a set or list. In order to access these functions select the option ‘Aggregate’ from the drop down list for functions in the ‘Create Calculated Filed’ window.

Now, let’s discuss the different types of Aggregate Functions one by one ad look into a few examples. A person having some experience in Excel will find these functions familiar.


ATTR Function
ATTR(expression)


The ATTR function, short form for attribute, gives back a value when all rows have a single value. In case the values in the rows are different, the value ‘’*” is returned. It ignores null values. Example:

AVG Function
AVG(expression)


The AVG function returns a value that is the average of all the values in a given expression. It is used only for numeric fields. Null values are not considered. Example:

COUNT Function
COUNT(expression)


COUNT function returns the number of items present in a particular group. Null values are ignored. Example:

COUNTD Function
COUNTD(expression)


COUNTD function returns distinct items in a group and counts them only once. Null values are ignored.

The function isn’t offered in certain types of workbooks, like the ones that were created prior to Tableau Desktop v8.2, workbooks where MS Excel or text files are used as sources of data, etc. Example:

MAX Function
MAX(expression)


A MAX function is used to obtain the maximum of two expressions for each record or the maximum of a single expression across all records. The two expressions must have the same type of argument. If either of the arguments is NULL, then NULL value is returned. Example:

MEDIAN Function
MEDIAN(expression)


The median is the middle value of a sequence and the MEDIAN function is used to obtain the median for one particular expression. It only works for fields that are numeric. In case null values are present, they are ignored. Example:

MIN Function
MIN(expression)


The functionality of this function is similar to the MAX function. It is used to return the minimum of a single expression across all records or the minimum between two expressions for each record. If either of the two values is NULL, then a NULL value is returned. Like before, both the expressions need to have the same type of argument. Example:

PERCENTILE Function
PERCENTILE(expression, number)


A number between O and 1 is given and PERCENTILE function returns the percentile expression corresponding to that number. If 0.50 is given, then it returns the median number. Example:

STDEV Function
STDEV(expression)


This is actually a statistical function and stands for standard deviation. STDEV function is used to obtain the statistical standard deviation for all values for a specific expression pertaining to the sample of a population.


STDEVP Function
STDEVP(expression)


The STDEVP function is similar to the STDEV function above, but it returns the statistical standard deviation for all the values in an expression that pertains to a biased population.


SUM Function
SUM(expression)


Simply put, this function adds up all the values in an expression. Example:

VAR Function
VAR(expression)


VAR is another statistical function that returns the statistical variance for all the values in an expression pertaining to a sample of the population.


VARP Function
VARP(expression)


Similar to the function above, VARP function returns the statistical variance for all the values of an expression that pertains to the entire population.

Calculated Fields:

Calculated fields enable users to create more robust visualizations in Tableau. If you have missed our earlier blogs on Calculated Field functions, then visit the blog section of DexLab Analytics-we provide one of the best Tableau certifications in Delhi.

In order to be a Tableau expert, you need to enroll for comprehensive and well-structured Tableau BI training courses.


This article has been sourced from: www.interworks.com/blog/ccapitula/2015/05/07/tableau-essentials-calculated-fields-aggregate-functions


Interested in a career in Data Analyst?

To learn more about Data Analyst with Advanced excel course – Enrol Now.
To learn more about Data Analyst with R Course – Enrol Now.
To learn more about Big Data Course – Enrol Now.

To learn more about Machine Learning Using Python and Spark – Enrol Now.
To learn more about Data Analyst with SAS Course – Enrol Now.
To learn more about Data Analyst with Apache Spark Course – Enrol Now.
To learn more about Data Analyst with Market Risk Analytics and Modelling Course – Enrol Now.

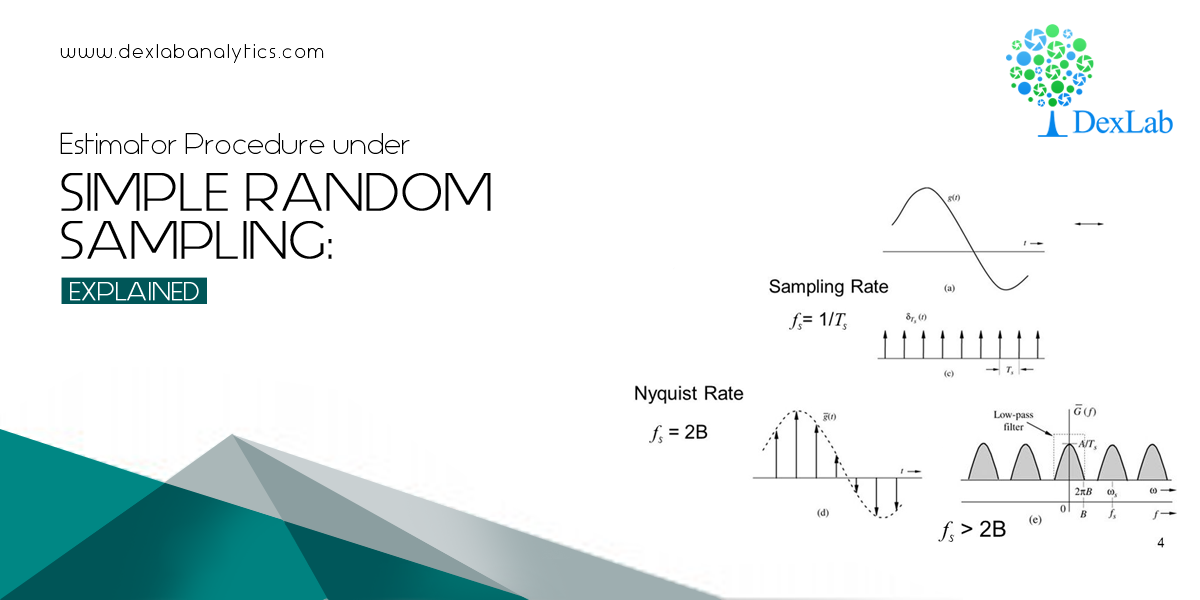
Estimator Procedure under Simple Random Sampling: EXPLAINED

Estimator Procedure under Simple Random Sampling: EXPLAINED

In continuation with the previous introductory blog on sampling: An ABC Guide to Sampling Theory, we will take a closer look into the concept of the estimator procedure under Simple Random Sampling with the help of mathematical examples. It will help us understand the underlying phenomenon, the manner to be precise in which the estimator function of sampling works.

Simple random sampling (SRS) is a method of selecting a sample comprising ‘n’ number of sampling units out of the population of ‘N’ number of sampling units such that every sampling unit has an equal chance of being chosen.

The Estimator Procedure under Simple Random Sampling

The process of selection of a sample under SRS (Simple Random Sampling) is random. This means, each number of the population has an equal probability of getting selected, which makes each of the observation identical and independently distributed.

The statistic chosen by the investigation of estimation of random samples need to satisfy a set of certain properties given below:

  1. Unbiasedness
  2. Consistency
  3. Sufficiency
  4. Efficiency

As a matter of fact, investigation is always about coming up with an idea regarding the population parameters based on the sample observations. The best part would be to formulate an unbiased, consistent estimator, which is also efficient. Normally, a sample mean for a set of sample observations is considered to be a very desirable estimator to form ideas about population parameters.

In detail, let’s examine the relevance of each of the properties of an estimator:

Unbiasedness of an estimator

Take a look at the below examples to understand the very idea of unbiasedness.

Example 1:

Answer:-

According to the problem, we have

Adding (1) & (2), we get,

So, from (3), we get:-

 is called an unbiased estimators for .

Now, subtracting (2) & (1), we get –

Example 2:

Assume that an investigator draws a sample from this population using SRSWR. Then show that the sample mean is an unbiased estimator for the population mean.

Now, by specification we have:-

We are redefined to show that:-

L.H.S  :

DexLab Analytics Presents #BigDataIngestion

DexLab Analytics Presents #BigDataIngestion


Data sampling is the key to business analytics and data science. On that note, DexLab Analytics offers state of the art Data Science Certification for all data enthusiasts. Recently, they have organized a new admission drive #BigDataIngestion offering exclusive 10% off on in-demand courses, including big data, machine learning and data science courses.


Interested in a career in Data Analyst?

To learn more about Data Analyst with Advanced excel course – Enrol Now.
To learn more about Data Analyst with R Course – Enrol Now.
To learn more about Big Data Course – Enrol Now.

To learn more about Machine Learning Using Python and Spark – Enrol Now.
To learn more about Data Analyst with SAS Course – Enrol Now.
To learn more about Data Analyst with Apache Spark Course – Enrol Now.
To learn more about Data Analyst with Market Risk Analytics and Modelling Course – Enrol Now.

Call us to know more