Astounding amounts of 2.5 quintillion bytes of data are created everyday today. Attached with this post is an informative infographic made by our team of trainers at DexLab Analytics.
The process of Big Data accumulation is best described as the collection of complex and large datasets of such an amount that it becomes difficult to process, capture, store, analyze and search them with the use of conventional data base systems.
It requires the use of more advanced mechanisms to do the same. Currently the use of Big Data is shaping the world around us, offering a deeper qualitative insight within our daily lives.
When you work in the SEO and PPC industry it is a giveaway that you will be handing a large amount of data. While there are several ways you can utilize this data and manage it with Excel functions, and several tutorials are available online to talk about them. But what if you do not have the functions on Excel to do what you have to do with the data. You can use the Visual Basic for Applications (VBA) feature in MS Excel and write your own functions to help Excel carry out the functions that you want it to.
So, here in this advanced Excel trainingblog post, we will discuss about how to write a simple custom Excel function and will also give you readers some general advice on how to get started with Excel VBA.
Getting started with the Excel VBA editor:
First in order to work with the VBA editor in Excel, you must open a new Excel workbook or document and then press the following keys on your keyboard – ALT + F11. This will open a new window on the screen which is the VBE (Visual Basic Editor). This is where you can write your own Excel functions to use with the spreadsheet you have opened in your Excel document. This will be highlighted on the top left corner of the window. The project explorer pane will have the icons for each sheet of the document and another one for the whole of the workbook itself.Then for the next step, right-click on the ‘ThisWorkbook’, and then go to ‘Insert’ and then ‘Module’ options. That will further add a code module along with a container for the code which we will learn to write here.
Now you are ready to write your first Excel function:
Data analysis will help you analyze the keywords:
Each element of the data gathered through the SEO and PPC will often have keywords and phrases and this can give birth to a large amount of data for people to work with. For a recent piece of analysis, our faculty member was asked to find a method for counting the number of words in a search term. In this way single keywords can be dealt with differently in comparison to phrases. Like for e.g. ‘dresses’ can be treated with a stark difference to the term ‘red party dresses’. But there are often 100s or even 1000s of keywords to work with and it will be too time consuming to manually count the number of words in each phrase. Also there are no in-built functions in MS Excel to do so for us. Hence, we must use VBA to write new functions for us.
Adding the code:
Function countWords(phrase as string) as Integer
This will be the first line of the function you are about to write, start by copying it into the module we just created. Copy it under the words ‘Option Explicit’ which should be anyway entered (if it is not then do not worry, just copy it at the top and we can come to this later). This sentence however, has a lot of important things to tell us about.
Function: this first word itself tells us about which code is going to follow. A function is simply a piece of code that takes one or more values, performs something with them and then returns a different value. For instance, there is a built-in function with Excel called SUM. This function may take some input values and add them together to return a different value which is the sum total of the inputs. Similarly the function we create will take the keywords or phrases as an input and then count the number of words in them, then return a value for that number.
CountWords: we have put this as the name of our function. The moment we wish to use it, we can simply input into the spreadsheet cell the words as ‘countWords’. Just like we would add ‘SUM’ to use the sum function.
Phrases as string: this is the input will be the one to be entered when we will need to search a keyword or phrase.
As integer: this is the type of information which will be returned by the function. We are only interested in the number of the whole words in the phrases and hence are aiming to return an integer value.
How to prepare the function:
The next thing to do is to prepare the function by declaring the variables. Here we will declare the variables in ‘countWords’ as integers because it is built to only take integers. This will allow Excel to warn us if anything unexpected happens. For example, if we want to use a function to count the words in ‘red party dresses’ and it only returns with party. This will mean that something has gone wrong for sure. So, with declaration of the variable we will be able to let Excel know that it is not an integer and hence it will return with an error warning.
The variables we will use in this function are going to be called as ‘I’ and ‘counter’, however, there is no hard and fast rule to name your variables this way, you can name it the way you like. But ‘I’ is usually used as an abbreviation for index and counter will just be used as counter. The next step will be to add this line into your code.
‘Counts number of occurrences of space character in a phraseDim i as integerDim counter as integer: counter = 1
Note that ‘dim’ here is short for dimension. This describes the data type of a variable. We have told Excel through our codes that the variable ‘counter’ will always be an integer. We have also given the initial value as 1. But currently ‘I’ has no value assigned to it. The first line should appear green in the code window, this is mostly because of the apostrophe that precedes it. This line in our code is merely a comment and does not do anything within the code. It only exists as a label to let us know what the use of the code is for. It is a good practice to comment your code as otherwise it often becomes very hard to understand it otherwise. Also feel free to add in your own comments throughout to help understand and all you have to do for it is to add an apostrophe before it.
How can you count the words?
You must understand that Excel has no preconceived notions about what a word is. So to count them the concept has to be broken down for it to understand in a few short steps. One of the key features of a word is that it has a space either after or before or even at times in between it, and often both.
So we can start by simply telling Excel to count these spaces:
For i = 1 To Len(phrase)
If Mid(phrase, i, 1) = ” ” Thencounter =
counter + 1
End If
Next i
This is one of the key areas of this function, you must paste it or type it out in the code module. You can do so line-by-line as well. But here is an explanation of what is happening with each step:
For i = 1 To Len(phrase)
Here we have given ‘i’ a value, in fact not just one value but a range of values from 1 to Len (phrase). This is a built-in function with Excel that may return the number of characters (letters + spaces) in the phrase we pass it in. f Mid(phrase, i, 1) = ” ” Then
With this line of the code we are using the ‘Mid’ function in excel. This will ask excel to look into each character in the phrases in turn. This function takes 3 inputs which is – the phrases to be looked at, the character to begin comparison on, and the number of characters to compare with. We aim to compare every letter with one at a time approach. So, we would pass on ‘I’ and 1. And then finally the ‘If’ statement which says that if a character uses spaces, then excel should proceed to the next line of code. Or pass it over to the ‘End If’ statement.
counter = counter + 1
This line is only activated when a space is discovered. So, we increase our counter variables by 1 every time to count the number of spaces in the phrase.
End If Next i
With the above two lines, we are able to let Excel know where the If statement ends and to go back to the top and the start again for the next value of ‘i’. This is called as a ‘For Loop’ as we letting Excel know that it must repeat this task for a certain number of iterations.
There is also one last piece of code which we will make use of in order to handle a particular situation. When the phrase is passed in is blank. Then copy the following with what you already have:
If phrase = “” Then
countWords = 0
Else
countWords = counter
End If
Here is another statement that we have. If the phrase we input is blank, countWords takes the value 0, or else it will take the value of the ‘counter’ variable. After setting the ‘counter’ to 1 initially, we ensure the code will work for single words. However, it may also return 1 for blank phrases, and this prevents errors from occurring.
End Function
Finally with that we tell excel that we have finished defining our function. Here is the full code as mentioned below, check if yours looks the same or not:
Image Source: us.searchlaboratory.com
After you are done, you can close the VBE by clicking on the ‘X’ in the corner and then going back to the spreadsheet. Once done type in some words in a few cells and then type ‘countWords’ in another cell. And then click one of your cells containing the texts and then close the parenthesis. This cell can now contain the number of words in the cell that we have input. If it doesn’t, then we can set it to ‘automatic’ (Formulas > Calculations Options > Automatic in Excel 2010.
This simple function works best to save time as it can be dragged down over as many cells as you’d like, with hundreds of keywords and phrases. However, you must keep its limitations in mind. We are counting the spaces and not just words.
Interested in a career in Data Analyst?
To learn more about Data Analyst with Advanced excel course – Enrol Now. To learn more about Data Analyst with R Course – Enrol Now. To learn more about Big Data Course – Enrol Now.
To learn more about Machine Learning Using Python and Spark – Enrol Now. To learn more about Data Analyst with SAS Course – Enrol Now. To learn more about Data Analyst with Apache Spark Course – Enrol Now. To learn more about Data Analyst with Market Risk Analytics and Modelling Course – Enrol Now.
These days leveraging data be it big or small has become a powerful tool for all enterprises. IT firms are successfully transitioning to digital businesses and opportunities within the companies themselves are increasing to fulfil the growing demands.
So, if you want to join this megatrend in the job market, read on to find out the most in-demand data analytics job titles for today’s professionals:
Data scientist:
This job title has been getting a lot of attention since the past few years now. So much so, that even Glassdoor named it as the best career choice for optimum work/life balance. Their salaries are also comparatively higher.
But the field is still cloudy in terms of the job functions. So, let us understand what it actually means to be a data scientist.
According to Burch Works data scientists are people who “apply sophisticated quantitative measures and computer skills to both structure and analyze the massive amount of unstructured data sets or stream data continuously with an intention to derive information and prescribe action.
The executive recruiting firm says that the coding skills of these professionals are the main distinguishing factor that separates them from other predictive analytics professionals and allows them to exploit data regardless of its size, source and format.
These data professionals often have a master’s degree or a PhD in quantitative disciplines, such as applied math or statistics. They have expert skills and knowledge in statistical and machine learning methods and know tools like SAS, R etc. they are also proficient in other Big Data software like Hadoop and Spark.
Advanced analytics professional:
The professionals with this job role perform predictive analysis, prescriptive analysis, simulations, and all other forms of advanced analytics. Their role is however, significantly different from data scientists as they do not work with very large data sets and also not with unstructured data.
Data analyst:
A gamut of responsibilities fall under the job listings of a data analyst. They include ensuring data quality and governance, building different systems that enable businesses to gain user insights, performing actual data analysis and much more. However, the skill sets are similar and typically these professionals fit into the same category as advanced analytics professionals and data scientists, because they all can analyze data. But despite such similarities data analysts may be considered as more junior-level employees who are still in a way generalists and can fit into several different job roles within the organization.
Data engineers:
These are the wizards who work behind the scenes to make the jobs of data analysts and data scientists easier. They are technical professionals who have a deep understanding of Hadoop and other Big Data technologies like MapReduce, Hive, SQL and Pig, NoSQL technologies and other data warehousing systems.
Their primary job role is to construct the plumbing, build the data pipelines that clean, collect and aggregate data, organize it from different sources and then load them in data warehouses and databases.
Note that data engineers do not analyze data, but in other words keep the data flowing for processing so that other professionals can analyze them.
Business Analyst:
Business analysts can perform all the tasks that are almost the same for those who perform data analysis. However, business analysts generally have specialized knowledge of their specific business domain and then they apply that knowledge and analysis specifically for the business operations. For example, they may use their analytical skills to recommend improvement suggestions for the business.
Database Administrator:
These professionals are responsible for all things relevant to the operations, monitoring, and maintenance of the databases, often SQL or other relational database management systems also form their jurisdiction. Their tasks include installation, configuration, schemas definition, user training, and maintaining documents.
The database vendors like IBM, Oracle, Microsoft and others often offer certifications specific to their own proprietary technologies for such pros.
Business Intelligence professional:
BI professionals are responsible for adapting themselves with OLAP tools, reports and other data dashboards for looking at historical trends within data sets. Business Intelligence can have data visualization, and also include popular business intelligence platforms like Qlik, Tableau and Microsoft Power BI.
These were the most in-demand job titles in the data analysis industry, to help turn your career into the right direction take a look at our Big Data courses and have a job that you would thoroughly enjoy.
Interested in a career in Data Analyst?
To learn more about Data Analyst with Advanced excel course – Enrol Now. To learn more about Data Analyst with R Course – Enrol Now. To learn more about Big Data Course – Enrol Now.
To learn more about Machine Learning Using Python and Spark – Enrol Now. To learn more about Data Analyst with SAS Course – Enrol Now. To learn more about Data Analyst with Apache Spark Course – Enrol Now. To learn more about Data Analyst with Market Risk Analytics and Modelling Course – Enrol Now.
Big Data has proved to be inevitable for business organisations in the quest for stepping ahead of their competitors. Nevertheless, only having Big Data at hand does not solve problems. You also need the availability of efficient analytics software that can put your data to the best use.
A business analytics tool is responsible for analysing massive amounts of data in order to extract valuable information. Such information in turn, can be used for improving operational efficiency and for taking better decisions.
So, let us here go through the top 10 data analytics tools available in the market.
Yellowfin BI
Yellowfin Business Intelligence (BI) is a reporting, dashboard and data analysis software. The software is able to conduct analysis of huge amounts of database, in order to figure out appropriate information. With Yellowfin, your dashboard can be easily accessible from everywhere including company intranet, mobile device or web page.
Business Intelligence & Reporting Tools (BIRT)
BIRT is open source software programmed for JAVA and JAVA EE platforms. It consists of a runtime component and a visual report designer, which can be used for creating reports, visual data, and charts and so on. Information gathered from this software can be used for tracking historical data and analysing it and as well as for monitoring ongoing developments in various fields. BIRT can also be used for real-time decision-making purposes.
Clear Analytics
Clear Analytics is quite easy to manage as the software is based on Excel spreadsheets. While the software allows you to continue managing data using Excel, it also adds some extra features like reports scheduling, administrative capabilities, version control, governance etc. for better decision making. In short, Clear Analytics can be your choice in case you want high-end performance in exchange of minimal effort.
Tableau
Tableau is BI software that provides insight into the data that a business organisation requires for connecting the dots, in order to make clear and effective decisions. Data visualisation in Tableau is much dynamic and elaborative as compared to the other programmes available. Besides, it also provides easier access to data given its extended mobile device support. Additionally, the costs of implementing this program as well as its upgrade are relatively low.
GoodData
GoodData is a service BI platform. It takes into account both internal and external datasets (cloud) of an organisation to analyse and provide better governance. The platform is programmed for managing data security and governance thereby, consequently providing the user with the desired results. The most important feature of this platform is that it can analyse datasets of any size, thus making it effective for its users. Recently, the company rebranded their software as an Open Analytics platform.
These are some of the major analytics tools used by organisations irrespective of their scale in order to enhance their business intelligence. Whether you are looking to enhance your career or take better business decisions, a Data analyst certification course can help you to achieve such objectives. Data Analysis helps you to track the competitive landscape and figure out the essentials that needs to be done, in order to get ahead of your competitors. If you are a manager, you can take precise decisions based on quantitative data. Since big data is potential of driving your success, it is your job to master the science and use it for your advantage.
Interested in a career in Data Analyst?
To learn more about Data Analyst with Advanced excel course – Enrol Now. To learn more about Data Analyst with R Course – Enrol Now. To learn more about Big Data Course – Enrol Now.
To learn more about Machine Learning Using Python and Spark – Enrol Now. To learn more about Data Analyst with SAS Course – Enrol Now. To learn more about Data Analyst with Apache Spark Course – Enrol Now. To learn more about Data Analyst with Market Risk Analytics and Modelling Course – Enrol Now.
Today is a time when each day is witnessing the field of analytics gets more and more pervasive. It is helping other fields and sectors to achieve more. At a time like this our nation is expected to maintain its ground over other major offshore destinations such as Philippines, China, Eastern Europe and Latin America as per a recent survey.
A host of factors will drive the demand for this service from India. They are – availability of talent pool, industry maturity and a wide spectrum of services which was reported by the survey that was conducted by Avendus Capital which is a financial services company.Continue reading “India Will Lead in Analytics Services:”
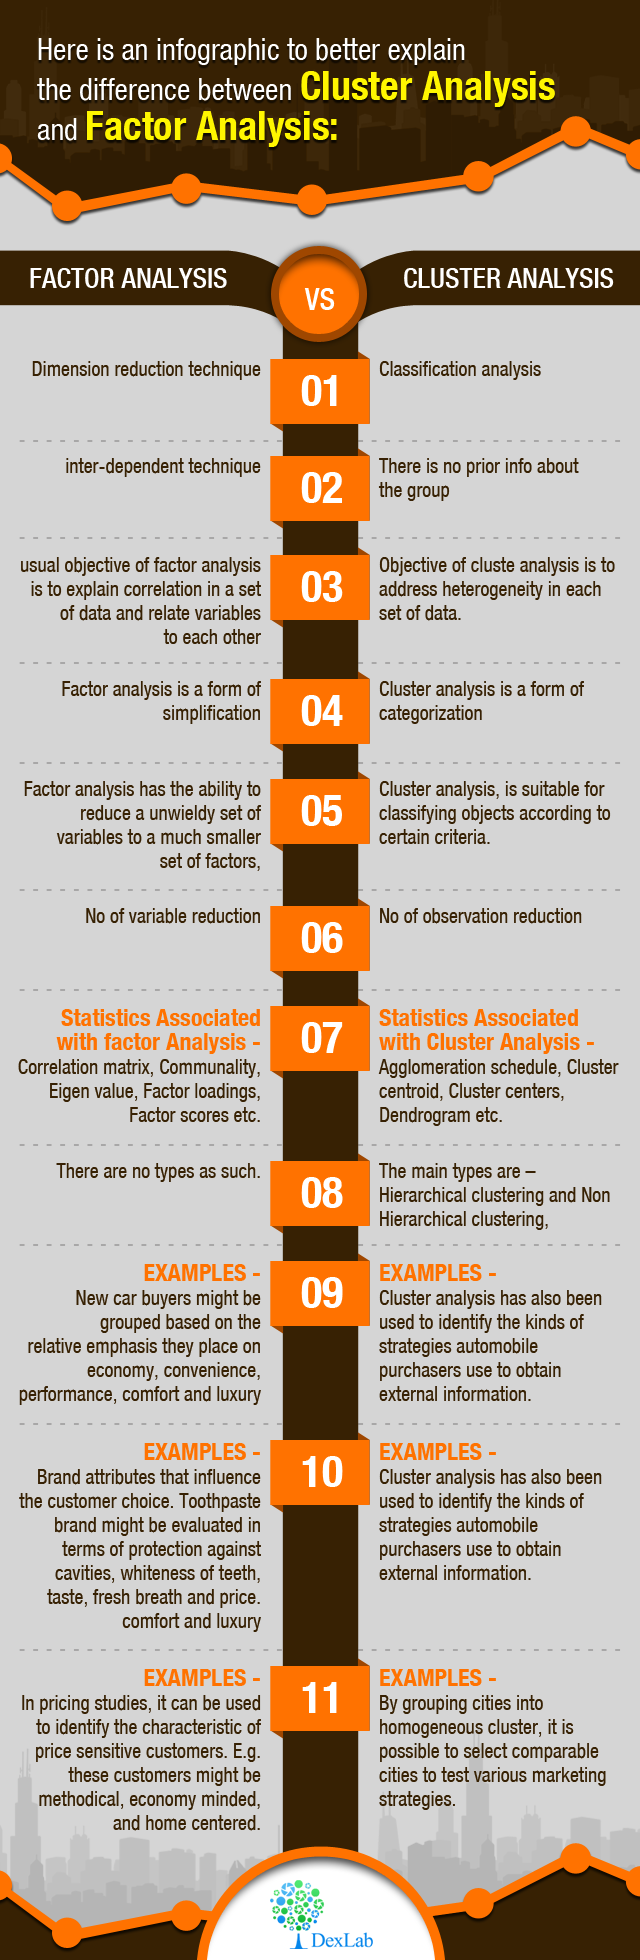
Cluster analysis and factor analysis are two different statistical methods in data analytics which are used heavily in analytical methods of subjects like natural sciences and behavioural sciences. The names of these analytical methods are so because both these methods allow the users to divide the data into either clusters or into factors.
Most newly established data analysts have this common confusion that both these methods are almost similar. But while these two methods may look similar on the surface but they differ in several ways including their applications and objectives.
Difference in objectives between cluster analysis and factor analysis:
One key difference between cluster analysis and factor analysis is the fact that they have distinguished objectives. For factor analysis the usual objective is to explain the correlation with a data set and understand how the variables relate to each other. But on the other hand the objective of cluster analysis is to address the heterogeneity in the individual data sets.
Put in simpler words the spirit of cluster analysis is to help in categorization but that of factor analysis are a form of simplification.
Difference is solutions:
This is not an easy section for drawing a line of separation in between cluster and factor analysis. That is because the results or solutions obtainable from both these analysis is subjective to their application. But still one could say that with factor analysis provides in a way the ‘best’ solutions to the researcher. This best solution is in the sense that the researcher can optimize a certain aspect of the solution this is known as orthogonality which offers ease of interpretation for the analysts.
But in case of cluster analysis this is not the case. The reasons behind that being all algorithms which can yield the best solutions for cluster analysis are usually computationally incompetent. Thus, researchers cannot trust this method of cluster analysis as it does not guarantee an optimal solution.
Difference in applications:
Cluster analysis and factor analysis differ in how they are applied to data, especially when it comes to applying them to real data. This is because factor analysis can reduce the unwieldy variables sets and boil them down to a smaller set of factors. This makes it suitable for simplifying otherwise complex models of analysis. Moreover, factor analysis also comes with a sort of confirmatory use researchers can use this method to develop a set of hypotheses based on how the variables in the data set are related. After that the researcher can run a factor analysis to further confirm these hypotheses.
But cluster analysis on the other hand is suitable only for categorizing objects as per certain predetermined criteria. In cluster analysis a researcher can measure selected aspects of say a group of newly discovered plants and then place these plants into categories of species grouped by employing cluster analysis.
Interested in a career in Data Analyst?
To learn more about Data Analyst with Advanced excel course – Enrol Now. To learn more about Data Analyst with R Course – Enrol Now. To learn more about Big Data Course – Enrol Now.
To learn more about Machine Learning Using Python and Spark – Enrol Now. To learn more about Data Analyst with SAS Course – Enrol Now. To learn more about Data Analyst with Apache Spark Course – Enrol Now. To learn more about Data Analyst with Market Risk Analytics and Modelling Course – Enrol Now.
You have recently completed Data analyst certification and are hunting vigorously for a job as a data scientist. But the prospect of sitting for such an important job role at a corporate firm in front of a room full of C-suite interviewers is an intimidating prospect. But fear not as we at DexLab Analytics have got you covered both inside the class room as well out.
This megatrend on Big Data analysts started first in 2013, when the leading universities of the world began to realize the gap in between the demand and supply of Big Data professionals. And soon several , Data analyst training institutescropped up here and there and rooms transformed into classrooms with several students being keen to learn about the steps to handle Big Data and to join the ranks of data scientists which is a highly sought after profession of these days.Continue reading “Aspiring Data Analysts Must Know the Answer to These Interview Questions”
Financial firms are going berserk in order to employ the best Chief Data Officers from around the world. This is the new hype in the C-suite world who wants to manage risks associated with data and also grasp its opportunities for conducting better business.
These days all financial firms are sincerely focused on maintaining their data and governing them to comply with the latest rules and regulations. They want to comply with customer demands to maintain their competitive edge and stay on top of the game. And in order to maintain this, the financial services teams are on a hyper drive in hiring the C-suite role of a Chief Data Officer i.e. CDO.
Recent developments in the regulatory mandates of Volcker Rule of the Dodd-Frank Act in relation to capital planning have made it difficult for financial organizations to aggregate and manage their data. In a recent stress test a large number of major US corporate banks and other financial institutions have failed as the quality of their data was not up to scratch.
But expert data analyst and scientists state that only regulatory compliance is not the main issue at hand. Effective risk management goes hand-in-hand with efficient data management. And firms are lacking that front as they do not manage their data effectively and are simply gambling with chances of a hug penalty at the risk of losing customers and acquiring a bad name in the business.
The opportunities in this position of Chief Data Officer:
While the aspects of regulatory compliance and risk management are becoming more and more complex every day, but that is not the only reason to move up information management positions and invite them into the boardroom. That is why as most financial organizations know that good governance requires strong data management skills with good understanding of architecture and analytics. Companies have come to realize that this kind of information can prove to be effective and provide them with competitive advantage in terms of reaching out to customers and protecting them with the offering of innovative products and services.
According to latest research, experts predicted that 25 percent of every financial organization will have employed a Chief Data Officer by the end of 2015. The job responsibility of this role is still clouded and most organizations are trying to refine and boil it down, but as of now three main roles have been identified – data governance, data analysis and data architecture and technology. While according to this survey 77 percent of the CDOs will remain focused in governance focused but their responsibilities are likely to grow into other areas as well. The main objective behind data architecture is to oversee how data is sourced, integrated and then consumed in the global organizations. The way to lead efficiencies in this respect is to consider this aspect in depth. Thus, it can be concluded that data analytics has the most potential.
For more details on Online Certificate in Business Analytics, visit DexLab Analytics. Their online courses in data science are up to the mark as per industry standards. Check out the course module today.
DexLab Analytics has started a new admission drive for prospective students interested in big data and data science certification. Enroll in #BigDataIngestion and enjoy 10% off on in-demand courses, including data science, machine learning, hadoop and business analytics.
Interested in a career in Data Analyst?
To learn more about Machine Learning Using Python and Spark – click here. To learn more about Data Analyst with Advanced excel course – click here. To learn more about Data Analyst with SAS Course – click here. To learn more about Data Analyst with R Course – click here. To learn more about Big Data Course – click here.