Data analyst training institute in noida Archives - Page 6 of 7 - DexLab Analytics | Big Data Hadoop SAS R Analytics Predictive Modeling & Excel VBA

Sherlock Holmes Has Always Been a Data Analyst. Here’s Why

The job of a data analyst or scientist revolves around gathering a bunch of disorganized data, and then using them to build a case through deduction and logic. Finally, following that you will reach a conclusion after analysis.

Sherlock Holmes Has Always Been a Data Analyst. Here's Why

Below quote from Sherlock Holmes is relevant –

“When you have eliminated the impossible whatever remains, no matter how Improbable it is must be the truth.”​

tumblr_mdorpe1mnr1qf5zmno1_500

He always started each case by focusing on the problem.

The problem would sometimes arrive in the form of a letter, sometimes as an item in the newspaper, but most often, it would announce itself by a knock at the door. The client would then present the mystery to Holmes and he would probe the client for salient information. Holmes never relied on guesswork or on assumptions. For Holmes, each new case was unique, and what mattered were reliable and verifiable facts about the case. These gave the investigation an initial focus and direction.

Deduction, Reasoning & Analytics

It is a capital mistake to theorize before one has data. Insensibly one begins to twist facts to suit theories, instead of theories to suit facts.”

Similarly a data analyst is expected not to assume or formulate theories, which can make the reasoning biased. In his stories, Sherlock Holmes demonstrates his keen powers of observation and deduction from data in front of him. He can decipher how the light enters in Watson’s bathroom based on how his beard is shaved; he attests one person has lived in China from one of his tattoos; he discovers previous financial situation of a man who he had never seen before just looking to the hat the man had just used.

1

A data scientist has powerful computational and statistics tools that help him finding patterns amid so much data.


In the end, a data analyst’s introduction can be similar to what Sherlock said:

My name is Sherlock Holmes. It is my business to know what other people do not

know.

Team Cosmos

You can learn more about Data analysis by taking up Data analyst certification courses. DexLab Analytics also offers Business analyst training courses.


Interested in a career in Data Analyst?

To learn more about Machine Learning Using Python and Spark – click here.
To learn more about Data Analyst with Advanced excel course – click here.
To learn more about Data Analyst with SAS Course – click here.
To learn more about Data Analyst with R Course – click here.
To learn more about Big Data Course – click here.

Shadowing a Data Architect for a Day!

Shadowing a Data Architect for a Day!

A data architect is a noteworthy role in the present analytics industry. One can naturally evolve from a data analyst or a database designer to a data architect after gathering sufficient experience in the field. The prominence of this role showcases the emergence of the online websites and other internet avenues which require the integration of data from several unrelated data sources.

These data sources can be anything from:

  • External sources, like market feeds (for e.g. Bloomberg) or other News Agencies (like, Reuters)
  • Or they could be internal sources like exiting systems that collect data, for instance HR operations that gather employee data

Here is a depiction of a day in the life of a successful data architect:

Data analyst certification from a reputable analytics-training institute can help to speed up your process of evolution from being a data analyst to becoming a successful data architect!


Shadowing a Data Architect for a Day! from Infographics


Interested in a career in Data Analyst?

To learn more about Data Analyst with Advanced excel course – Enrol Now.
To learn more about Data Analyst with R Course – Enrol Now.
To learn more about Big Data Course – Enrol Now.

To learn more about Machine Learning Using Python and Spark – Enrol Now.
To learn more about Data Analyst with SAS Course – Enrol Now.
To learn more about Data Analyst with Apache Spark Course – Enrol Now.
To learn more about Data Analyst with Market Risk Analytics and Modelling Course – Enrol Now.

Knock! Knock! It’s Time to Change Your Bad Data Habits

Knock! Knock! It’s Time to Change Your Bad Data Habits

Do you follow your instincts instead of data and insights?

Do you prefer storing data in different databases, in separate formats with varying values?

Habits are subject to change. Though it may take some time, but eventually it evolves. Good and bad habits make a person. Good habits don’t demand attention, but bad habits often need to be looked into.

If you suffer from bad data habits, then you must make sure you deal with it. It has to be a thing from your past rather than a dominating present. After all, data is incredibly important for business organizations to proliferate and generate decent revenues.


As per Experian’s Data Quality Report, 83% of companies consider their revenue suffers from inaccurate and insufficient customer data. It happens because of time and money wastage on insubstantial resources, which leads to a humungous loss of productivity and profit.

Bad Data Habits: The Ugly Truth

Data is the essence of business. From email delivery to customer feedback to profit generation, the impact of data trickles from strata to strata.

1280-blog-bad-data2

Sadly, many companies fail to fathom the significance of data and continue storing data on multiple systems, instead of a single location, in various formats without actually knowing ways to handle it. This eventually results into huge data pile-ups, where the entire data silo becomes difficult to manage.

However, if you have the right tools and a zeal to ensure data quality, you can confidently manage your data, eradicate duplications and fix errors before they inflict damage to your fundamentals. Besides, prudent strategies, time-to-time reviews and absolute determination are necessary; read this article to gain more insights about how to work on your bad data habits.

Let awareness do the work

Detailed information about customers is crucial for better assistance and quicker efficiency. So, you should always tell your customer support team to derive more information about their customers in order to serve better.

Understand your data needs

What data is important for your business? Once you know that, you will be able to apprehend your customer’s needs and expectations more effectively. Moreover, be sure that the data is accessible to all those who really needs it, otherwise it won’t be fruitful.

Introduce Standardised Data Quality Policies

images

For high quality data, make sure you introduce standard data policies and procedures. Also, ensure that the people working in your organization are acquainted with the ways of recording and storing it.

Initiate Regular Reviews

Data degradation is common. Human beings commit mistakes. Hence, it is important to regularly review and cleanse data in order to avoid future discrepancies.

Integration and Installation of the Right Tools

boxbarimage5

Integrate your network to ensure the data is stored on one server, but accessible from multiple locations. This will help you get an entire picture of your company’s business performance over varied mediums. Install any of the improved Data Cleaning Software to make sure your data is free of duplicates and perfectly formatted right from the start.


To brush up your analytics skills, get enrolled in a Data analyst course. Visit DexLab Analytics.


Interested in a career in Data Analyst?

To learn more about Machine Learning Using Python and Spark – click here.
To learn more about Data Analyst with Advanced excel course – click here.
To learn more about Data Analyst with SAS Course – click here.
To learn more about Data Analyst with R Course – click here.
To learn more about Big Data Course – click here.

Take Small Steps With Big Feet of Business Analytics

Take Small Steps With Big Feet of Business Analytics

Do these following questions clog your mind?

I aspire to become a business analytics professional, but I don’t know what skills to possess?

I am sceptical; which training should I opt for in order to establish my career in the sphere of business analytics?

I am looking forward to switch my career into data analytics, but I don’t know which skills to imbibe for better prospects?

Answer: Yes, they do.

Continue reading “Take Small Steps With Big Feet of Business Analytics”

CRACKING A WHIP ON BLACK MONEY HOARDERS WITH DATA ANAYTICS

Tax officials are tightening up their ropes with improved Big Data analytics to crack a whip on hoarders of black money.


  • Under the bill for amending Section 115BBE of the Income Tax Act, transactions with unexplained deposits in banks will be taxed.
  • As per this amendment, tax officials can now tax people on such deposits at a rate of 60 percent (cess additional) as opposed to the previously determined 30 percent.
  • This new tax law is applicable from the 1st of April, starting this year!


Cracking a Whip on Black Money Hoarders With Data Anaytics

Cracking a Whip on Black Money Hoarders With Data Anaytics

How are the Income Tax officials leveraging Big Data Analytics to curb black money?

Here are the simple signals that showcase a rise of Big data analytics use and a more planned crack down on Black Money hoarding:


  1. The IT department is now increasingly becoming tech savvy, it is now making use of analytics tools to assess the personal bank deposits for an improved black money crack down action plan.
  2. The income tax officials are making use of Big Data analytics tools for the first time ever done in the history of the Indian economy, to further maintain a hawk’s eye affixed on the target of bringing down black money.
  3. This is a new venture and earlier such advanced tools were only employed on corporate tax assessments.

Continue reading “CRACKING A WHIP ON BLACK MONEY HOARDERS WITH DATA ANAYTICS”

Data-Analytics Driven Insights Still Distrusted By Executives!

While organizations are all words about having data driven decision making to drive their businesses, but maximum of business leaders seem to lack confidence in the information generated from data analytics. But in the rest of the world, demand for analytics training institute is on the rise with every passing day…


Data-Analytics Driven Insights Still Distrusted By Executives!


Data analysis is increasingly becoming central to decision-making in companies, especially in departments where people work towards increasing customer growth, improving productivity, and risk management. But although companies push to make their decision making process more data dependent, it seems business leaders are still more accustomed to taking serious business based on gut instincts and experiences. They still seem to have trouble trusting the insights shared from meticulous data analysis processes. Continue reading “Data-Analytics Driven Insights Still Distrusted By Executives!”

You Must Know These 7 Data Analytics Job Titles

You Must Know These 7 Data Analytics Job Titles

These days leveraging data be it big or small has become a powerful tool for all enterprises. IT firms are successfully transitioning to digital businesses and opportunities within the companies themselves are increasing to fulfil the growing demands.

So, if you want to join this megatrend in the job market, read on to find out the most in-demand data analytics job titles for today’s professionals:

Data scientist:

This job title has been getting a lot of attention since the past few years now. So much so, that even Glassdoor named it as the best career choice for optimum work/life balance. Their salaries are also comparatively higher.

But the field is still cloudy in terms of the job functions. So, let us understand what it actually means to be a data scientist.

According to Burch Works data scientists are people who “apply sophisticated quantitative measures and computer skills to both structure and analyze the massive amount of unstructured data sets or stream data continuously with an intention to derive information and prescribe action.

The executive recruiting firm says that the coding skills of these professionals are the main distinguishing factor that separates them from other predictive analytics professionals and allows them to exploit data regardless of its size, source and format.

These data professionals often have a master’s degree or a PhD in quantitative disciplines, such as applied math or statistics. They have expert skills and knowledge in statistical and machine learning methods and know tools like SAS, R etc. they are also proficient in other Big Data software like Hadoop and Spark.

2

Advanced analytics professional:

The professionals with this job role perform predictive analysis, prescriptive analysis, simulations, and all other forms of advanced analytics. Their role is however, significantly different from data scientists as they do not work with very large data sets and also not with unstructured data.

Data analyst:

A gamut of responsibilities fall under the job listings of a data analyst. They include ensuring data quality and governance, building different systems that enable businesses to gain user insights, performing actual data analysis and much more. However, the skill sets are similar and typically these professionals fit into the same category as advanced analytics professionals and data scientists, because they all can analyze data. But despite such similarities data analysts may be considered as more junior-level employees who are still in a way generalists and can fit into several different job roles within the organization.

Data engineers:

These are the wizards who work behind the scenes to make the jobs of data analysts and data scientists easier. They are technical professionals who have a deep understanding of Hadoop and other Big Data technologies like MapReduce, Hive, SQL and Pig, NoSQL technologies and other data warehousing systems.

Their primary job role is to construct the plumbing, build the data pipelines that clean, collect and aggregate data, organize it from different sources and then load them in data warehouses and databases.

Note that data engineers do not analyze data, but in other words keep the data flowing for processing so that other professionals can analyze them.

Business Analyst:

Business analysts can perform all the tasks that are almost the same for those who perform data analysis. However, business analysts generally have specialized knowledge of their specific business domain and then they apply that knowledge and analysis specifically for the business operations. For example, they may use their analytical skills to recommend improvement suggestions for the business.

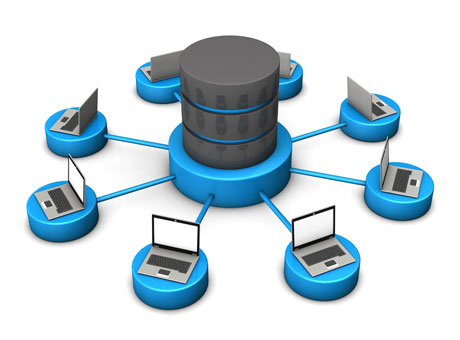
Database Administrator:

These professionals are responsible for all things relevant to the operations, monitoring, and maintenance of the databases, often SQL or other relational database management systems also form their jurisdiction. Their tasks include installation, configuration, schemas definition, user training, and maintaining documents.

The database vendors like IBM, Oracle, Microsoft and others often offer certifications specific to their own proprietary technologies for such pros.

Business Intelligence professional:

BI professionals are responsible for adapting themselves with OLAP tools, reports and other data dashboards for looking at historical trends within data sets. Business Intelligence can have data visualization, and also include popular business intelligence platforms like Qlik, Tableau and Microsoft Power BI.

These were the most in-demand job titles in the data analysis industry, to help turn your career into the right direction take a look at our Big Data courses and have a job that you would thoroughly enjoy.


Interested in a career in Data Analyst?

To learn more about Data Analyst with Advanced excel course – Enrol Now.
To learn more about Data Analyst with R Course – Enrol Now.
To learn more about Big Data Course – Enrol Now.

To learn more about Machine Learning Using Python and Spark – Enrol Now.
To learn more about Data Analyst with SAS Course – Enrol Now.
To learn more about Data Analyst with Apache Spark Course – Enrol Now.
To learn more about Data Analyst with Market Risk Analytics and Modelling Course – Enrol Now.

5 Analytics Tools To Improve Your Business Decisions

5 Analytics Tools To Improve Your Business Decisions

Big Data has proved to be inevitable for business organisations in the quest for stepping ahead of their competitors. Nevertheless, only having Big Data at hand does not solve problems. You also need the availability of efficient analytics software that can put your data to the best use.

A business analytics tool is responsible for analysing massive amounts of data in order to extract valuable information. Such information in turn, can be used for improving operational efficiency and for taking better decisions.

2

So, let us here go through the top 10 data analytics tools available in the market.

  • Yellowfin BI

Yellowfin Business Intelligence (BI) is a reporting, dashboard and data analysis software. The software is able to conduct analysis of huge amounts of database, in order to figure out appropriate information. With Yellowfin, your dashboard can be easily accessible from everywhere including company intranet, mobile device or web page.

  • Business Intelligence & Reporting Tools (BIRT)

BIRT is open source software programmed for JAVA and JAVA EE platforms. It consists of a runtime component and a visual report designer, which can be used for creating reports, visual data, and charts and so on. Information gathered from this software can be used for tracking historical data and analysing it and as well as for monitoring ongoing developments in various fields. BIRT can also be used for real-time decision-making purposes.

  • Clear Analytics

Clear Analytics is quite easy to manage as the software is based on Excel spreadsheets. While the software allows you to continue managing data using Excel, it also adds some extra features like reports scheduling, administrative capabilities, version control, governance etc. for better decision making. In short, Clear Analytics can be your choice in case you want high-end performance in exchange of minimal effort.

  • Tableau

Tableau is BI software that provides insight into the data that a business organisation requires for connecting the dots, in order to make clear and effective decisions. Data visualisation in Tableau is much dynamic and elaborative as compared to the other programmes available. Besides, it also provides easier access to data given its extended mobile device support. Additionally, the costs of implementing this program as well as its upgrade are relatively low.

  • GoodData

GoodData is a service BI platform. It takes into account both internal and external datasets (cloud) of an organisation to analyse and provide better governance. The platform is programmed for managing data security and governance thereby, consequently providing the user with the desired results. The most important feature of this platform is that it can analyse datasets of any size, thus making it effective for its users. Recently, the company rebranded their software as an Open Analytics platform.

These are some of the major analytics tools used by organisations irrespective of their scale in order to enhance their business intelligence. Whether you are looking to enhance your career or take better business decisions, a Data analyst certification course can help you to achieve such objectives. Data Analysis helps you to track the competitive landscape and figure out the essentials that needs to be done, in order to get ahead of your competitors. If you are a manager, you can take precise decisions based on quantitative data. Since big data is potential of driving your success, it is your job to master the science and use it for your advantage.


Interested in a career in Data Analyst?

To learn more about Data Analyst with Advanced excel course – Enrol Now.
To learn more about Data Analyst with R Course – Enrol Now.
To learn more about Big Data Course – Enrol Now.

To learn more about Machine Learning Using Python and Spark – Enrol Now.
To learn more about Data Analyst with SAS Course – Enrol Now.
To learn more about Data Analyst with Apache Spark Course – Enrol Now.
To learn more about Data Analyst with Market Risk Analytics and Modelling Course – Enrol Now.

Understanding the Difference Between Factor and Cluster Analysis

Understanding the Difference Between Factor and Cluster Analysis

Cluster analysis and factor analysis are two different statistical methods in data analytics which are used heavily in analytical methods of subjects like natural sciences and behavioural sciences. The names of these analytical methods are so because both these methods allow the users to divide the data into either clusters or into factors.

Most newly established data analysts have this common confusion that both these methods are almost similar. But while these two methods may look similar on the surface but they differ in several ways including their applications and objectives.

Difference in objectives between cluster analysis and factor analysis:

One key difference between cluster analysis and factor analysis is the fact that they have distinguished objectives. For factor analysis the usual objective is to explain the correlation with a data set and understand how the variables relate to each other. But on the other hand the objective of cluster analysis is to address the heterogeneity in the individual data sets.

Put in simpler words the spirit of cluster analysis is to help in categorization but that of factor analysis are a form of simplification.

Data Science Machine Learning Certification

Difference is solutions:

This is not an easy section for drawing a line of separation in between cluster and factor analysis. That is because the results or solutions obtainable from both these analysis is subjective to their application. But still one could say that with factor analysis provides in a way the ‘best’ solutions to the researcher. This best solution is in the sense that the researcher can optimize a certain aspect of the solution this is known as orthogonality which offers ease of interpretation for the analysts.

But in case of cluster analysis this is not the case. The reasons behind that being all algorithms which can yield the best solutions for cluster analysis are usually computationally incompetent. Thus, researchers cannot trust this method of cluster analysis as it does not guarantee an optimal solution.

Difference in applications:

Cluster analysis and factor analysis differ in how they are applied to data, especially when it comes to applying them to real data. This is because factor analysis can reduce the unwieldy variables sets and boil them down to a smaller set of factors. This makes it suitable for simplifying otherwise complex models of analysis. Moreover, factor analysis also comes with a sort of confirmatory use researchers can use this method to develop a set of hypotheses based on how the variables in the data set are related.  After that the researcher can run a factor analysis to further confirm these hypotheses.

But cluster analysis on the other hand is suitable only for categorizing objects as per certain predetermined criteria. In cluster analysis a researcher can measure selected aspects of say a group of newly discovered plants and then place these plants into categories of species grouped by employing cluster analysis.

Here is an infographic to better explain the difference between cluster analysis and factor analysis: 


Interested in a career in Data Analyst?

To learn more about Data Analyst with Advanced excel course – Enrol Now.
To learn more about Data Analyst with R Course – Enrol Now.
To learn more about Big Data Course – Enrol Now.

To learn more about Machine Learning Using Python and Spark – Enrol Now.
To learn more about Data Analyst with SAS Course – Enrol Now.
To learn more about Data Analyst with Apache Spark Course – Enrol Now.
To learn more about Data Analyst with Market Risk Analytics and Modelling Course – Enrol Now.

Call us to know more