Data analyst training institute in gurgaon Archives - Page 7 of 9 - DexLab Analytics | Big Data Hadoop SAS R Analytics Predictive Modeling & Excel VBA

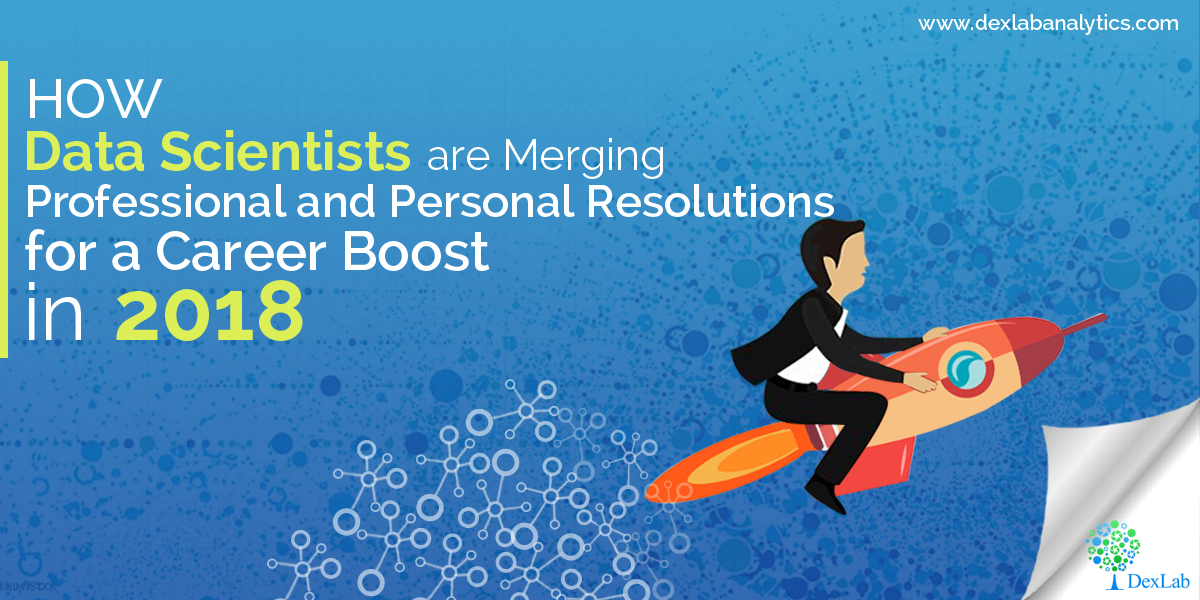
How Data Scientists are Merging Professional and Personal Resolutions for a Career Boost in 2018

The beginning of a year comes with a wide stream of promises! Some decide to work on their physique, while others look forward to visit a new country, but budding data scientists are found thinking of something else.

How Data Scientists are Merging Professional and Personal Resolutions for a Career Boost in 2018

Here goes a chart down of what goes on in a mind of a data scientist, who could stare for hours at the computer screen pondering which code or query to run…

Continue reading “How Data Scientists are Merging Professional and Personal Resolutions for a Career Boost in 2018”

Architecture Trade-offs Pays Well for Enterprise Analytics

Today, owing to an explosion of technology options, determining which analytics stack to adopt takes into account a streak of architectural trade-offs. Over the years, with our experience and expertise we have learnt the most crucial aspect of creating sound analytics systems and pleasing customers with improved digital solutions – is the location where data is to be stored and processed, and the different types of databases to use so that only the right people gain access to it.

Architecture Trade-offs Pays Well for Enterprise Analytics

Opt for a comprehensive data analyst course Delhi NCR from DexLab Analytics.

Continue reading “Architecture Trade-offs Pays Well for Enterprise Analytics”

How Careers in Tech is Getting Influenced Due to CryptoCurrency Revolution

Cryptocurrency is the new in-thing that is creating a lot of buzz in the tech world. And though your friends and family might be hearing all good things about Bitcoin, you will be surprised to know – it’s creating job. Yes, you heard it right – cryptocurrency is exploding the job market. From startups to blue chip companies, everyone is talking about the perks of blockchain and what it potentials it holds for future.

 
How Careers in Tech is Getting Influenced Due to CryptoCurrency Revolution

Job trends to follow

Going by the reports uploaded by job search site Indeed, job postings for bitcoin, blockchain and cryptocurrency have increased by more than 620% since November 2015. In fact, the search ratios for such jobs have also increased by 1065%, suggesting supply is expanding along with demand.

Continue reading “How Careers in Tech is Getting Influenced Due to CryptoCurrency Revolution”

Discover the Best Industries to Have a Career in Data Science

Discover-the-Best-Industries-to-Have-a-Career-in-Data-Science

Data fires up everything, nowadays. And data science is gaining exceptional traction in the job world, as data analytics, machine learning, big data, and data mining are fetching relevance in the mainstream tech world. By 2025, it is being expected that data science industry will reach $16 billion in value – this is why landing a job in data science domain is the next big thing!

The skills you will imbibe as a data scientist would be incredible, powerful and extremely valuable. You can easily a bag a dream job in corporate moguls, like Coca-Cola, Uber, Ford Motors and IBM, as well as play a significant role in any pro-social or philanthropic endeavors to make this world a better place to live in.

Check out these extremely interesting fields you could start your career in data science:

Biotechnology

No wonder, science and medicine are intricately related to each other. As the technology pushes boundaries, more and more companies are recommitting themselves towards a better public health by nabbing biotechnology. Being a data scientist, you would help in unraveling newer ways of studying large amounts of data – including machine learning, semantic and interactive technologies. Eventually, they would influence treatments, drugs-usage, testing procedures and much more.

Untitled

Energy

Power industry functions on data – and tons of it. Whether it’s about extracting mineral wealth from the earth’s crust or transporting crude oil or planning better storage facilities, the demand for data scientists is on the rise. Just as expanding oil fields ask for humongous amounts of data study, installing and refining cleaner energy production facilities relies on data about the natural environment and ways of modern construction. Data scientists are often given a ring to enhance safety standards and help companies recommit themselves towards better safety and environmental regulations.

Transportation

Recently, transportation is undergoing a robust change. For example, Tesla paved a new road of development and turned countless heads by unveiling a long-haul truck that could drive on its own. Though it’s not the first time, they are prone to lead the change.

Beyond self-driving vehicle technology, the transportation industry is looking for more efficient ways to preserve and transport energy. These advancements in technology works wonders when combined with better battery technology development – in simple terms, every individual field in transportation industry is believed to benefit from a motley team of data scientists.

jpg

Telecommunications

The internet is not only about tubes, but all about data. The future of the internet is here, with ever-increasing networks of satellites and user devices establishing communication through blockchain. Though they are yet to be used on large-scale, they have started making news. In situations like this, it would be difficult not to highlight the importance of data science and data architecture as they are becoming major influencers in the internet world. Whenever there is a dire need to make the public aware of a new product, we rely on user data – hence the role of data scientists is the key to a better future.

Today, data science is an interesting field to explore, and it is going to play an integral role as the stride in technology and globalization keeps expanding its base. If you have a keen eye for numbers, charts, patterns and analytics, this niche is perfectly suitable for you.

DexLab Analytics is a prime Data Science training institute Delhi that excels in offering advanced business analyst training courses in Gurgaon. Visit our official site for more information and make a mark in data analytics!


Interested in a career in Data Analyst?

To learn more about Data Analyst with Advanced excel course – Enrol Now.
To learn more about Data Analyst with R Course – Enrol Now.
To learn more about Big Data Course – Enrol Now.

To learn more about Machine Learning Using Python and Spark – Enrol Now.
To learn more about Data Analyst with SAS Course – Enrol Now.
To learn more about Data Analyst with Apache Spark Course – Enrol Now.
To learn more about Data Analyst with Market Risk Analytics and Modelling Course – Enrol Now.

Write ETL Jobs to Offload the Data Warehouse Using Apache Spark

Write ETL Jobs to Offload the Data Warehouse Using Apache Spark

The surge of Big Data is everywhere. The evolving trends in BI have taken the world in its stride and a lot of organizations are now taking the initiative of exploring how all this fits in.

Leverage data ecosystem to its full potential and invest in the right technology pieces – it’s important to think ahead so as to reap maximum benefits in IT in the long-run.

“By 2020, information will be used to reinvent, digitalize or eliminate 80% of business processes and products from a decade earlier.” – Gartner’s prediction put it so right!

The following architecture diagram entails a conceptual design – it helps you leverage the computing power of Hadoop ecosystem from your conventional BI/ Data warehousing handles coupled with real time analytics and data science (data warehouses are now called data lakes).
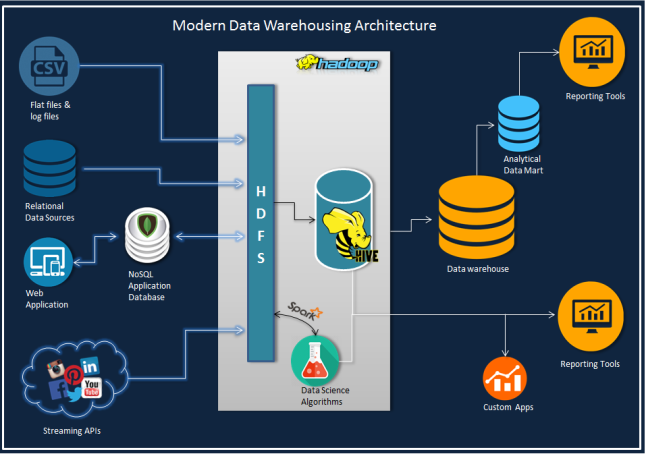
moderndwarchitecture

In this post, we will discuss how to write ETL jobs to offload data warehouse using PySpark API from the genre of Apache Spark. Spark with its lightning-fast speed in data processing complements Hadoop.

Now, as we are focusing on ETL job in this blog, let’s introduce you to a parent and a sub-dimension (type 2) table from MySQL database, which we will merge now to impose them on a single dimension table in Hive with progressive partitions.

Stay away from snow-flaking, while constructing a warehouse on hive. It will reduce useless joins as each join task generates a map task.

Just to raise your level of curiosity, the output on Spark deployment alone in this example job is 1M+rows/min.

The Employee table (300,024 rows) and a Salaries table (2,844,047 rows) are two sources – here employee’s salary records are kept in a type 2 fashion on ‘from_date’ and ‘to_date’ columns. The main target table is a functional Hive table with partitions, developed on year (‘to_date’) from Salaries table and Load date as current date. Constructing the table with such potent partition entails better organization of data and improves the queries from current employees, provided the to_date’ column has end date as ‘9999-01-01’ for all current records.

The rationale is simple: Join the two tables and add load_date and year columns, followed by potent partition insert into a hive table.

Check out how the DAG will look:
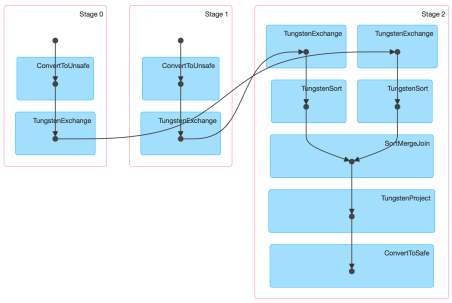
screen-shot-2015-09-28-at-1-44-32-pm

Next to version 1.4 Spark UI conjures up the physical execution of a job as Direct Acyclic Graph (the diagram above), similar to an ETL workflow. So, for this blog, we have constructed Spark 1.5 with Hive and Hadoop 2.6.0

Go through this code to complete your job easily: it is easily explained as well as we have provided the runtime parameters within the job, preferably they are parameterized.

Code: MySQL to Hive ETL Job

__author__ = 'udaysharma'
# File Name: mysql_to_hive_etl.py
from pyspark import SparkContext, SparkConf
from pyspark.sql import SQLContext, HiveContext
from pyspark.sql import functions as sqlfunc

# Define database connection parameters
MYSQL_DRIVER_PATH = "/usr/local/spark/python/lib/mysql-connector-java-5.1.36-bin.jar"
MYSQL_USERNAME = '<USER_NAME >'
MYSQL_PASSWORD = '********'
MYSQL_CONNECTION_URL = "jdbc:mysql://localhost:3306/employees?user=" + MYSQL_USERNAME+"&password="+MYSQL_PASSWORD 

# Define Spark configuration
conf = SparkConf()
conf.setMaster("spark://Box.local:7077")
conf.setAppName("MySQL_import")
conf.set("spark.executor.memory", "1g")

# Initialize a SparkContext and SQLContext
sc = SparkContext(conf=conf)
sql_ctx = SQLContext(sc)

# Initialize hive context
hive_ctx = HiveContext(sc)

# Source 1 Type: MYSQL
# Schema Name  : EMPLOYEE
# Table Name   : EMPLOYEES
# + --------------------------------------- +
# | COLUMN NAME| DATA TYPE    | CONSTRAINTS |
# + --------------------------------------- +
# | EMP_NO     | INT          | PRIMARY KEY |
# | BIRTH_DATE | DATE         |             |
# | FIRST_NAME | VARCHAR(14)  |             |
# | LAST_NAME  | VARCHAR(16)  |             |
# | GENDER     | ENUM('M'/'F')|             |
# | HIRE_DATE  | DATE         |             |
# + --------------------------------------- +
df_employees = sql_ctx.load(
    source="jdbc",
    path=MYSQL_DRIVER_PATH,
    driver='com.mysql.jdbc.Driver',
    url=MYSQL_CONNECTION_URL,
    dbtable="employees")

# Source 2 Type : MYSQL
# Schema Name   : EMPLOYEE
# Table Name    : SALARIES
# + -------------------------------- +
# | COLUMN NAME | TYPE | CONSTRAINTS |
# + -------------------------------- +
# | EMP_NO      | INT  | PRIMARY KEY |
# | SALARY      | INT  |             |
# | FROM_DATE   | DATE | PRIMARY KEY |
# | TO_DATE     | DATE |             |
# + -------------------------------- +
df_salaries = sql_ctx.load(
    source="jdbc",
    path=MYSQL_DRIVER_PATH,
    driver='com.mysql.jdbc.Driver',
    url=MYSQL_CONNECTION_URL,
    dbtable="salaries")

# Perform INNER JOIN on  the two data frames on EMP_NO column
# As of Spark 1.4 you don't have to worry about duplicate column on join result
df_emp_sal_join = df_employees.join(df_salaries, "emp_no").select("emp_no", "birth_date", "first_name",
                                                             "last_name", "gender", "hire_date",
                                                             "salary", "from_date", "to_date")

# Adding a column 'year' to the data frame for partitioning the hive table
df_add_year = df_emp_sal_join.withColumn('year', F.year(df_emp_sal_join.to_date))

# Adding a load date column to the data frame
df_final = df_add_year.withColumn('Load_date', F.current_date())

df_final.repartition(10)

# Registering data frame as a temp table for SparkSQL
hive_ctx.registerDataFrameAsTable(df_final, "EMP_TEMP")

# Target Type: APACHE HIVE
# Database   : EMPLOYEES
# Table Name : EMPLOYEE_DIM
# + ------------------------------- +
# | COlUMN NAME| TYPE   | PARTITION |
# + ------------------------------- +
# | EMP_NO     | INT    |           |
# | BIRTH_DATE | DATE   |           |
# | FIRST_NAME | STRING |           |
# | LAST_NAME  | STRING |           |
# | GENDER     | STRING |           |
# | HIRE_DATE  | DATE   |           |
# | SALARY     | INT    |           |
# | FROM_DATE  | DATE   |           |
# | TO_DATE    | DATE   |           |
# | YEAR       | INT    | PRIMARY   |
# | LOAD_DATE  | DATE   | SUB       |
# + ------------------------------- +
# Storage Format: ORC


# Inserting data into the Target table
hive_ctx.sql("INSERT OVERWRITE TABLE EMPLOYEES.EMPLOYEE_DIM PARTITION (year, Load_date) \
            SELECT EMP_NO, BIRTH_DATE, FIRST_NAME, LAST_NAME, GENDER, HIRE_DATE, \
            SALARY, FROM_DATE, TO_DATE, year, Load_date FROM EMP_TEMP")

As we have the necessary configuration mentioned in our code, we will simply call to run this job

spark-submit mysql_to_hive_etl.py

As soon as the job is run, our targeted table will consist 2844047 rows just as expected and this is how the partitions will appear:
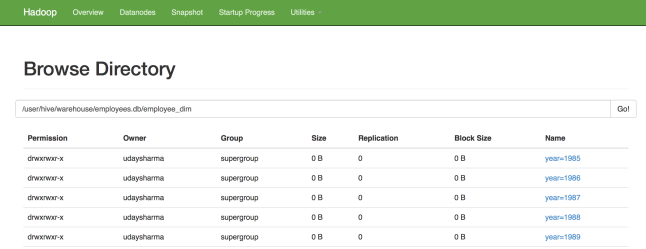
screen-shot-2015-09-29-at-12-42-37-am

2

3

screen-shot-2015-09-29-at-12-46-55-am

The best part is that – the entire process gets over within 2-3 mins..

For more such interesting blogs and updates, follow us at DexLab Analytics. We are a premium Big Data Hadoop institute in Gurgaon catering to the needs of aspiring candidates. Opt for our comprehensive Hadoop certification in Delhi and crack such codes in a jiffy!


Interested in a career in Data Analyst?

To learn more about Data Analyst with Advanced excel course – Enrol Now.
To learn more about Data Analyst with R Course – Enrol Now.
To learn more about Big Data Course – Enrol Now.

To learn more about Machine Learning Using Python and Spark – Enrol Now.
To learn more about Data Analyst with SAS Course – Enrol Now.
To learn more about Data Analyst with Apache Spark Course – Enrol Now.
To learn more about Data Analyst with Market Risk Analytics and Modelling Course – Enrol Now.
Automation Doesn’t Necessarily Make Humans Obsolete, Here’s Why

Machines are going to eat our jobs.


AI is handling insurance claims and basic bookkeeping, maintaining investment portfolios, doing preliminary HR tasks, and performing extensive legal research and lot more. So, do humans stand a chance against the automation apocalypse, where everything, almost everything will be controlled by robots?

 
Automation Doesn’t Necessarily Make Humans Obsolete, Here’s Why
 

What do you think? You might be worried about your future job opportunities and universal basic income, but I would ask you to draw a clearer picture about this competing theory – because, in the end, this question might not even be a plausible and completely valid question. Why, I will tell you now.

Continue reading “Automation Doesn’t Necessarily Make Humans Obsolete, Here’s Why”

Skills required during Interviews for a Data Scientist @ Facebook, Intel, Ebay. Square etc.

Skills required during Interviews for a Data Scientist @ Facebook, Intel, Ebay. Square etc.

Basic Programming Languages: You should know a statistical programming language, like R or Python (along with Numpy and Pandas Libraries), and a database querying language like SQL

Statistics: You should be able to explain phrases like null hypothesis, P-value, maximum likelihood estimators and confidence intervals. Statistics is important to crunch data and to pick out the most important figures out of a huge dataset. This is critical in the decision-making process and to design experiments.

Machine Learning: You should be able to explain K-nearest neighbors, random forests, and ensemble methods. These techniques typically are implemented in R or Python.  These algorithms show to employers that you have exposure to how data science can be used in more practical manners.

Data Wrangling: You should be able to clean up data. This basically means understanding that “California” and “CA” are the same thing – a negative number cannot exist in a dataset that describes population. It is all about identifying corrupt (or impure) data and and correcting/deleting them.

Data Visualization: Data scientist is useless on his or her own. They need to communicate their findings to Product Managers in order to make sure those data are manifesting into real applications. Thus, familiarity with data visualization tools like ggplot is very important (so you can SHOW data, not just talk about them)

Software Engineering: You should know algorithms and data structures, as they are often necessary in creating efficient algorithms for machine learning. Know the use cases and run time of these data structures: Queues, Arrays, Lists, Stacks, Trees, etc.

2

What they look for? @ Mu-Sigma, Fractal Analytics

    • Most of the analytics and data science companies, including third party analytics companies such as Mu-sigma and Fractal hire fresher’s in big numbers (some time in hundreds every year).
    • You see one of the main reasons why they are able to survive in this industry is the “Cost Arbitrage” benefit between the US and other developed countries vs India.
    • Generally speaking, they normally pay significantly lower for India talent in India compared to the same talent in the USA. Furthermore, hiring fresh talent from the campuses is one of the key strategies for them to maintain the low cost structure.
    • If they are visiting your campuses for interview process, you should apply. In case if they are not visiting your campus, drop your resume to them using their corporate email id that you can find on their websites.
    • Better will be to find someone in your network (such as seniors) who are working for these companies and ask them to refer you. This is normally the most effective approach after the campus placements.

Key Skills that look for are-

  • Love for numbers and quantitative stuff
  • Grit to keep on learning
  • Some programming experience (preferred)
  • Structured thinking approach
  • Passion for solving problems
  • Willingness to learn statistical concepts

Technical Skills

  • Math (e.g. linear algebra, calculus and probability)
  • Statistics (e.g. hypothesis testing and summary statistics)
  • Machine learning tools and techniques (e.g. k-nearest neighbors, random forests, ensemble methods, etc.)
  • Software engineering skills (e.g. distributed computing, algorithms and data structures)
  • Data mining
  • Data cleaning and munging
  • Data visualization (e.g. ggplot and d3.js) and reporting techniques
  • Unstructured data techniques
  • Python / R and/or SAS languages
  • SQL databases and database querying languages
  • Python (most common), C/C++ Java, Perl
  • Big data platforms like Hadoop, Hive & Pig

Business Skills

  • Analytic Problem-Solving: Approaching high-level challenges with a clear eye on what is important; employing the right approach/methods to make the maximum use of time and human resources.
  • Effective Communication: Detailing your techniques and discoveries to technical and non-technical audiences in a language they can understand.
  • Intellectual Curiosity: Exploring new territories and finding creative and unusual ways to solve problems.
  • Industry Knowledge: Understanding the way your chosen industryfunctions and how data are collected, analyzed and utilized.


Interested in a career in Data Analyst?

To learn more about Data Analyst with Advanced excel course – Enrol Now.
To learn more about Data Analyst with R Course – Enrol Now.
To learn more about Big Data Course – Enrol Now.

To learn more about Machine Learning Using Python and Spark – Enrol Now.
To learn more about Data Analyst with SAS Course – Enrol Now.
To learn more about Data Analyst with Apache Spark Course – Enrol Now.
To learn more about Data Analyst with Market Risk Analytics and Modelling Course – Enrol Now.

Curiosity is Vital: How Machine Inquisitiveness Improves the Ability to Perform Smartly

Online Data Science Certification

What happens when a computer algorithm merges with a form of artificial curiosity – to solve precarious problems?

Meticulous researchers at the University of California, Berkeley framed an “intrinsic curiosity model” to make their learning algorithm function even when there is a lack of strong feedback signal. The pioneering model developed by this team visions the AI software controlling a virtual agent in video games in pursuit of maximising its understanding of its environment and related aspects affecting that environment. Previously, there have been numerous attempts to render AI agents’ curiosity, but this time the trick is simpler and rewarding.

The shortcomings of robust machine learning techniques can be solved with this mighty trick, and it could help us in making machines better at solving obscure real world problems.

Pulkit Agrawal, a PhD student at UC Berkeley, who pulled off the research with colleagues said, “Rewards in the real world are very sparse. Babies do all these random experiments, and you can think of that as a kind of curiosity. They are learning some sort of skills.”

Also read: Data Science – then and now!

Like several potent machine learning techniques rolled out in the past decade, Reinforcement Learning has brought in a phenomenal change in the way machine accomplish their things. It has been an intrinsic part of AlphaGo, a poster child of DeepMind; it helped playing and winning the complex board game GO with incredible skill and wit. As a result, the technique is now implemented to imbue machines with striking skills that might be impossible to code manually.

However, Reinforcement Learning comes with its own limitations. Agrawal pointed that sometimes it demands a huge amount of training in order to grasp a task, and the procedure can become troublesome, especially when the feedback is not immediately available. To simplify, the process doesn’t work for computer games where the advantages of specified behaviours is not just obvious. Hence, we call for curiosity!

Also read: After Chess, Draughts and Backgammon, How Google’s AlphaGo Win at Go

For quite some time now, a lot of research activity is going around on artificial curiosity. Pierre-Yves Oudeyer, a research director at the French Institute for Research in Computer Science and Automation, said, “What is very exciting right now is that these ideas, which were very much viewed as ‘exotic’ by both mainstream AI and neuroscience researchers, are now becoming a major topic in both AI and neuroscience,”. The best thing to watch now is how the UC Berkeley team is going to run it on robots that implement Reinforcement Learning to learn abstract stuffs. In context to above, Agrawal noted robots waste a nifty amount of time in fulfilling erratic gestures, but when properly equipped with innate curiosity, the same robot would quickly explore its environment and establish relationships with nearby objects.

Also read: CRACKING A WHIP ON BLACK MONEY HOARDERS WITH DATA ANALYTICS

In support of the UC Berkeley team, Brenden Lake, a research scientist at New York University who lives by framing computational models of human cognitive capabilities said the work seemed promising. Developing machines to think like humans is an impressive and important step in the machine-building world. He added, “It’s very impressive that by using only curiosity-driven learning, the agents in a game can now learn to navigate through levels.”

To learn more about the boons of artificial intelligence, and what new realms, it’s traversing across, follow us on DexLab Analytics. We are a leading Online Data Science Certification provider, excelling on online certificate course in credit analysis. Visit our site to enroll for high-end data analytics courses!


Interested in a career in Data Analyst?

To learn more about Data Analyst with Advanced excel course – Enrol Now.
To learn more about Data Analyst with R Course – Enrol Now.
To learn more about Big Data Course – Enrol Now.

To learn more about Machine Learning Using Python and Spark – Enrol Now.
To learn more about Data Analyst with SAS Course – Enrol Now.
To learn more about Data Analyst with Apache Spark Course – Enrol Now.
To learn more about Data Analyst with Market Risk Analytics and Modelling Course – Enrol Now.

Drawing a Bigger Picture: FAQs about Data Analytics

Drawing a Bigger Picture: FAQs about Data Analytics

When the whole world is going crazy about business analytics, you might be sitting in a corner and wondering what does it all mean? With so many explanations, notions run a gamut of options.

It’s TIME to be acquainted with all the imperceptible jargons of data science; let’s get things moving with these elementary FAQs.

What is data analytics?

Data analytics is all about understanding the data and implementing the derived knowledge to direct actions. It is a technical way to transform raw data into meaningful information, which makes integral decision-making easier and effective. To perform data analytics, a handful number of statistical tools and software is used and et voila, you are right on your way to success!

How will analytics help businesses grow?

The rippling effects of data analytics are evident, from the moment you introduce it in your business network. And stop rattling! The effects are largely on the positive side, letting your business unravel opportunities, which it ignored before owing to lack of accurate analytical lens. By parsing latest trends, conventions and relationships within data, analytics help predict the future tendencies of the market.

Moreover, it throws light on these following questions:

  • What is going on and what will happen next?
  • Why is it happening?
  • What strategy would be the best to implement?

Also read: Tigers will be safe in the hands of Big Data Analytics

How do analytics projects look like?

A conventional analytics strategy is segregated into the following 4 steps:

Research – Analysts need to identify and get through the heart of the matter to help business address issues that it is facing now or will encounter in the future.

Plan – What type of data is used? What are the sources from where the data is to be secured? How the data is prepared for implementation? What are the methods used to analyse data? Professional analysts will assess the above-mentioned questions and find relevant solutions.

Execute – This is an important step, where analysts explores and analyses data from different perspectives.

Evaluate – In this stage, analysts evaluate the strategies and execute them.

How predictive modelling is implemented through business domains?

In business analytics, there are chiefly two models, descriptive and predictive. Descriptive models explain what has already happened and what is happening now, while Predictive models decipher what would happen along with stating the underlying reason.

Also read: Data Analytics for the Big Screen

One can now solve issues related to marketing, finance, human resource, operations and any other business operations without a hitch with predictive analytics modelling. By integrating past with present data, this strategy aims to anticipate the future before it arrives.

When should I deploy analytics in business?

An Intrinsic Revelation – Analytics is not a one-time event; it is a continuous process once undertaken. No one can say when will be the right time to introduce data analytics in your business. However, most of the businesses resort to analytics in their not-up-par days, when they face problems and lags behind in devising any possible solution.

5

So, now that you understand the data analytics sphere and the significance attached, take up business analytics training in Delhi. From a career perspective, the field of data science is burgeoning. DexLab Analytics is a premier data science training institute, headquartered in Gurgaon. Check out our services and get one for yourself!


Interested in a career in Data Analyst?

To learn more about Data Analyst with Advanced excel course – Enrol Now.
To learn more about Data Analyst with R Course – Enrol Now.
To learn more about Big Data Course – Enrol Now.

To learn more about Machine Learning Using Python and Spark – Enrol Now.
To learn more about Data Analyst with SAS Course – Enrol Now.
To learn more about Data Analyst with Apache Spark Course – Enrol Now.
To learn more about Data Analyst with Market Risk Analytics and Modelling Course – Enrol Now.
Call us to know more