Data analyst training institute in Delhi Archives - Page 3 of 9 - DexLab Analytics | Big Data Hadoop SAS R Analytics Predictive Modeling & Excel VBA

Study: The Demand for Data Scientists is Likely to Rise Sharply

Study: The Demand for Data Scientists is Likely to Rise Sharply

Data is like the new oil. A large number of companies are leveraging artificial intelligence and big data to mine these vast volumes of data in today’s time. Data science is a promising landmine of job opportunities – and it’s high time to consider it as a successful career avenue.

The prospect of data science is skyrocketing. Today, it is estimated that more than 50000 data science and machine learning jobs are lying vacant. Plus, nearly 40000 new jobs are to be generated in India alone by 2020. If you follow the global trends, the role of data scientist has expanded over 650% since 2012 yet only 35000 people in the US are skilled enough.

Data scientists are like the platform that connects the dots between programming and implementation of data to solve challenging business intricacies – says Pankaj Muthe, Academic Program Manager (APAC), Company Spokesperson, QlikTech. The company delivers intuitive platform solutions for embedded analytics, self-service data visualizations and guided analytics and reporting across the globe.

According to a pool of experts, data science is the hottest job trend of this century and is the second most popular degree to have at the master level next to MBA. No wonder, this new breed of science and technology is believed to be driving a new wave of innovation! Data scientists and front-end developers attracted the highest remuneration across Indian startups throughout 2017.

2

Eligibility Criteria

To become a professional data scientist, a degree in computer science/engineering or mathematics is a must. Most of the data scientists have a knack for intricate tasks and aptitude to learn challenging programming languages. Any good organization seeks interested and intelligent candidates with the zeal to learn more. The subjects in which they need to be proficient are mathematics, statistics and programming. Moreover, data science jobs need a very sound base in machine learning algorithms, statistical modeling and neural networks as well as incredible communication skills.

Today, a lot of institutes offer state-of-the-art data science online courses that prove extremely beneficial for career growth and expansion. Combining theoretical knowledge and technical aspects of data science training, these institutes provide skill and assistance to develop real-world applications. DexLab Analytics is one such institute that is located in the heart of Delhi NCR. For more, feel free to reach us at <www.dexlabanalytics.com>

Future Prospects

After land, labour and capital, data ranks as the fourth factor of production. According to the US Department of Statistics, the demand for data engineers is likely to grow by 40% by 2020. If you are looking for a flourishing career option, this is the place to be: an entry-level engineer begins their career as a business analyst and then proceeds towards becoming a project manager. Later, after years of experience, these virgin business analysts further get promoted to become chief data officers.


Interested in a career in Data Analyst?

To learn more about Data Analyst with Advanced excel course – Enrol Now.
To learn more about Data Analyst with R Course – Enrol Now.
To learn more about Big Data Course – Enrol Now.

To learn more about Machine Learning Using Python and Spark – Enrol Now.
To learn more about Data Analyst with SAS Course – Enrol Now.
To learn more about Data Analyst with Apache Spark Course – Enrol Now.
To learn more about Data Analyst with Market Risk Analytics and Modelling Course – Enrol Now.

Top 4 Python Industrial Use-Cases: Explained

Top 4 Python Industrial Use-Cases: Explained

Dexlab ____ YOutube subscriber

Python is one of the fastest-growing and most popular coding languages in the world; a large number of developers use it on daily basis and why not, it works brilliantly for a plethora of developer job roles and data science positions – starting from scripting solution for sysadmins to supporting machine learning algorithms to fueling web development, Python can work wonders across myriad platforms!

Below, we’ve rounded up 4 amazing Python industrial use-cases; scroll ahead:

Insurance

Widely used in generating business insights; courtesy machine learning.

Case Study:

Smaller firms driven by machine learning gave stiff competition to a US multinational finance and insurance corporation. In return, the insurer formed teams and devised a new set of services and applications based on ML algorithms to enjoy a competitive edge. However, the challenge was that with so many data science tools, numerous versions of Python came into the picture and gave rise to compatibility issues. As a result, the company finalized only one version of Python, which was then used in line with machine learning algorithms and tools to derive specific results.

Data Science Machine Learning Certification

Finance

Data mining helps determine cross-sell opportunities.

Case Study:

Another US MNC dealing in financial services showed interest in mining complex customer behavioral data. Using Python, the company launched a series of ML and data science initiatives to dig into its structured data that it has been gathering for years and correlated it with an army of unstructured data, gathered from social media and web to enhance cross-selling and retrieve resources.

Aerospace

Python helps in meeting system deadlines and ensured utmost confidentiality.

Case Study:

Recently, the International Space Station struck a deal with an American MNC dealing in military, defense and aerospace technology; the latter has been asked to provide a series of systems to the ISS. The critical safety systems were mostly written in languages, like Ada; they didn’t fare well in terms of scripting tasks, data science analysis or GUI creation. That’s why Python was chosen; it offered bigger contract value and minimum exposure.

Retail Banking

Enjoy flexible data manipulation and transformation – all with Python!

Case Study:

A top-notch US department store chain equipped with an in-store banking division gathered data and stored it in a warehouse. The main aim of the company was to share the information with multiple platforms to fulfill its supply chain, analytics, retail banking and reporting needs. Though the company chose Python for on-point data manipulation, each division came up with their own versions of Python, resulting in a new array of issues. In the end, the company decided to keep a standard Python; this initiative not only resulted in amplifying engineering speed but also reduced support costs.

As end notes, Python is the next go-to language and is growing each day. If you have dreams of becoming an aspiring programmer, you need to book the best Python Certification Training in Delhi. DexLab Analytics is a premier Python training institute in Delhi; besides Python, it offers in-demand skill development courses for interested candidates.


The blog has been sourced from www.techrepublic.com/article/python-5-use-cases-for-programmers


Interested in a career in Data Analyst?

To learn more about Data Analyst with Advanced excel course – Enrol Now.
To learn more about Data Analyst with R Course – Enrol Now.
To learn more about Big Data Course – Enrol Now.

To learn more about Machine Learning Using Python and Spark – Enrol Now.
To learn more about Data Analyst with SAS Course – Enrol Now.
To learn more about Data Analyst with Apache Spark Course – Enrol Now.
To learn more about Data Analyst with Market Risk Analytics and Modelling Course – Enrol Now.

Know All about Usage-Driven Grouping of Programming Languages Used in Data Science

Know All about Usage-Driven Grouping of Programming Languages Used in Data Science

Programming skills are indispensable for data science professionals. The main job of machine learning engineers and data scientists is drawing insights from data, and their expertise in programming languages enable them to do this crucial task properly. Research has shown that professionals of the data science field typically work with three languages simultaneously. So, which ones are the most popular? Are some languages more likely to be used together?

Recent studies explain that certain programming languages are used jointly besides other programming languages that are used independently. With the survey data collected from Kaggle’s 2018 Machine Learning and Data Science study, usage patterns of over 18,000 data science experts working with 16 programming languages were analyzed. The research revealed that these languages can actually be categorized into smaller sets, resulting in 5 main groupings. The nature of the groupings is indicative of specific roles or applications that individual groups support, like analytics, front-end work and general-purpose tasks.

2

Principal Component Analysis for Dimension Reduction

In this article, we will explain how Bob E. Hayes, PhD holder, scientist, blogger and data science writer has used principal component analysis, a type of data reduction method, to categorize 16 different programming languages. Herein, the relationship among various languages is inspected before putting them in particular groups. Basically, principal component analysis looks into statistical associations like covariance within a large collection of variables, and then justifies these correlations with the help of a few variables, called components.

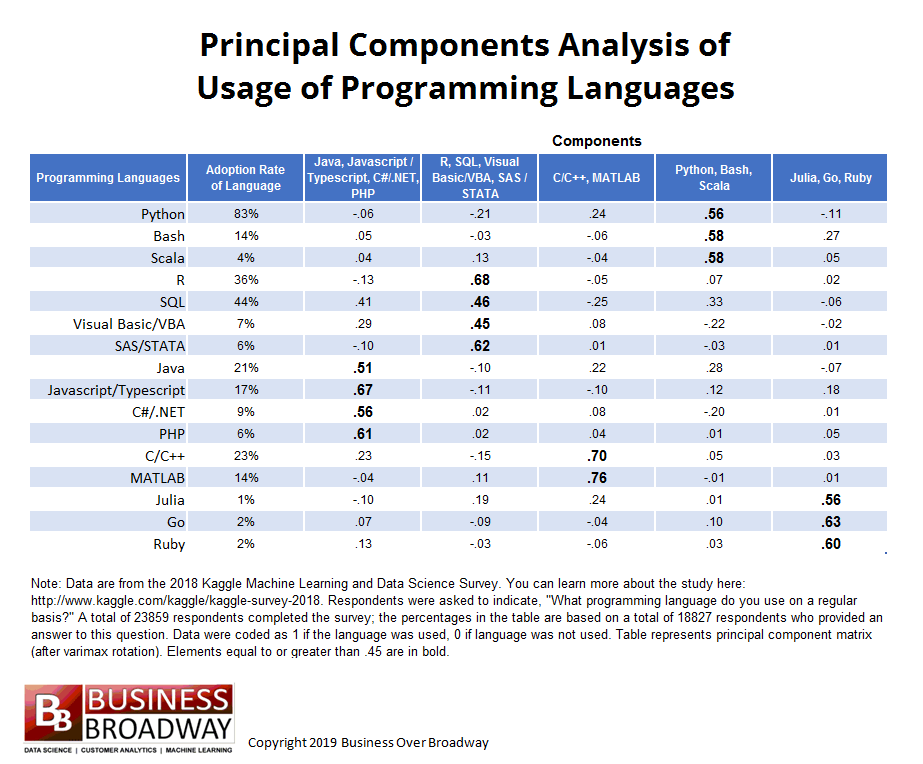
Principal component matrix presents the results of this analysis. The matrix is an nXm table, where:

n= total no. of original variables, which in this case are the number of programming languages

m= number of main components

The strength of relationship between each language and underlying components is represented by the elements of the matrix. Overall, the principal component analysis of programming language usage gives us two important insights:

  • How many underlying components (groupings of programming languages) describe the preliminary set of languages
  • The languages that go best with each programming language grouping

Result of Principal Component Analysis:

The nature of this analysis is exploratory, meaning no pre-defined structure was imposed on the data. The result was primarily driven by the type of relationship shared by the 16 languages. The aim was to explain the relationships with as less components as possible. In addition, few rules of thumb were used to establish the number of components. One was to find the number of eigen values with value greater than 1 – that number determines the number of components. Another method is to identify the breaking point in the scree plot, which is a plot of the 16 eigen values.

businessoverbroadway.com


5-factor solution was chosen to describe the relationships. This is owing to two reasons – firstly, 5 eigen values were greater than one and secondly, the scree plot showed a breaking point around 6th eigen value.

Following are two key interpretations from the principal component matrix:

  • Values greater than equal to .45 have been made bold
  • The headings of different components are named on the basis of tools that loaded highly on that component. For example, component 4 has been labeled as Python, Bash, Scala because these languages loaded highest on this component, implying respondents are likely to use Bash and Scala if they work with Python. Other 4 components were labeled in a similar manner.

Groupings of Programming Languages

The given data set is appropriately described by 5 tool grouping. Below are given 5 groupings, including the particular languages that fall within the group, meaning they are likely to be used together.

  1. Java, Javascript/Typescript, C#/.NET, PHP
  2. R, SQL, Visual Basic/VBA, SAS/STATA
  3. C/C++, MATLAB
  4. Python, Bash, Scala
  5. Julia, Go, Ruby

One programming language didn’t properly load into any of the components: SQL. However, SQL is used moderately with three programming languages, namely Java (component 1), R (component 2) and Python (component 4).

It is further understood that the groupings are determined by the functionality of different languages in the group. General-purpose programming languages, Python, Scala and Bash, got grouped under a single component, whereas languages used for analytical studies, like R and the other languages under comp. 2, got grouped together. Web applications and front-end work are supported by Java and other tools under component 1.

Conclusion:

Data science enthusiasts can succeed better in their projects and boost their chances of landing specific jobs by choosing correct languages that are suited for the job role they want. Being skilled in a single programming language doesn’t cut it in today’s competitive industry. Seasoned data professionals use a set of languages for their projects. Hence, the result of the principal component analysis implies that it’s wise for data pros to skill up in a few related programming languages rather than a single language, and focus on a specific part of data science.

For more help with your data science learning, get in touch with DexLab Analytics, a leading data analyst training institute in Delhi. Also check our Machine learning courses in Delhi to be trained in the essential and latest skills in the field.

 
Reference: http://customerthink.com/usage-driven-groupings-of-data-science-and-machine-learning-programming-languages
 

Interested in a career in Data Analyst?

To learn more about Data Analyst with Advanced excel course – Enrol Now.
To learn more about Data Analyst with R Course – Enrol Now.
To learn more about Big Data Course – Enrol Now.

To learn more about Machine Learning Using Python and Spark – Enrol Now.
To learn more about Data Analyst with SAS Course – Enrol Now.
To learn more about Data Analyst with Apache Spark Course – Enrol Now.
To learn more about Data Analyst with Market Risk Analytics and Modelling Course – Enrol Now.
General Python Guide 2019: Learning Data Analytics with Python

General Python Guide 2019: Learning Data Analytics with Python

Python and data analytics are possibly three of the most commonly heard words these days. In today’s burgeoning tech scene, being skillful in these two subjects can prove very profitable. Over the years, we have seen the importance of Python education in the field of data science skyrocketing.

So here we present a general guide to help start off your Python learning:

Reasons to Choose Python:

  • Popularity

With over 40% data scientists preferring Python, it is clearly one of the most widely used tools in data analysis. It has risen in popularity above SAS and SQL, only lagging behind R.

  • General Purpose Language

There might be many other great tools in the market for analyzing data, like SAS and R, but Python is the only trustworthy general-purpose language valid across a number of application domains.

2

Step 1: Setup Python Environment

Setting up Python environment is uncomplicated, but a primary step. Downloading the free Anaconda Python package is recommended. Besides core Python language, it includes all the essential libraries, such as Pandas, SciPy, NumPy and IPython, and graphical installer also. Post installation, a package containing several programs is launched, most important one being iPython also known as Jupyter notebook. After launching the notebook, the terminal opens and a notebook is started in the browser. This browser works as the coding platform and there’s no need for internet connection even.

Step 2: Knowing Python Fundamentals

Getting familiar with the basics of Python can happen online. Active participation in free online courses, where video tutorials, practice exercises are plentiful, can help you grasp the fundamentals quickly. However, if you are seeking expert guidance, you must explore our Python data science courses.

Step 3: Know Key Python Packages used for Data Analysis

Since it is a general purpose language, Python’s utility stretches beyond data science. But there are plentiful Python libraries useful in data functionalities.

Numpy – essential for scientific computing

Matplotib – handy for visualization and plotting

Pandas – used in data operations

Skikit-learn – library meant to help with data mining and machine learning activities

StatsModels – applied for statistical analysis and modeling

Scipy-SciPy – the Numpy extension of Python; it is a set of math functions and algorithms

Theano – package defining multi-dimensional arrays.

Step 4: Load Sample Data for Practice

Working with sample datasets is a great way of getting familiar with a programming language. Through this kind of practice, candidates can try out different methods, apply novel techniques and also pinpoint areas of strength and in need of improvement.

Python library StatModels contains preloaded datasets for practice. Users can also download dataset from CSV files or other sources on web.

Step 5: Data Operations

Data administration is a key skill that helps extract information from raw data. Majority of times, we get access to crude data that cannot be analyzed straightaway; it needs to be manipulated before analyzing. Python has several tools for formatting, manipulating and cleaning data before it is examined.

Step 6: Efficient Data Visualization

Visuals are very valuable for investigative data analysis and also explaining results lucidly. The common Python library used for visualization is Matplotlib.

Step 7: Data Analytics

Formatting data and designing graphs and plots are important in data analysis. But the foundation of analytics is in statistical modeling, data mining and machine learning algorithms. Having libraries like StatsModels and Scikit-learn, Python provides all necessary tools essential for performing core analyzing functions.

Concluding

As mentioned before, the key to learning data analytics with Python is practicing with imported data sets. So without delay, start experimenting with old operations and new techniques on data sets.

For more useful blogs on data science, follow DexLab Analytics – we help you stay updated with all the latest happenings in the data world! Also, check our excellent Python courses in Delhi NCR.


Interested in a career in Data Analyst?

To learn more about Data Analyst with Advanced excel course – Enrol Now.
To learn more about Data Analyst with R Course – Enrol Now.
To learn more about Big Data Course – Enrol Now.

To learn more about Machine Learning Using Python and Spark – Enrol Now.
To learn more about Data Analyst with SAS Course – Enrol Now.
To learn more about Data Analyst with Apache Spark Course – Enrol Now.
To learn more about Data Analyst with Market Risk Analytics and Modelling Course – Enrol Now.
Being a Statistician Matters More, Here’s Why

Being a Statistician Matters More, Here’s Why

Right data for the right analytics is the crux of the matter. Every data analyst looks for the right data set to bring value to his analytics journey. The best way to understand which data to pick is fact-finding and that is possible through data visualization, basic statistics and other techniques related to statistics and machine learning – and this is exactly where the role of statisticians comes into play. The skill and expertise of statisticians are of higher importance.

2

Below, we have mentioned the 3R’s that boosts the performance of statisticians:

Recognize – Data classification is performed using inferential statistics, descriptive and diverse other sampling techniques.

Ratify – It’s very important to approve your thought process and steer clear from acting on assumptions. To be a fine statistician, you should always indulge in consultations with business stakeholders and draw insights from them. Incorrect data decisions take its toll.

Reinforce – Remember, whenever you assess your data, there will be plenty of things to learn; at each level, you might discover a new approach to an existing problem. The key is to reinforce: consider learning something new and reinforcing it back to the data processing lifecycle sometime later. This kind of approach ensures transparency, fluency and builds a sustainable end-result.

Now, we will talk about the best statistical techniques that need to be applied for better data acknowledgment. This is to say the key to becoming a data analyst is through excelling the nuances of statistics and that is only possible when you possess the skills and expertise – and for that, we are here with some quick measures:

Distribution provides a quick classification view of values within a respective data set and helps us determine an outlier.

Central tendency is used to identify the correlation of each observation against a proposed central value. Mean, Median and Mode are top 3 means of finding that central value.

Dispersion is mostly measured through standard deviation because it offers the best scaled-down view of all the deviations, thus highly recommended.

Understanding and evaluating the data spread is the only way to determine the correlation and draw a conclusion out of the data. You would find different aspects to it when distributed into three equal sections, namely Quartile 1, Quartile 2 and Quartile 3, respectively. The difference between Q1 and Q3 is termed as the interquartile range.

While drawing a conclusion, we would like to say the nature of data holds crucial significance. It decides the course of your outcome. That’s why we suggest you gather and play with your data as long as you like for its going to influence the entire process of decision-making.

On that note, we hope the article has helped you understand the thumb-rule of becoming a good statistician and how you can improve your way of data selection. After all, data selection is the first stepping stone behind designing all machine learning models and solutions.

Saying that, if you are interested in learning machine learning course in Gurgaon, please check out DexLab Analytics. It is a premier data analyst training institute in the heart of Delhi offering state-of-the-art courses.


The blog has been sourced from www.analyticsindiamag.com/are-you-a-better-statistician-than-a-data-analyst


Interested in a career in Data Analyst?

To learn more about Data Analyst with Advanced excel course – Enrol Now.
To learn more about Data Analyst with R Course – Enrol Now.
To learn more about Big Data Course – Enrol Now.

To learn more about Machine Learning Using Python and Spark – Enrol Now.
To learn more about Data Analyst with SAS Course – Enrol Now.
To learn more about Data Analyst with Apache Spark Course – Enrol Now.
To learn more about Data Analyst with Market Risk Analytics and Modelling Course – Enrol Now.
Discover Top 5 Data Scientist Archetypes

Discover Top 5 Data Scientist Archetypes

Data science jobs are labelled as the hottest job of the 21st century. For the last few years, this job profile is indeed gaining accolades. And yes, that’s a good thing! Although much has been said about how to progress towards a successful career as a data scientist, little do we know about the types of data scientists you may come across in the industry! In this blog, we are going to explore the various kinds of data scientists or simply put – the data scientist archetypes found in every organization.

Generalist

This is the most common type of data scientists you find in every industry. The Generalist contains an exemplary mixture of skill and expertise in data modelling, technical engineering, data analysis and mechanics. These data scientists interact with researchers and experts in the team. They are the ones who climb up to the Tier-1 leadership teams, and we aren’t complaining!

Detective

He is the one who is prudent and puts enough emphasis on data analysis. This breed of data scientists knows how to play with the right data, incur insights and derive conclusions. The researchers say, with an absolute focus on analysis, a detective is familiar with numerous engineering and modelling techniques and methods.

Maker

The crop of data scientists who are obsessed with data engineering and architecture are known as the Makers. They know how to transform a petty idea into concrete machinery. The core attribute of a Maker is his knowledge in modelling and data mechanisms, and that’s what makes the project reach heights of success in relatively lesser time.

Enrol in one of the best data science courses in Gurgaon from DexLab Analytics.

Oracle

Having mastered the art and science of machine learning, the Oracle data scientist is rich in experience and full of expertise. Tackling the meat of the problem cracks the deal. Also called as data ninjas, these data scientists possess the right know how of how to deal with specific tools and techniques of analysis and solve crucial challenges. Elaborate experience in data modelling and engineering helps!

Unicorn

The one who runs the entire data science team and is the leader of the team is the Unicorn. A Unicorn data scientist is reckoned to be a data ninja or an expert in all aspects of data science domain and stays a toe ahead to nurture all the data science nuances and concepts. The term is basically a fusion version of all the archetypes mentioned above weaved together – the job responsibility of a data unicorn is impossible to suffice, but it’s a long road, peppered with various archetypes as a waypoint.

Organizations across the globe, including media, telecom, banking and financial institutions, market research companies, etc. are generating data of various types. These large volumes of data call for impeccable data analysis. For that, we have these data science experts – they are well-equipped with desirable data science skills and are in high demand throughout industry verticals.

Thinking of becoming a data ninja? Try data science courses in Delhi NCR: they are encompassing, on-point and industry-relevant.


The blog has been sourced from  ― www.analyticsindiamag.com/see-the-6-data-scientist-archetypes-you-will-find-in-every-organisation


Interested in a career in Data Analyst?

To learn more about Data Analyst with Advanced excel course – Enrol Now.
To learn more about Data Analyst with R Course – Enrol Now.
To learn more about Big Data Course – Enrol Now.

To learn more about Machine Learning Using Python and Spark – Enrol Now.
To learn more about Data Analyst with SAS Course – Enrol Now.
To learn more about Data Analyst with Apache Spark Course – Enrol Now.
To learn more about Data Analyst with Market Risk Analytics and Modelling Course – Enrol Now.
Private Banks, Followed by E-commerce and Telecom Industry Shows High Adoption Rates for Data Analytics

Private Banks, Followed by E-commerce and Telecom Industry Shows High Adoption Rates for Data Analytics

Are you looking for a data analyst job? The chances of bagging a job at a private bank are more than that a public bank. The former is more likely to hire you than the latter.

As a matter of fact, data analytics is widely being used in the private banking and e-commerce sectors – according to a report on the state of data analytics in Indian business. The veritable report was released last month by Analytics India Magazine in association with the data science institute INSOFE. Next to banking and ecommerce, telecom and financial service sectors have started to adopt the tools of data analytics on a larger scale, the report mentioned.

The report was prepared focusing on 50 large firms across myriad sectors, namely Maruti Suzuki and Tata Motors in automobiles, ONGC and Reliance Industries under oil-drilling and refineries, Zomato and Paytm under e-commerce tab, and HDFC and the State Bank of India in banking.

2

If you follow the study closely, you will discover that in a nutshell, data analytics and data science boasts of a healthy adoption rate all throughout – 64% large Indian firms has started implementing this wonder tool at their workplaces. As a fact, if a firm is found to have an analytics penetration rate of minimum 0.75% (which means, at least one analytics professional is found out of 133 employees in a company), we can say the company has adopted analytics.

Nevertheless, the rate of adoption was not universal overall. We can see that infrastructure firms have zero adoption rates – this might be due to a lack of resources to power up a robust analytics facility or whatever. Also, steel, power and oil exhibited low adoption rates as well with not even 40% of the surveyed firms crossing the 0.75% bar. On contrary, private banks and telecom industry showed a total 100% adoption rates.

Astonishingly, public sector banks showed a 50% adoption rate- almost half of the rate in the private sector.

The study revealed more and more companies in India are looking forward to data analytics to boost sales and marketing initiatives. The tools of analytics are largely employed in the sales domain, followed by finance and operations.

Apparently, not much of the results were directly comparable with that of the last year’s study. Interestingly, one metric – analytics penetration rate – was measured last year as well, which is nothing but the ratio of analytics-oriented employees to the total. Also, last year, you would have found one out of 59 employees in an average organization, which has now reached one data analyst for every 36 employees.

For detailed information, read the full blog here: qz.com/india/1482919/banks-telcos-e-commerce-firms-hire-most-data-analysts-in-india

If you are interested in following more such interesting blogs and technology-related updates, follow DexLab Analytics, a premium analytics training institute headquartered in Gurgaon, Delhi. Grab a data analyst certification today and join the bandwagon of success.


Interested in a career in Data Analyst?

To learn more about Data Analyst with Advanced excel course – Enrol Now.
To learn more about Data Analyst with R Course – Enrol Now.
To learn more about Big Data Course – Enrol Now.

To learn more about Machine Learning Using Python and Spark – Enrol Now.
To learn more about Data Analyst with SAS Course – Enrol Now.
To learn more about Data Analyst with Apache Spark Course – Enrol Now.
To learn more about Data Analyst with Market Risk Analytics and Modelling Course – Enrol Now.

Data Driven Projects: 3 Questions That You Need to Know

Data Driven Projects: 3 Questions That You Need to Know

Today, data is an asset. It’s a prized possession for companies – it helps derive crucial insights about customers, thus future business operations. It also boosts sales, predicts product development and optimizes delivery chains.

Nevertheless, several recent reports suggest that even though data floats around in abundance, a bulk of data-driven projects fail. In 2017 alone, Gartner highlighted 60% of big data projects fail – so what leads it? Why the availability of data still can’t ensure success of these projects?

2

Right data, do I have it?

It’s best to assume the data which you have is accurate. After all, organizations have been keeping data for years, and now it’s about time they start making sense out of it. The challenge that they come across is that this data might give crucial insights about past operations, but for present scenario, they might not be good enough.

To predict the future outcomes, you need fresh, real-time data. But do you know how to find it? This question leads us to the next sub-head.

Where to find relevant data?

Each and every company does have a database. In fact, many companies have built in data warehouses, which can be transformed into data lakes. With such vast data storehouses, finding data is no more a difficult task, or is it?

Gartner report shared, “Many of these companies have built these data lakes and stored a lot of data in them. But if you ask the companies how successful are you doing predictions on the data lake, you’re going to find lots and lots of struggle they’re having.”

Put simply, too many data storehouses may pose a challenge at times. The approach, ‘one destination for all data in the enterprise’ can be detrimental. Therefore, it’s necessary to look for data outside the data warehouses; third party sources can be helpful or even company’s partner network.

How to combine data together?

Siloed data can be calamitous. Unsurprisingly, data is available in all shapes and is derived from numerous sources – software applications, mobile phones, IoT sensors, social media platforms and lot more – compiling all the data sources and reconciling data to derive meaningful insights can thus be extremely difficult.

However, the problem isn’t about the lack of technology. A wide array of tools and software applications are available in the market that can speed up the process of data integration. The real challenge lies in understanding the crucial role of data integration. After all, funding an AI project is no big deal – but securing a budget to address the problem of data integration efficiently is a real challenge.

In a nutshell, however data sounds all promising, many organizations still don’t know how achieve full potential out of data analytics. They need to strengthen their data foundation, and make sure the data that is collected is accurate and pulled out from a relevant source.

A good data analyst course in Gurgaon can be of help! Several data analytics training institutes offer such in-demand skill training course, DexLab Analytics is one of them. For more information, visit their official site.

The blog has been sourced fromdataconomy.com/2018/10/three-questions-you-need-to-answer-to-succeed-in-data-driven-projects


Interested in a career in Data Analyst?

To learn more about Data Analyst with Advanced excel course – Enrol Now.
To learn more about Data Analyst with R Course – Enrol Now.
To learn more about Big Data Course – Enrol Now.

To learn more about Machine Learning Using Python and Spark – Enrol Now.
To learn more about Data Analyst with SAS Course – Enrol Now.
To learn more about Data Analyst with Apache Spark Course – Enrol Now.
To learn more about Data Analyst with Market Risk Analytics and Modelling Course – Enrol Now.
Human Element Remains Critical for Enhanced Digital Customer Experience

Human Element Remains Critical for Enhanced Digital Customer Experience

Digital customer engagement and service is trending the charts. Companies are found actively focusing on establishing long-lasting relationships in sync with customer expectations to hit better results and profitable outcomes. Customers are even hopeful about businesses implementing smart digital channels to solve complex service issues and finish transactions.

70 % of customers expect companies to have a self-service option in their websites and 50% expect to solve issues concerning products or services themselves – according to Zendesk.

In this regard, below we’ve charted down a few ways to humanize the customer experience, keeping the human aspect in prime focus:

2

Adding Human Element through Brand Stories

Each brand tells a story. But, how, or in what ways do the brands tell their story to the customers? Is it through videos or texts? Brand’s history or values need to be iterated in the right voice to the right audience. Also, the companies must send a strong message saying how well they value their customers and how they always put their customers in the first place, before anything else.

Additionally, the company’s sales team should always look forward to help their customers with after-purchase information – such as how well the customers are enjoying certain features, whether any improvement is needed and more – valuable customer feedback always help at the end of the day!

AI for Feedback

Identify prospective customers who are becoming smarter day by day. This is done via continuous feedback loops along with automated continuous education. Whenever you receive feedback from a specific customer interaction, it’s advised to feed it back to their profile. An enclosed feedback loop is quite important to gain meaningful information about customers and their purchasing pattern. This is the best way to know well your customers and determine what they want and how.

Time and again, customers are asked by brands to take part in specific surveys and rate their services, describing what their feelings are about those particular products or services. All this helps comprehend customer’s satisfaction quotient regarding services, and in a way helps you take necessary action in enhancing customer experience.

Personalized Content for Customer Satisfaction

Keeping customers interested in your content is the key. Become a better story-teller and enhance customer satisfaction. Customers like it when you tell your brand’s story in your own, innovative way. But, of course, marketers face a real challenge when writing down an entertaining story, not appearing like written by agency but themselves.

A token of advice from our side – never go too rigid; be original, and try to narrate the story in an interactive way. To craft a unique brand story, the essence lies in using little wit, humor and a dash of self-effacement to add a beat to the brand.

End Notes

As parting thoughts, we would like to say always act in real-time, and better understand what your customers what and their behavioral traits. This way it would be easier to predict their next move. What’s more, your brand should be people-based and make intelligent use of customer’s available data to develop a deeper understating about your users and their respective needs.

DexLab Analytics is a prime data analyst training institute in Delhi – their data analyst training courses is as per industry standards and brimmed with practical expertise merged with theoretical knowledge. Visit the website now.

 
The blog has been sourced fromdataconomy.com/2018/08/how-to-keep-the-human-element-in-digital-customer-experience
 

Interested in a career in Data Analyst?

To learn more about Data Analyst with Advanced excel course – Enrol Now.
To learn more about Data Analyst with R Course – Enrol Now.
To learn more about Big Data Course – Enrol Now.

To learn more about Machine Learning Using Python and Spark – Enrol Now.
To learn more about Data Analyst with SAS Course – Enrol Now.
To learn more about Data Analyst with Apache Spark Course – Enrol Now.
To learn more about Data Analyst with Market Risk Analytics and Modelling Course – Enrol Now.

Call us to know more