Data analyst course in Gurgaon Archives - Page 7 of 9 - DexLab Analytics | Big Data Hadoop SAS R Analytics Predictive Modeling & Excel VBA

How Data Analytics Influences Holiday Retail Experience [Video]

Thanksgiving was right here! Half of the globe witnessed some crazy shopping kicking off the entire holiday season, and retailers had a whale of a time, offering luscious discounts and consumer gifts at half the prices.

 
How Data Analytics Influences Holiday Retail Experience
 

Before the weekend Thanksgiving sale, 69% of Americans, close to 164 million people across the US were estimated to shop– and they had planned to shell out up to 3.4% more money as compared to last year’s Black Friday and Cyber Monday sale. The forecasts came from National Retail Federation’s annual survey, headed by Prosper Insights & Analytics.

Continue reading “How Data Analytics Influences Holiday Retail Experience [Video]”

Internet of Things: It’s Much More Than What It Appears to Be

Internet of Things: It’s Much More Than What It Appears to Be

What’s all the hype about “the next big thing”? Have you got it yet? Nope? It’s not owing to a lack of imagination, but an observation.

Currently, the Internet of Things is the big buzz. It’s all about enhancing machine-to-machine communication – being structured on cloud computing and systems of data-gathering sensors, the connection is entirely virtual, mobile and instantaneous.

Big Data And The Internet Of Things – @Dexlabanalytics.

What is IoT?

In simple terms, the concept of IoT stresses on connecting any device with the Internet – including cellphones, headphones, washing machines, lamps, coffee makers, wearable devices and almost anything that comes in your mind. The IoT is a colossal network of connected Things (inclusive of people) – the famous analyst firm Gartner says by 2020 there will be more than 26 billion connected devices in this world.

Explaining the Everlasting Bond between Data and Risk Analytics – @Dexlabanalytics.

What makes it so popular?

As we now know, IoT is a network of things and people, where communication takes place through numerous wireless and wired technologies and it comes with a wide set of advantages. Following are some of the advantages of this new breed of technology:

A better, less-complicated life

Imagine a life, where what you seek will be delivered to you right away, before you even ask for it. It may appear to you that you are dropped right into a scene from your favorite sci-fi movie or novel – the moment your morning alarm starts ringing, your bathtub automatically starts getting filled with hot water; when you leave your home, the lights get turned off automatically and doors lock itself on its own; your car takes you to the office through the less-congested roadway and when you return home, your home lights automatically start to switch on and lastly your air conditioner adjusts the temperature of your room once you are ready to hit the bed. Proper use of IoT makes your life easier and effortlessly simple.

Is Change the Only Constant: How Analytics has Changed, while Staying the Same Over the Last Decade – @Dexlabanalytics.

Less accident, better safety

How would it be if for an example you get a heart attack while driving back home and your smartwatch detects it and deploys autopilot mode in your car so that it straightaway takes you directly to the nearest hospital? On the way, your cellphone can dial up the hospital staffs and inform them about the current condition of the patient to help you get the best treatment possible.

Harnessing the power of data

Utilizing the power of data is awesome. Harnessing data to simplify things is the next best thing in today’s world. Living a life straight out of sci-fi movies is awesome, but practically, there’s still some time left for IoT to become a hardcore reality. Once IoT makes its way into our lives, a set of smart devices powered by sensors will take charge and make almost everything possible – whether it’s switching on the AC automatically when a person enters the room or driving a car to a destination without any driver.

IoT helps in taking better decisions in the best interest for businesses

Beyond making your lives easier, IoT possesses a bunch of capabilities – it’s a robust technology that collects the most valuable resource, i.e. data. Data helps businesses take better, well-informed decisions. 

Of all the recent technological developments, Internet of Things is considered to be one of the biggest trends to watch out for. In the next 5 years, it’s going to change lives forever!

To know more about the Internet of Things and more such digital trends, why don’t you settle for a good business analytics course in Delhi! DexLab Analytics is a premier Data Science training institute Gurgaon that offers hands-on experience to students alike.


Interested in a career in Data Analyst?

To learn more about Data Analyst with Advanced excel course – Enrol Now.
To learn more about Data Analyst with R Course – Enrol Now.
To learn more about Big Data Course – Enrol Now.

To learn more about Machine Learning Using Python and Spark – Enrol Now.
To learn more about Data Analyst with SAS Course – Enrol Now.
To learn more about Data Analyst with Apache Spark Course – Enrol Now.
To learn more about Data Analyst with Market Risk Analytics and Modelling Course – Enrol Now.

Discover the Best Industries to Have a Career in Data Science

Discover-the-Best-Industries-to-Have-a-Career-in-Data-Science

Data fires up everything, nowadays. And data science is gaining exceptional traction in the job world, as data analytics, machine learning, big data, and data mining are fetching relevance in the mainstream tech world. By 2025, it is being expected that data science industry will reach $16 billion in value – this is why landing a job in data science domain is the next big thing!

The skills you will imbibe as a data scientist would be incredible, powerful and extremely valuable. You can easily a bag a dream job in corporate moguls, like Coca-Cola, Uber, Ford Motors and IBM, as well as play a significant role in any pro-social or philanthropic endeavors to make this world a better place to live in.

Check out these extremely interesting fields you could start your career in data science:

Biotechnology

No wonder, science and medicine are intricately related to each other. As the technology pushes boundaries, more and more companies are recommitting themselves towards a better public health by nabbing biotechnology. Being a data scientist, you would help in unraveling newer ways of studying large amounts of data – including machine learning, semantic and interactive technologies. Eventually, they would influence treatments, drugs-usage, testing procedures and much more.

Untitled

Energy

Power industry functions on data – and tons of it. Whether it’s about extracting mineral wealth from the earth’s crust or transporting crude oil or planning better storage facilities, the demand for data scientists is on the rise. Just as expanding oil fields ask for humongous amounts of data study, installing and refining cleaner energy production facilities relies on data about the natural environment and ways of modern construction. Data scientists are often given a ring to enhance safety standards and help companies recommit themselves towards better safety and environmental regulations.

Transportation

Recently, transportation is undergoing a robust change. For example, Tesla paved a new road of development and turned countless heads by unveiling a long-haul truck that could drive on its own. Though it’s not the first time, they are prone to lead the change.

Beyond self-driving vehicle technology, the transportation industry is looking for more efficient ways to preserve and transport energy. These advancements in technology works wonders when combined with better battery technology development – in simple terms, every individual field in transportation industry is believed to benefit from a motley team of data scientists.

jpg

Telecommunications

The internet is not only about tubes, but all about data. The future of the internet is here, with ever-increasing networks of satellites and user devices establishing communication through blockchain. Though they are yet to be used on large-scale, they have started making news. In situations like this, it would be difficult not to highlight the importance of data science and data architecture as they are becoming major influencers in the internet world. Whenever there is a dire need to make the public aware of a new product, we rely on user data – hence the role of data scientists is the key to a better future.

Today, data science is an interesting field to explore, and it is going to play an integral role as the stride in technology and globalization keeps expanding its base. If you have a keen eye for numbers, charts, patterns and analytics, this niche is perfectly suitable for you.

DexLab Analytics is a prime Data Science training institute Delhi that excels in offering advanced business analyst training courses in Gurgaon. Visit our official site for more information and make a mark in data analytics!


Interested in a career in Data Analyst?

To learn more about Data Analyst with Advanced excel course – Enrol Now.
To learn more about Data Analyst with R Course – Enrol Now.
To learn more about Big Data Course – Enrol Now.

To learn more about Machine Learning Using Python and Spark – Enrol Now.
To learn more about Data Analyst with SAS Course – Enrol Now.
To learn more about Data Analyst with Apache Spark Course – Enrol Now.
To learn more about Data Analyst with Market Risk Analytics and Modelling Course – Enrol Now.

Write ETL Jobs to Offload the Data Warehouse Using Apache Spark

Write ETL Jobs to Offload the Data Warehouse Using Apache Spark

The surge of Big Data is everywhere. The evolving trends in BI have taken the world in its stride and a lot of organizations are now taking the initiative of exploring how all this fits in.

Leverage data ecosystem to its full potential and invest in the right technology pieces – it’s important to think ahead so as to reap maximum benefits in IT in the long-run.

“By 2020, information will be used to reinvent, digitalize or eliminate 80% of business processes and products from a decade earlier.” – Gartner’s prediction put it so right!

The following architecture diagram entails a conceptual design – it helps you leverage the computing power of Hadoop ecosystem from your conventional BI/ Data warehousing handles coupled with real time analytics and data science (data warehouses are now called data lakes).

moderndwarchitecture

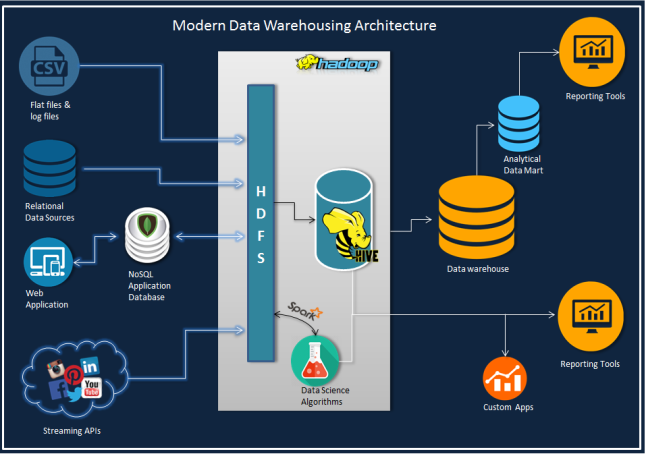
In this post, we will discuss how to write ETL jobs to offload data warehouse using PySpark API from the genre of Apache Spark. Spark with its lightning-fast speed in data processing complements Hadoop.

Now, as we are focusing on ETL job in this blog, let’s introduce you to a parent and a sub-dimension (type 2) table from MySQL database, which we will merge now to impose them on a single dimension table in Hive with progressive partitions.

Stay away from snow-flaking, while constructing a warehouse on hive. It will reduce useless joins as each join task generates a map task.

Just to raise your level of curiosity, the output on Spark deployment alone in this example job is 1M+rows/min.

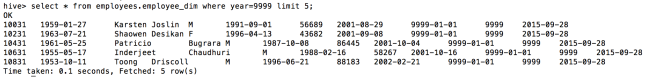
The Employee table (300,024 rows) and a Salaries table (2,844,047 rows) are two sources – here employee’s salary records are kept in a type 2 fashion on ‘from_date’ and ‘to_date’ columns. The main target table is a functional Hive table with partitions, developed on year (‘to_date’) from Salaries table and Load date as current date. Constructing the table with such potent partition entails better organization of data and improves the queries from current employees, provided the to_date’ column has end date as ‘9999-01-01’ for all current records.

The rationale is simple: Join the two tables and add load_date and year columns, followed by potent partition insert into a hive table.

Check out how the DAG will look:

screen-shot-2015-09-28-at-1-44-32-pm

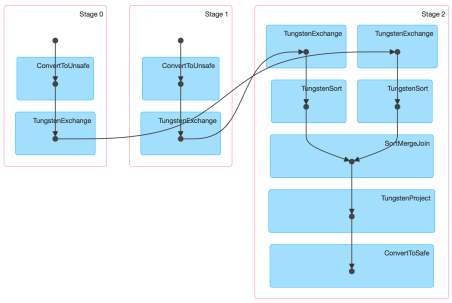
Next to version 1.4 Spark UI conjures up the physical execution of a job as Direct Acyclic Graph (the diagram above), similar to an ETL workflow. So, for this blog, we have constructed Spark 1.5 with Hive and Hadoop 2.6.0

Go through this code to complete your job easily: it is easily explained as well as we have provided the runtime parameters within the job, preferably they are parameterized.

Code: MySQL to Hive ETL Job

__author__ = 'udaysharma'
# File Name: mysql_to_hive_etl.py
from pyspark import SparkContext, SparkConf
from pyspark.sql import SQLContext, HiveContext
from pyspark.sql import functions as sqlfunc

# Define database connection parameters
MYSQL_DRIVER_PATH = "/usr/local/spark/python/lib/mysql-connector-java-5.1.36-bin.jar"
MYSQL_USERNAME = '<USER_NAME >'
MYSQL_PASSWORD = '********'
MYSQL_CONNECTION_URL = "jdbc:mysql://localhost:3306/employees?user=" + MYSQL_USERNAME+"&password="+MYSQL_PASSWORD 

# Define Spark configuration
conf = SparkConf()
conf.setMaster("spark://Box.local:7077")
conf.setAppName("MySQL_import")
conf.set("spark.executor.memory", "1g")

# Initialize a SparkContext and SQLContext
sc = SparkContext(conf=conf)
sql_ctx = SQLContext(sc)

# Initialize hive context
hive_ctx = HiveContext(sc)

# Source 1 Type: MYSQL
# Schema Name  : EMPLOYEE
# Table Name   : EMPLOYEES
# + --------------------------------------- +
# | COLUMN NAME| DATA TYPE    | CONSTRAINTS |
# + --------------------------------------- +
# | EMP_NO     | INT          | PRIMARY KEY |
# | BIRTH_DATE | DATE         |             |
# | FIRST_NAME | VARCHAR(14)  |             |
# | LAST_NAME  | VARCHAR(16)  |             |
# | GENDER     | ENUM('M'/'F')|             |
# | HIRE_DATE  | DATE         |             |
# + --------------------------------------- +
df_employees = sql_ctx.load(
    source="jdbc",
    path=MYSQL_DRIVER_PATH,
    driver='com.mysql.jdbc.Driver',
    url=MYSQL_CONNECTION_URL,
    dbtable="employees")

# Source 2 Type : MYSQL
# Schema Name   : EMPLOYEE
# Table Name    : SALARIES
# + -------------------------------- +
# | COLUMN NAME | TYPE | CONSTRAINTS |
# + -------------------------------- +
# | EMP_NO      | INT  | PRIMARY KEY |
# | SALARY      | INT  |             |
# | FROM_DATE   | DATE | PRIMARY KEY |
# | TO_DATE     | DATE |             |
# + -------------------------------- +
df_salaries = sql_ctx.load(
    source="jdbc",
    path=MYSQL_DRIVER_PATH,
    driver='com.mysql.jdbc.Driver',
    url=MYSQL_CONNECTION_URL,
    dbtable="salaries")

# Perform INNER JOIN on  the two data frames on EMP_NO column
# As of Spark 1.4 you don't have to worry about duplicate column on join result
df_emp_sal_join = df_employees.join(df_salaries, "emp_no").select("emp_no", "birth_date", "first_name",
                                                             "last_name", "gender", "hire_date",
                                                             "salary", "from_date", "to_date")

# Adding a column 'year' to the data frame for partitioning the hive table
df_add_year = df_emp_sal_join.withColumn('year', F.year(df_emp_sal_join.to_date))

# Adding a load date column to the data frame
df_final = df_add_year.withColumn('Load_date', F.current_date())

df_final.repartition(10)

# Registering data frame as a temp table for SparkSQL
hive_ctx.registerDataFrameAsTable(df_final, "EMP_TEMP")

# Target Type: APACHE HIVE
# Database   : EMPLOYEES
# Table Name : EMPLOYEE_DIM
# + ------------------------------- +
# | COlUMN NAME| TYPE   | PARTITION |
# + ------------------------------- +
# | EMP_NO     | INT    |           |
# | BIRTH_DATE | DATE   |           |
# | FIRST_NAME | STRING |           |
# | LAST_NAME  | STRING |           |
# | GENDER     | STRING |           |
# | HIRE_DATE  | DATE   |           |
# | SALARY     | INT    |           |
# | FROM_DATE  | DATE   |           |
# | TO_DATE    | DATE   |           |
# | YEAR       | INT    | PRIMARY   |
# | LOAD_DATE  | DATE   | SUB       |
# + ------------------------------- +
# Storage Format: ORC


# Inserting data into the Target table
hive_ctx.sql("INSERT OVERWRITE TABLE EMPLOYEES.EMPLOYEE_DIM PARTITION (year, Load_date) \
            SELECT EMP_NO, BIRTH_DATE, FIRST_NAME, LAST_NAME, GENDER, HIRE_DATE, \
            SALARY, FROM_DATE, TO_DATE, year, Load_date FROM EMP_TEMP")

As we have the necessary configuration mentioned in our code, we will simply call to run this job

spark-submit mysql_to_hive_etl.py

As soon as the job is run, our targeted table will consist 2844047 rows just as expected and this is how the partitions will appear:

screen-shot-2015-09-29-at-12-42-37-am

2

3

screen-shot-2015-09-29-at-12-46-55-am

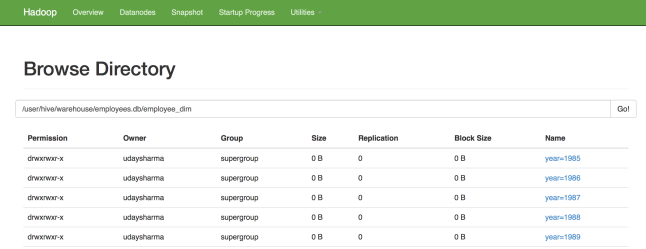
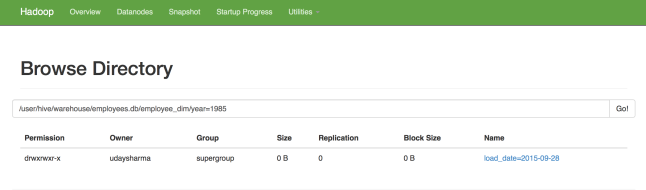
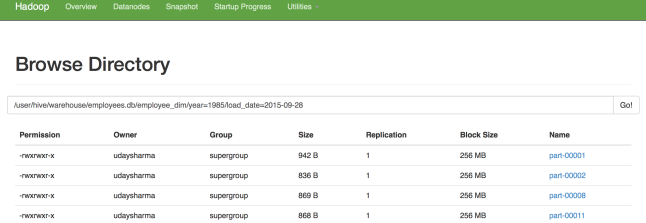
The best part is that – the entire process gets over within 2-3 mins..

For more such interesting blogs and updates, follow us at DexLab Analytics. We are a premium Big Data Hadoop institute in Gurgaon catering to the needs of aspiring candidates. Opt for our comprehensive Hadoop certification in Delhi and crack such codes in a jiffy!


Interested in a career in Data Analyst?

To learn more about Data Analyst with Advanced excel course – Enrol Now.
To learn more about Data Analyst with R Course – Enrol Now.
To learn more about Big Data Course – Enrol Now.

To learn more about Machine Learning Using Python and Spark – Enrol Now.
To learn more about Data Analyst with SAS Course – Enrol Now.
To learn more about Data Analyst with Apache Spark Course – Enrol Now.
To learn more about Data Analyst with Market Risk Analytics and Modelling Course – Enrol Now.

Why Ethereum Is the Next Big Thing for Today’s Netizens?

Why Ethereum Is the Next Big Thing for Today’s Netizens?


Today, Pelle Braendgaard writes distributed applications, or “DApps,” for Ethereum—a cryptography-based technology that is waiting to make an impact. It’s similar to the green field of 1990’s web, providing similar opportunities as then.

The birth of DApps

If people at all know about Ethereum, it is as Bitcoin’s first cousin that stands for everything experimental and of course Braendgaard, who is widely acclaimed as the old-guard programmer. The price of Ether, the coin underlying Ethereum, has spiked up by over a factor of 20 in the last 6 months. Unfortunately, on the zest to become rich quickly, many of us have overlooked Ethereum’s prominent significance. More than just being a new type of digital currency, Ethereum has developed into a new breed of distributed computer, which no one can control but can see inside out. Through this computer, a new creed of applications is launched -“DApps”.

Continue reading “Why Ethereum Is the Next Big Thing for Today’s Netizens?”

Data Science: Is It the Right Answer?

‘Big Data’, and then there is ‘Data Science’. These terms are found everywhere, but there is a constant issue lingering with their effectiveness. How effective is data science? Is Big Data an overhyped concept stealing the thunder?

Summing this up, Tim Harford stated in a leading financial magazine –“Big Data has arrived, but big insights have not.” Well, to be precise, Data Science nor Big Data are to be blamed for this, whereas the truth is there exists a lot of data around, but in different places. The aggregation of data is difficult and time-consuming.

Look for Data analyst course in Gurgaon at DexLab Analytics.

Statistically, Data science may be the next-big-thing, but it is yet to become mainstream. Though prognosticators predict 50% of organizations are going to use Data Science in 2017, more practical visionaries put the numbers closer to 15%. Big Data is hard, but it is Data Science that is even harder. Gartner reports, “Only 15% organizations are able to channelize Data Science to production.” – The reason being the gap existing between Data Science expectations and reality.

Big Data is relied upon so extensively that companies have started to expect more than it can actually deliver. Additionally, analytics-generated insights are easier to be replicated – of late, we studied a financial services company where we found a model based on Big Data technology only to learn later that the developers had already developed similar models for several other banks. It means, duplication is to be expected largely.

However, Big Data is the key to Data Science success. For years, the market remained exhilarated about Big Data. Yet, years after big data infused into Hadoop, Spark, etc., Data Science is nowhere near a 50% adoption rate. To get the best out of this revered technology, organizations need vast pools of data and not the latest algorithms. But the biggest reason for Big Data failure is that most of the companies cannot muster in the information they have, properly. They don’t know how to manage it, evaluate it in the exact ways that amplify their understanding, and bring in changes according to newer insights developed. Companies never automatically develop these competencies; they first need to know how to use the data in the correct manner in their mainframe systems, much the way he statisticians’ master arithmetic before they start on with algebra. So, unless and until a company learns to derive out the best from its data and analysis, Data Science has no role to play.

Even if companies manage to get past the above mentioned hurdles, they fail miserably in finding skillful data scientists, who are the right guys for the job in question. Veritable data scientists are rare to find these days. Several universities are found offering Data Science programs for the learners, but instead of focusing on the theoretical approach, Data Science is a more practical discipline. Classroom training is not what you should be looking for. Seek for a premier Data analyst training institute and grab the fundamentals of Data Science. DexLab Analytics is here with its amazing analyst courses in Delhi. Get enrolled today to outshine your peers and leave an imprint in the bigger Big Data community for long.


Interested in a career in Data Analyst?

To learn more about Data Analyst with Advanced excel course – Enrol Now.
To learn more about Data Analyst with R Course – Enrol Now.
To learn more about Big Data Course – Enrol Now.

To learn more about Machine Learning Using Python and Spark – Enrol Now.
To learn more about Data Analyst with SAS Course – Enrol Now.
To learn more about Data Analyst with Apache Spark Course – Enrol Now.
To learn more about Data Analyst with Market Risk Analytics and Modelling Course – Enrol Now.

Skills required during Interviews for a Data Scientist @ Facebook, Intel, Ebay. Square etc.

Skills required during Interviews for a Data Scientist @ Facebook, Intel, Ebay. Square etc.

Basic Programming Languages: You should know a statistical programming language, like R or Python (along with Numpy and Pandas Libraries), and a database querying language like SQL

Statistics: You should be able to explain phrases like null hypothesis, P-value, maximum likelihood estimators and confidence intervals. Statistics is important to crunch data and to pick out the most important figures out of a huge dataset. This is critical in the decision-making process and to design experiments.

Machine Learning: You should be able to explain K-nearest neighbors, random forests, and ensemble methods. These techniques typically are implemented in R or Python.  These algorithms show to employers that you have exposure to how data science can be used in more practical manners.

Data Wrangling: You should be able to clean up data. This basically means understanding that “California” and “CA” are the same thing – a negative number cannot exist in a dataset that describes population. It is all about identifying corrupt (or impure) data and and correcting/deleting them.

Data Visualization: Data scientist is useless on his or her own. They need to communicate their findings to Product Managers in order to make sure those data are manifesting into real applications. Thus, familiarity with data visualization tools like ggplot is very important (so you can SHOW data, not just talk about them)

Software Engineering: You should know algorithms and data structures, as they are often necessary in creating efficient algorithms for machine learning. Know the use cases and run time of these data structures: Queues, Arrays, Lists, Stacks, Trees, etc.

2

What they look for? @ Mu-Sigma, Fractal Analytics

    • Most of the analytics and data science companies, including third party analytics companies such as Mu-sigma and Fractal hire fresher’s in big numbers (some time in hundreds every year).
    • You see one of the main reasons why they are able to survive in this industry is the “Cost Arbitrage” benefit between the US and other developed countries vs India.
    • Generally speaking, they normally pay significantly lower for India talent in India compared to the same talent in the USA. Furthermore, hiring fresh talent from the campuses is one of the key strategies for them to maintain the low cost structure.
    • If they are visiting your campuses for interview process, you should apply. In case if they are not visiting your campus, drop your resume to them using their corporate email id that you can find on their websites.
    • Better will be to find someone in your network (such as seniors) who are working for these companies and ask them to refer you. This is normally the most effective approach after the campus placements.

Key Skills that look for are-

  • Love for numbers and quantitative stuff
  • Grit to keep on learning
  • Some programming experience (preferred)
  • Structured thinking approach
  • Passion for solving problems
  • Willingness to learn statistical concepts

Technical Skills

  • Math (e.g. linear algebra, calculus and probability)
  • Statistics (e.g. hypothesis testing and summary statistics)
  • Machine learning tools and techniques (e.g. k-nearest neighbors, random forests, ensemble methods, etc.)
  • Software engineering skills (e.g. distributed computing, algorithms and data structures)
  • Data mining
  • Data cleaning and munging
  • Data visualization (e.g. ggplot and d3.js) and reporting techniques
  • Unstructured data techniques
  • Python / R and/or SAS languages
  • SQL databases and database querying languages
  • Python (most common), C/C++ Java, Perl
  • Big data platforms like Hadoop, Hive & Pig

Business Skills

  • Analytic Problem-Solving: Approaching high-level challenges with a clear eye on what is important; employing the right approach/methods to make the maximum use of time and human resources.
  • Effective Communication: Detailing your techniques and discoveries to technical and non-technical audiences in a language they can understand.
  • Intellectual Curiosity: Exploring new territories and finding creative and unusual ways to solve problems.
  • Industry Knowledge: Understanding the way your chosen industryfunctions and how data are collected, analyzed and utilized.


Interested in a career in Data Analyst?

To learn more about Data Analyst with Advanced excel course – Enrol Now.
To learn more about Data Analyst with R Course – Enrol Now.
To learn more about Big Data Course – Enrol Now.

To learn more about Machine Learning Using Python and Spark – Enrol Now.
To learn more about Data Analyst with SAS Course – Enrol Now.
To learn more about Data Analyst with Apache Spark Course – Enrol Now.
To learn more about Data Analyst with Market Risk Analytics and Modelling Course – Enrol Now.

Drawing a Bigger Picture: FAQs about Data Analytics

Drawing a Bigger Picture: FAQs about Data Analytics

When the whole world is going crazy about business analytics, you might be sitting in a corner and wondering what does it all mean? With so many explanations, notions run a gamut of options.

It’s TIME to be acquainted with all the imperceptible jargons of data science; let’s get things moving with these elementary FAQs.

What is data analytics?

Data analytics is all about understanding the data and implementing the derived knowledge to direct actions. It is a technical way to transform raw data into meaningful information, which makes integral decision-making easier and effective. To perform data analytics, a handful number of statistical tools and software is used and et voila, you are right on your way to success!

How will analytics help businesses grow?

The rippling effects of data analytics are evident, from the moment you introduce it in your business network. And stop rattling! The effects are largely on the positive side, letting your business unravel opportunities, which it ignored before owing to lack of accurate analytical lens. By parsing latest trends, conventions and relationships within data, analytics help predict the future tendencies of the market.

Moreover, it throws light on these following questions:

  • What is going on and what will happen next?
  • Why is it happening?
  • What strategy would be the best to implement?

Also read: Tigers will be safe in the hands of Big Data Analytics

How do analytics projects look like?

A conventional analytics strategy is segregated into the following 4 steps:

Research – Analysts need to identify and get through the heart of the matter to help business address issues that it is facing now or will encounter in the future.

Plan – What type of data is used? What are the sources from where the data is to be secured? How the data is prepared for implementation? What are the methods used to analyse data? Professional analysts will assess the above-mentioned questions and find relevant solutions.

Execute – This is an important step, where analysts explores and analyses data from different perspectives.

Evaluate – In this stage, analysts evaluate the strategies and execute them.

How predictive modelling is implemented through business domains?

In business analytics, there are chiefly two models, descriptive and predictive. Descriptive models explain what has already happened and what is happening now, while Predictive models decipher what would happen along with stating the underlying reason.

Also read: Data Analytics for the Big Screen

One can now solve issues related to marketing, finance, human resource, operations and any other business operations without a hitch with predictive analytics modelling. By integrating past with present data, this strategy aims to anticipate the future before it arrives.

When should I deploy analytics in business?

An Intrinsic Revelation – Analytics is not a one-time event; it is a continuous process once undertaken. No one can say when will be the right time to introduce data analytics in your business. However, most of the businesses resort to analytics in their not-up-par days, when they face problems and lags behind in devising any possible solution.

5

So, now that you understand the data analytics sphere and the significance attached, take up business analytics training in Delhi. From a career perspective, the field of data science is burgeoning. DexLab Analytics is a premier data science training institute, headquartered in Gurgaon. Check out our services and get one for yourself!


Interested in a career in Data Analyst?

To learn more about Data Analyst with Advanced excel course – Enrol Now.
To learn more about Data Analyst with R Course – Enrol Now.
To learn more about Big Data Course – Enrol Now.

To learn more about Machine Learning Using Python and Spark – Enrol Now.
To learn more about Data Analyst with SAS Course – Enrol Now.
To learn more about Data Analyst with Apache Spark Course – Enrol Now.
To learn more about Data Analyst with Market Risk Analytics and Modelling Course – Enrol Now.

Sherlock Holmes Has Always Been a Data Analyst. Here’s Why

The job of a data analyst or scientist revolves around gathering a bunch of disorganized data, and then using them to build a case through deduction and logic. Finally, following that you will reach a conclusion after analysis.

Sherlock Holmes Has Always Been a Data Analyst. Here's Why

Below quote from Sherlock Holmes is relevant –

“When you have eliminated the impossible whatever remains, no matter how Improbable it is must be the truth.”​

tumblr_mdorpe1mnr1qf5zmno1_500

He always started each case by focusing on the problem.

The problem would sometimes arrive in the form of a letter, sometimes as an item in the newspaper, but most often, it would announce itself by a knock at the door. The client would then present the mystery to Holmes and he would probe the client for salient information. Holmes never relied on guesswork or on assumptions. For Holmes, each new case was unique, and what mattered were reliable and verifiable facts about the case. These gave the investigation an initial focus and direction.

Deduction, Reasoning & Analytics

It is a capital mistake to theorize before one has data. Insensibly one begins to twist facts to suit theories, instead of theories to suit facts.”

Similarly a data analyst is expected not to assume or formulate theories, which can make the reasoning biased. In his stories, Sherlock Holmes demonstrates his keen powers of observation and deduction from data in front of him. He can decipher how the light enters in Watson’s bathroom based on how his beard is shaved; he attests one person has lived in China from one of his tattoos; he discovers previous financial situation of a man who he had never seen before just looking to the hat the man had just used.

1

A data scientist has powerful computational and statistics tools that help him finding patterns amid so much data.


In the end, a data analyst’s introduction can be similar to what Sherlock said:

My name is Sherlock Holmes. It is my business to know what other people do not

know.

Team Cosmos

You can learn more about Data analysis by taking up Data analyst certification courses. DexLab Analytics also offers Business analyst training courses.


Interested in a career in Data Analyst?

To learn more about Machine Learning Using Python and Spark – click here.
To learn more about Data Analyst with Advanced excel course – click here.
To learn more about Data Analyst with SAS Course – click here.
To learn more about Data Analyst with R Course – click here.
To learn more about Big Data Course – click here.

Call us to know more