Data analyst course in Gurgaon Archives - Page 2 of 9 - DexLab Analytics | Big Data Hadoop SAS R Analytics Predictive Modeling & Excel VBA

A Deep Dive Into The US Healthcare System in New York

A Deep Dive Into The US Healthcare System in New York

Unlike India’s healthcare system wherein both public and private entities deliver healthcare facilities to citizens, in the US, the healthcare sector is completely privatised.

The aim of this notebook is to study some of the numerical data we have for the US and especially data for New York. Most of us know about New York’s situation that is one of the worst in the world.

Therefore, analysing data may clarify a few things. We will be using three sets of data – urgent care facilities, US county healthcare rankings 2020 and Covid sources for counties.

For the data and codesheet click below.


Now pick key column names for your study with ‘.keys’ as the function name. We are interested in a few variables from health rankings so we take only the ones we think will be useful in a new data frame.

We will study each data set one by one so that we can get an understanding of the data before combining them. For this we call the plotly library that has very interactive graphs. We use the choropleth to generate a heat map over the country in question.

Fig. 1.

It is clear form the heat map that New York has a very high incidence of infections vis a vis other states. We then begin working with data on the number of ICU beds in each state. Since each state will have different populations, we cannot compare the absolute number of ICU beds. We need the ratio of ICU beds per a given number of inhabitants.

Fig. 2.

The generated heat map (Fig. 2.) shows the ICU density per state in the US. For more on this do watch the complete video tutorial attached herewith.

This tutorial was brought to you by DexLab Analytics. DexLab Analytics is a premiere data analyst training institute in Gurgaon.


.

Covid-19 – Key Insights through Exploration of Data (Part – II)

Covid-19 - Key Insights through Exploration of Data (Part - II)

This video tutorial is on exploratory data analysis. The data is on COVID-19 cases and it has been taken from Kaggle. This tutorial is based on simple visualization of COVID-19 cases.

For code sheet and data click below.


Firstly, we must call whatever libraries we need in Python. Then we must import the data we will be working on onto our platform.

Now, we must explore PANDAS. For this it is important to know that there are three types of data structures – Series, Data Frame and Panel Data. In our tutorial we will be using data frames. 

Fig. 1.

Fig. 1

Now we will plot the data we have onto a graph. When we run the program, we get a graph that shows total hospital beds, potentially available hospital beds and available hospital beds.

Fig. 2.

Fig. 2

While visualizing data we must remember to keep the data as simple as possible and not make it complex. If there are too many data columns the interpretation will be a very complex one, something we do not want.

Fig. 3.

Fig. 3

A scatter plot (Fig. 3.) is also generated to show the reading of the data available.  We study the behaviour of the data on the plot.

For more on this, view the video attached herewith. And practise more and more with data from Kaggle. This tutorial was brought to you by DexLab Analytics. DexLab Analytics is a premiere data analyst training institute in Gurgaon.


.

How Company Leaders and Data Scientists Work Together

How Company Leaders and Data Scientists Work Together

Business leaders across platforms are hungrily eyeing data-driven decision making for its ability to transform businesses. But what needs to be taken into account is the opinion of data scientists in the core company teams for they are the experts in the field and whatever they have to say regarding data driven decisions should be the final word in these matters.

“The ideal scenario is all parties in complete alignment. This can be envisioned as a perfect rectangle, with business leaders’ expectations at the top, fully supported by a foundation of data science capabilities — for example, when data science and AI can achieve management’s goal of reducing customer retention costs by automating identification and outreach to at-risk customers,”says a report.

The much sought after rectangle, however, is rarely achieved. “A more workable shape is the rhombus, depicting the push-and-pull of expectations and deliverables.”

Using the power of your company’s data.

Business leaders must have patience with developments on the part of data scientists for what they expect is usually not in sync with the deliverables on the ground.

“Over the last few years, an automaker, for example, dove into data science on leadership’s blind faith that analytics could revolutionize the driver experience. After much trial and error, the results fell far short of adding anything meaningful to what drivers found valuable behind the wheel of a car.”

Appreciate Small Improvements

Also, what must be appreciated are small improvements made impactful. For instance, “slight increases in profitability per customer or conversion rates” are things that should be taken into account despite the fact that they might be modest gains in comparison to what business leaders had invested in analytics. “Applied over a large population of customers, however, those small improvements can yield big results. Moreover, these improvements can lead to gains elsewhere, such as eliminating ineffective business initiatives.”

Healthy Competition

However, it is advisable for business leaders to constantly push their data scientists to strive for more deliverables and improve their tally with a framework of healthy competition in place. In fact, big companies form data science centers of excellence, “while also creating a healthy competitive atmosphere that encourages data scientists to push each other to find the best tools, strategies, and techniques for solving problems and implementing solutions.”

Data Science Machine Learning Certification

Here are three ways to inspire data scientists

  1. Both sides must work togetherTake the example of a data science team with expertise in building models to improve customers’ shopping experiences. “Business leaders might assume that a natural next step is to use AI to enhance all customer service needs.”However, AI and machine learning cannot answer the ‘why’ or ‘how’ of the data insights. Human beings have to delve into those aspects by studying the AI output. And on the other hand, data scientists also must understand why business leaders expect so much from them and how to achieve a middle path with regard to expectations and deliverables.
  2. Gain from past successes and achievements – “There is value in small data projects to build capabilities and understanding and to help foster a data-driven culture.”The best policy for firms to follow is to initially keep modest expectations. After executing and implementing the analytics projects, they should conduct a brutally honest anatomy of the successes and failures, and then build business expectations at the same time as analytics investment.
  3. Let data scientists spell out the delivery of analytics results “Communication around what is reasonable and deliverable given current capabilities must come from the data scientists — not the frontline marketing person in an agency or the business unit leader.” Before signing any contract or deal with a client, it is advisable to allow the client to have a discussion with the data scientists so that there is no conflict of ideas between what the data science team spells out and what the marketing team has in mind. For this, data scientists will have to work on their soft skills and improve their ability to “speak business” regarding specific projects.


.

Statistical Application in R & Python: EXPONENTIAL DISTRIBUTION

Statistical Application in R & Python: EXPONENTIAL DISTRIBUTIONStatistical Application in R & Python: EXPONENTIAL DISTRIBUTION

In this blog, we will explore the Exponential distribution. We will begin by questioning the “why” behind the exponential distribution instead of just looking at its PDF formula to calculate probabilities. If we can understand the “why” behind every distribution, we will have a head start in figuring out its practical uses in our everyday business situations.

Much could be said about the Exponential distribution. It is an important distribution used quite frequently in data science and analytics. Besides, it is also a continuous distribution with one parameter “λ” (Lambda). Lambda as a parameter in the case of the exponential distribution represents the “rate of something”. Essentially, the exponential distribution is used to model the decay rate of something or “waiting times”.

Data Science Machine Learning Certification

For instance, you might be interested in predicting answers to the below-mentioned situations:

  • The amount of time until the customer finishes browsing and actually purchases something in your store (success).
  • The amount of time until the hardware on AWS EC2 fails (failure).
  • The amount of time you need to wait until the bus arrives (arrival).

In all of the above cases if we can estimate a robust value for the parameter lambda, then we can make the predictions using the probability density function for the distribution given below:

Application:-

Assume that a telemarketer spends on “average” roughly 5 minutes on a call. Imagine they are on a call right now. You are asked to find out the probability that this particular call will last for 3 minutes or less.


Below we have illustrated how to calculate this probability using Python and R.

Calculate Exponential Distribution in R:

In R we calculate exponential distribution and get the probability of mean call time of the tele-caller will be less than 3 minutes instead of 5 minutes for one call is 45.11%.This is to say that there is a fairly good chance for the call to end before it hits the 3 minute mark.

Calculate Exponential Distribution in Python:

We get the same result using Python.

Conclusion:

We use exponential distribution to predict the amount of waiting time until the next event (i.e., success, failure, arrival, etc).

Here we try to predict that the probability of the mean call time of the telemarketer will be less than 3 minutes instead of 5 minutes for one call, with the help of Exponential Distribution. Similarly, the exponential distribution is of particular relevance when faced with business problems that involve the continuous rate of decay of something. For instance, when attempting to model the rate with which the batteries will run out. 

Data Science & Machine Learning Certification

Hopefully, this blog has enabled you to gather a better understanding of the exponential distribution. For more such interesting blogs and useful insights into the technologies of the age, check out the best Analytics Training institute Gurgaon, with extensive Data Science Courses in Gurgaon and Data analyst course in Delhi NCR.

Lastly, let us know your opinions about this blog through your comments below and we will meet you with another blog in our series on data science blogs soon.


Interested in a career in Data Analyst?

To learn more about Data Analyst with Advanced excel course – Enrol Now.
To learn more about Data Analyst with R Course – Enrol Now.
To learn more about Big Data Course – Enrol Now.

To learn more about Machine Learning Using Python and Spark – Enrol Now.
To learn more about Data Analyst with SAS Course – Enrol Now.
To learn more about Data Analyst with Apache Spark Course – Enrol Now.
To learn more about Data Analyst with Market Risk Analytics and Modelling Course – Enrol Now.

How to Start a Successful Data Science Career?

How to Start a Successful Data Science Career?

The most common question we come across in DexLab Analytics HQ is how to take a step into the world of analytics and data science. Of course, grabbing a data science job isn’t easy, especially when there is so much hype going around. This is why we have put together top 5 ways to bag the hottest job in town. Follow these points and swerve towards your dream career.

Deep Learning and AI using Python

Enhance Your Skills

At present, LinkedIn in the US alone have 24,697 vacant data scientist positions. Python, SQL and R are the most common skills in demand followed by Tensorflow, Jupyter Notebooks and AWS. Gaining statistical literacy is the best way to grab these hot positions but for that, you need hands-on training from an expert institute.

If interested, you can check out analytics courses in Delhi NCR delivered by DexLab Analytics. They can help you stay ahead of the curve.

Create an Interesting Portfolio

A portfolio filled with machine learning projects is the best bet. Companies look for candidates who have prior work experience or are involved in data science projects. Your portfolio is the potential proof that you are capable enough to be hired. Thus, make it as attractive as possible.

Include projects that qualify you to be a successful data scientist. We would recommend including a programming language of your choice, your data visualization skill and your ability to employ SQL.

Get Yourself a Website

Want to standout from the rest? Build up your website, create a strong online presence and continuously add and update your Kaggle and GitHub profile to exhibit your skills and command over the language. Profile showcasing is of utmost importance to get recognized by the recruiters. A strong online presence will not only help you fetch the best jobs but also garner the attention of the leads of various freelance projects.

Be Confident and Apply for Jobs You Are Interested In

It doesn’t matter if you possess the skills or meet the job requirements mentioned on the post, don’t stop applying for the jobs that interest you. You might not know every skill given on a job description. Follow a general rule, if you qualify even half of the skills, you should apply.

However, while job hunting, make sure you contact recruiters, well-versed in data science and boost your networking skills. We would recommend you visit career fairs, approach family, friends or colleagues and scroll through company websites. These are the best ways to look for data science jobs. 

2

Improve Your Communication Skills

One of the key skills of data scientists is to communicate insights to different users and stakeholders. Since data science projects run across numerous teams and insights are often shared across a large domain, hence superior communication skill is an absolute must-have.

Want more information on how to become a data scientist? Follow DexLab Analytics. We are a leading data analyst training institute in Delhi offering in-demand skill training courses at affordable prices.


The blog has been sourced fromwww.forbes.com/sites/louiscolumbus/2019/04/14/how-to-get-your-data-scientist-career-started/#67fdbc0e7e5c


Interested in a career in Data Analyst?

To learn more about Data Analyst with Advanced excel course – Enrol Now.
To learn more about Data Analyst with R Course – Enrol Now.
To learn more about Big Data Course – Enrol Now.

To learn more about Machine Learning Using Python and Spark – Enrol Now.
To learn more about Data Analyst with SAS Course – Enrol Now.
To learn more about Data Analyst with Apache Spark Course – Enrol Now.
To learn more about Data Analyst with Market Risk Analytics and Modelling Course – Enrol Now.

The Rising Popularity of Python in Data Science

The Rising Popularity of Python in Data Science

Python is the preferred programming language for data scientists. They need an easy-to-use language that has decent library availability and great community participation. Projects that have inactive communities are usually less likely to maintain or update their platforms, which is not the case with Python.

What exactly makes Python so ideal for data science? We have examined why Python is so prevalent in the booming data science industry — and how you can use it for in your big data and machine learning projects.

Deep Learning and AI using Python

Why Python is Dominating?

Python has long been known as a simple programming language to pick up, from a syntax point of view, anyway. Python also has an active community with a vast selection of libraries and resources. The result? You have a programming platform that makes sense of how to use emerging technologies like machine learning and data science.

Professionals working with data science applications don’t want to be bogged down with complicated programming requirements. They want to use programming languages like Python and Ruby to perform tasks in a hassle-free way.

Ruby is excellent for performing tasks such as data cleaning and data wrangling, along with other data pre-processing tasks. However, it doesn’t feature as many machine learning libraries as Python. This gives Python the edge when it comes to data science and machine learning.

Python also enables developers to roll out programs and get prototypes running, making the development process much faster. Once a project is on its way to becoming an analytical tool or application, it can be ported to more sophisticated languages such as Java or C, if necessary.

Newer data scientists gravitate toward Python because of its ease of use, which makes it accessible.

Why Python is Ideal for Data Science?

Data science involves extrapolating useful information from massive stores of statistics, registers, and data. These data are usually unsorted and difficult to correlate with any meaningful accuracy. Machine learning can make connections between disparate datasets but requires serious computational sophistry and power.

Python fills this need by being a general-purpose programming language. It allows you to create CSV output for easy data reading in a spreadsheet. Alternatively, more complicated file outputs that can be ingested by machine learning clusters for computation.

2

Consider the Following Example:

Weather forecasts rely on past readings from a century’s worth of weather records. Machine learning can help make more accurate predictive models based on past weather events. Python can do this because it is lightweight and efficient at executing code, but it is also multi-functional. Also, Python can support object-orientated and functional styles, meaning it can find an application anywhere.

There are now over 70,000 libraries in the Python Package Index, and that number continues to grow. As previously mentioned, Python offers many libraries geared toward data science. A simple Google search reveals plenty of Top 10 Python libraries for data science lists. Arguably, the most popular data analysis library is an open-source library called pandas. It is a high-performance set of applications that make data analysis in Python a much simpler task.

No matter what data scientists are looking to do with Python, be it predictive causal analytics or prescriptive analytics, Python has the toolset to perform a variety of powerful functions. It’s no wonder why data scientists embrace Python.

If you are interested in Python Certification Training in Delhi, drop by DexLab Analytics. With a team of expert consultants, we provide state-of-the-art Machine Learning Using Python training courses for aspiring candidates. Check out our course itinerary for more information.


Interested in a career in Data Analyst?

To learn more about Data Analyst with Advanced excel course – Enrol Now.
To learn more about Data Analyst with R Course – Enrol Now.
To learn more about Big Data Course – Enrol Now.

To learn more about Machine Learning Using Python and Spark – Enrol Now.
To learn more about Data Analyst with SAS Course – Enrol Now.
To learn more about Data Analyst with Apache Spark Course – Enrol Now.
To learn more about Data Analyst with Market Risk Analytics and Modelling Course – Enrol Now.

Basics of a Two-Variable Regression Model: Explained

Basics of a Two-Variable Regression Model: Explained

In continuation of the previous Regression blog, here we are back again to discuss the basics of a two-variable regression model. To read the first blog from the Regression series, click here www.dexlabanalytics.com/blog/a-regression-line-is-the-best-fit-for-the-given-prf-if-the-parameters-are-ols-estimations-elucidate.

In Data Science, regression models are the major driver to interpret the model with necessary statistical methods, practically as well as theoretically. One, who works extensively with business data metrics, will be able to solve various tough problems with the help of a regression theory. The key insight of the regression models lies in interpreting the fitness of the models. But it differs from the standard machine learning techniques such that, for improvement in the performance of the model being predicted, the major interpretable coefficients are never sacrificed. Thus, a sense in regression models can be considered as the most important tool to be chosen for solving any practical problem.

2

Let’s consider a simple example to understand regression analysis from scratch. Say, we want to predict the sales of a Softlines eCommerce company for this year during the festivals of Diwali. There are a lot of factors to generate impacts on the sales value, as there are hundreds of factors persisting within the model. We can consider our own judgement to get the impacting factors. Now, here in our model, the value of sales that we want to predict is the dependent variable, whereas the impacting factors are considered as the independent variables. To analyse this model in terms of regression, we need to gather all the information about the independent variables from the past few years, and then act on it according to the regression theory.

Before getting into the core theory, there are some basic assumptions for such a two-variable regression model and they are as follows:

  • Variables are linearly related: The variables in a 2-variable Regression Model are linearly related, the linearity being in parameters, though not always in variables, i.e. the power in which the parameters appear should be of 1 only and should not be multiplied or divided by any other parameters. These linearly related variables are basically of two types (i) independent or explanatory variables & (ii) dependent or response variables.
  • Variables can be represented graphically: The idea behind this assumption guarantees that observations must be real numbers represented on graph papers.
  • Residual term and the estimated value of the variables are uncorrelated.
  • Residual terms and explanatory variables are uncorrelated.
  • Error variables are uncorrelated with mean 0 & common variance σ2

Deep Learning and AI using Python

Now, how can a PRF for expanding an economic relationship between 2 variables be specified?

Well, Population regression function, or more generally, the population regression curve, is defined as the locus of the conditional means of the dependent variables, for a fixed value of the explanatory variables. More simply, it is the curve connecting the means of the sub-populations of Y corresponding to the given values of the regressor X.

Formally, a PRF is the locus of all conditional means of the dependent variables for a given value of the explanatory variables. Thus; the PRF as economic theory would suggest would be:

Where 9(X) is expected to be an increasing function of X, if the conditional expectation is linear in X. then

Hence, for any ith observations:

However, the actual observation for the dependent variable is Yi. Therefore; Yi – E(Y/Xi) = ui, which is the disturbance term or the stochastic term of the Regression Model.

Thus,

…………………… (A)

  • is the population regression function and this form of specifying the population regression function is called the stochastic specification of the PRF.

Stochastic Specification of the Model:

Yi = α + βXi + ui is referred to as the stochastic specification of the Population Regression Function, where ui is the stochastic or the random disturbance term. It explains everything’s net influence other than X variable on the ith observation. Thus, ui is a surrogate or proxy for all omitted or neglected variables which may affect Y but is not included in the model. The random disturbance term is incorporated into the model with the following assumptions:-

Proof:

Taking conditional expectation as both sides, we get:

Hence; E(ui) = 0

cov(ui,uj) = E(ui uj ) = 0 ∀ i ≠ j i.e. the disturbance terms are distributed independently of each other.

Proof:

Two variables are said to be independently distributed, or stochastically independent; if the conditional distributions are equal to the corresponding marginal distributions.

Hence; cov(ui,uj )= E(ui uj ) = 0 Thus, no auto correction is present among ui,s i.e. ui,s. s are identically and independently distributed Random Variables. Hence, ui,s are all Random Samples.

Proof:

The conditional variance between two error terms can be given as given independence &


All these assumptions can be embodied in the simple statement: ui~N(0,σ2) where ui,s are iid’s ∀ I, Which heads “the ui are independently distributed identically distributed with mean 0 & variance σ2”.

Last Notes

The benefits of regression analysis are immense. Today’s business houses literally thrive on such analysis. For more information, follow us at DexLab Analytics. We are a leading data science training institute headquartered in Delhi NCR and our team of experts take pride in crafting the most insight-rich blogs. Currently, we are working on Regression Analysis. More blogs are to be followed on this model. Keep watching!


Interested in a career in Data Analyst?

To learn more about Data Analyst with Advanced excel course – Enrol Now.
To learn more about Data Analyst with R Course – Enrol Now.
To learn more about Big Data Course – Enrol Now.

To learn more about Machine Learning Using Python and Spark – Enrol Now.
To learn more about Data Analyst with SAS Course – Enrol Now.
To learn more about Data Analyst with Apache Spark Course – Enrol Now.
To learn more about Data Analyst with Market Risk Analytics and Modelling Course – Enrol Now.

A Regression Line Is the Best Fit for the Given PRF If the Parameters Are OLS Estimations – Elucidate

A Regression Line Is the Best Fit for the Given PRF If the Parameters Are OLS Estimations - Elucidate

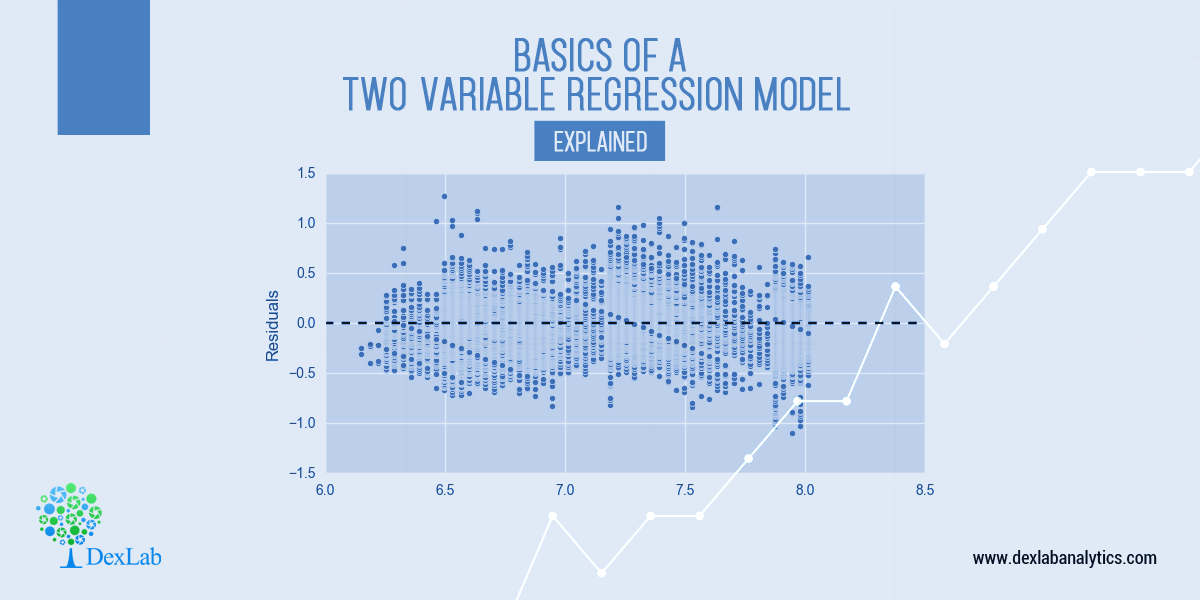
Regression analysis is extensively used in business applications. It’s one of the most integral statistical techniques that help in estimating the direction and strength between two or more (financial) variables – thus determining a company’s sales and profits over the past few years.

In this blog, we have explained how a regression line is the best fit for a given PRF if the parameters are all OLS estimations.

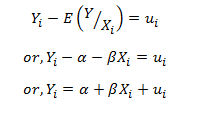
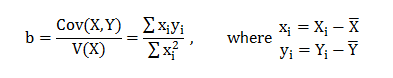
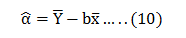
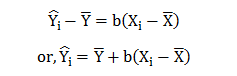
The OLS estimators for a given regression line has been obtained as: a = y ̅ – bx ̅ and b = (Cov(x,y))/(v(x)). The regression line on the basis of these OLS estimate has been given as: Y ̂_ i-Y ̅ = b(x_i-x ̅ )….. (1)

The regression line (1) constructed above is a function of the least square i.e. the parameters of the regression equation have been selected so that the residual sum of squares is minimized. Thus, the estimators ‘a’ & ‘b’ explains the population parameters, the best relative to any other parameters. Given, the linearity of the parameters, these estimators share the minimum variations with the population parameters, i.e. they explain the maximum variations in the model, in relation to the population parameters, as compared to any other estimators, in a class of unbiased estimators.

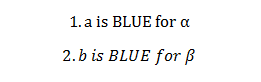
Thus, the regression line would be the ‘best fit’ for a given PRF. If ‘a’ & ‘b’ are best linear unbiased estimators for  respectively. Thus, to show ‘best fit’, we need to prove:

  1. To ‘b’ is Best unbiased estimator for :-

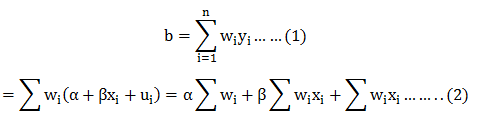
From the OLS estimation; we have ‘b’ as:

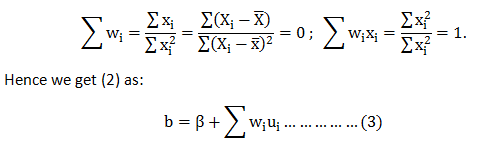
i.e.b is a linear combination of w’is & y’is.

Hence; ‘b’ is a linear estimator for β. Therefore, the regression line would be linear in parameters as far as ‘b’ is concerned.
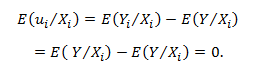
Now,

Let us test for the prevalence of this conditions:

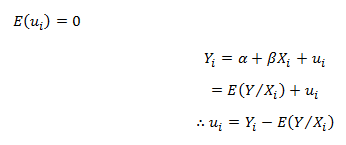
For unbiasedness, we must have :- E(b)=β. To test this, we take expectation on both sides of (3) & get:

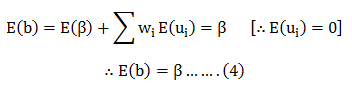
From (1) & (4) we can say that ‘b’ is a linear unbiased estimator for β.

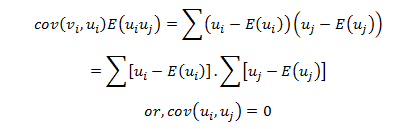
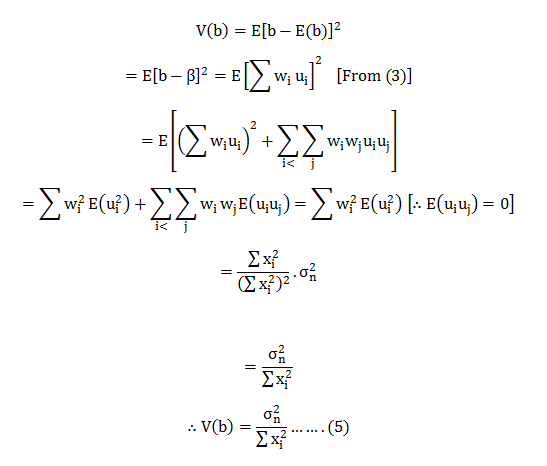
To check whether ‘b’ is the best estimator or not we need to check whether it has the minimum variance in a class of linear unbiased estimator.

Thus, we need to calculate the variance for ‘b’ & show that it is the minimum in a class of unbiased estimations. But, first, we need to calculate the variance for ‘b’.

Now; we need to construct another linear unbiased estimator and find its variance.

Let another estimator be: b^*=∑ci yi….(6)  For unbiasedness ∑ci =0,∑cixi =1.

Now; from (6) we get:

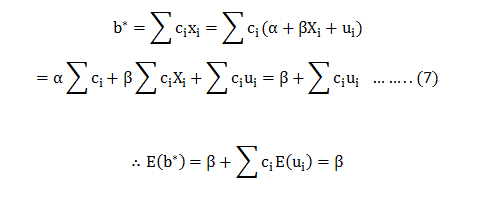
∴b* is an unbiased estimator for  Now; the variance for  can be calculated as:-

Now;

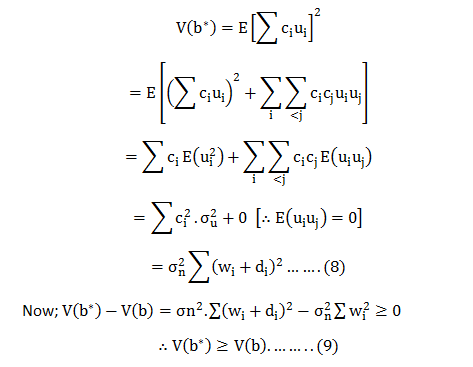
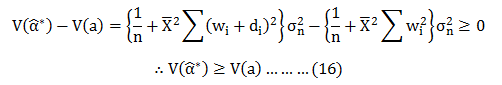
Hence; from (9) we can say V(b) is the least among a class of unbiasedness estimators.

Therefore, ‘b’ is the best linear unbiased estimator for  in a class of linear unbiased estimators.

2

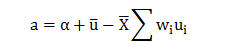
  1. To prove ‘a’ is the best linear unbiased estimator for α:-

Form the OLS estimation we have ‘a’ as:-

Here; ‘b’ is a function of Y and Y is a linear function of X(orUi).

‘a’ is also a linear function of Y. i.e. has linearity.

There, ‘a’ is a linear estimator for   ……. (11)

Now, for ‘a’ to be an unbiased estimator; we must have From (10) we have:-

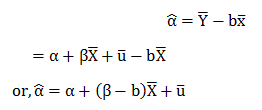
Taking expectations on both sides of the equation; we get:

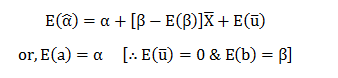
Therefore, ‘a’ is an unbiased estimator for  ……… (12)

From (11) & (12) ‘a’ is a linear unbiased estimator for

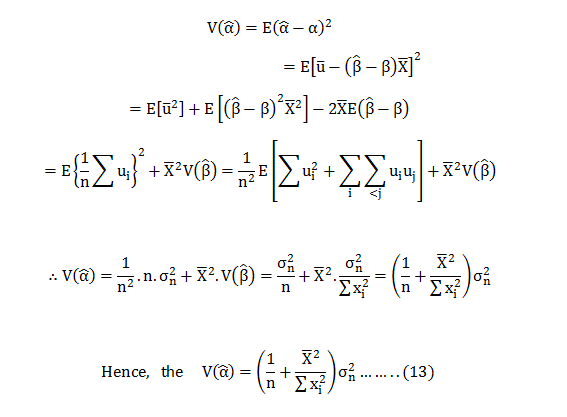
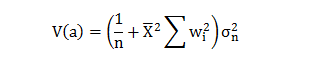
Now, if ‘a’ is to be the best estimator for then is most have the minimum variance. Thus; we first need to calculate the variance of ‘a’.

Now, 

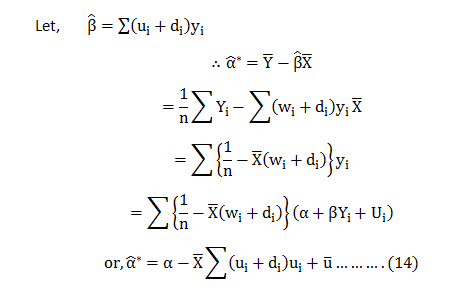
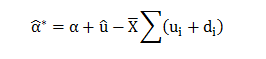
Now; let us consider an estimator in the class of linear unbiased estimator.

Further we know,

Now;

Hence;

Now;

Therefore;

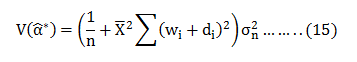
Hence; from (16) we can say that is the Min Variance Unbiased estimator in a class of unbiased estimator.

Hence; we can now safely conclude that a regression line composed of OLS estimators is the ‘best fit’ line for a given PRF, compared to any other estimator.

Thus, the best-fit regression line can be depicted as

Thus, a regression line is the best fit for a given PRF if the estimators are OLS.

End Notes

The beauty and efficiency of Regression method of forecasting never fail to amaze us. The way it crunches the data to help make better decisions and improve the current position of the business is incredible. If you are interested in the same, follow us at DexLab Analytics. A continues blog series on regression model and analysis is upcoming. Watch this space for more.

DexLab Analytics offers premium data science courses in Gurgaon crafted by the experts. After thorough research, each course is prepared keeping student’s needs and industry demands in mind. You can check out our course offerings here.


Interested in a career in Data Analyst?

To learn more about Data Analyst with Advanced excel course – Enrol Now.
To learn more about Data Analyst with R Course – Enrol Now.
To learn more about Big Data Course – Enrol Now.

To learn more about Machine Learning Using Python and Spark – Enrol Now.
To learn more about Data Analyst with SAS Course – Enrol Now.
To learn more about Data Analyst with Apache Spark Course – Enrol Now.
To learn more about Data Analyst with Market Risk Analytics and Modelling Course – Enrol Now.

Demand for Data Analysts is Skyrocketing – Explained

Demand for Data Analysts is Skyrocketing - Explained

The salary of analytics professionals outnumbers that of software engineers by more than 26%. The wave of big data analytics is taking the world by storm. If you follow the latest studies, you will discover that there has been a prominent growth in median salary over several experience levels in the past three years (2016 to 2018). In 2019, the average analytics salary has been capped at 12.6 lakh per annum.

The key takeaway is that the salary structure of analytics professionals continues to beat other tech-related job roles. In fact, data analysts are found out-earning their Java correspondents by nearly 50% in India alone. A latest survey provides an encompassing view of base and compensation salaries in data science along with median salaries followed across diverse job categories, regions, education profiles, experience, tools and skills.

In this regard, a spokesperson of a prominent data analytics learning institute was found saying, “The demand for AI skills is expected to increase rapidly, which is also reflected by the fact that AI engineers command a higher salary than peers.” She further added, “Many of our clients have realized that investing in data-driven skills at the leadership level is a determining factor for the success of digital and AI initiatives in the organization. With the increasing adoption of digital technologies, we expect an enduring growth of Data Science and AI initiatives to offer exciting and lucrative career options to new age professionals,”

Over time, we are witnessing how markets are evolving while the demand for skilled data scientists is following an upward trend. It is not only the technology firms that are posting job offers, but the change is also evident across industries, like retail, medical, retail and CPG amongst others. These sectors are enhancing their analytical capabilities implying an automatic increase in the number of data-centric jobs and recruitment of data scientists.

Points to Consider:

  • In the beginning, nearly 76% of data analysts earn 6-lakh figure per annum.
  • The average analytics salary observed in 2018-19 is 12.6 lakh.
  • In terms of analytics career, Mumbai offers the highest compensation of 13.7 lakh yearly, followed by Bangalore at 13 lakh.
  • Mid-level professionals proficient in data analytics are more in demand.
  • Knowing Python is an added advantage; Python Programming training will help you earn more. Expect a package of 15.1 lakh.
  • Nevertheless, we often see a pay disparity for female data scientists against their male counterparts. While women’s take-home salary is 9.2 lakh, male from the same designation and profession earns 13.7 lakh per annum.

2

As endnotes, the demand for data science skills is skyrocketing. If you want to enter into this flourishing job market, this is the best time! Enroll in a good data analyst course in Delhi and mould your career in the shape of success! DexLab Analytics is a top-notch data analyst training institute that offers a plethora of in-demand skill training courses. Reach us for more.


This article has been sourced fromwww.tribuneindia.com/news/jobs-careers/data-analytics-professionals-ride-the-big-data-wave/759602.html


Interested in a career in Data Analyst?

To learn more about Data Analyst with Advanced excel course – Enrol Now.
To learn more about Data Analyst with R Course – Enrol Now.
To learn more about Big Data Course – Enrol Now.

To learn more about Machine Learning Using Python and Spark – Enrol Now.
To learn more about Data Analyst with SAS Course – Enrol Now.
To learn more about Data Analyst with Apache Spark Course – Enrol Now.
To learn more about Data Analyst with Market Risk Analytics and Modelling Course – Enrol Now.

Call us to know more