Data analyst certification Archives - Page 2 of 4 - DexLab Analytics | Big Data Hadoop SAS R Analytics Predictive Modeling & Excel VBA

Here’s How Technology Made Education More Enjoyable and Interactive

Here’s How Technology Made Education More Enjoyable and Interactive

Technology is revamping education. The entire education system has undergone a massive change, thanks to technological advancement. The institutions are setting new goals and achieving their targets more effectively with the help of new tools and practices. These cutting edge methods not only enhances the learning approach, but also results in better interaction and fuller participation between teachers and students.

The tools of technology have turned students into active learners; they are now more engaged with their subjects. In fact, they even discover solutions to the problems on their own. The traditional lectures are now mixed with engaging illustrations and demonstrations, and classrooms are replaced with interactive sessions in which students and teachers both participate equally.

Let’s take a look at how technology has changed the classroom learning experience:

Online Classes

No longer, students have to sit through a classroom all day. If a student is interested in a particular course or subject, he or she can easily pursue degrees online without going anywhere. The internet has made interactions between students and teachers extremely easy. From the comfort of the home, anyone can learn anything.

DexLab Analytics offers Data Science Courses in Noida. Their online and classroom training is over the top.

Free educational resources found online

The internet is full of information. From a vast array of blogs, website content and applications, students as well as teachers can learn anything they desire to. Online study materials coupled with classroom learning help the students in strengthening their base on any subject as they get to learn concepts from different sources with examples and practice enough problems. This explains why students are so crazy for the internet!

2

Webinars and video streaming

The facilitators and educationists are nowadays looking up to video streaming to communicate ideas and knowledge to the students. Videos are anytime more helpful than other digital communications; they help deliver the needful content, boosting the learning abilities among the learners, while making them understand the subject matter to the core. Webinars (seminars over the web) replaces classroom seminars; teachers look up to new methods of video conferencing for smoother interaction with the students.

Podcasts

Podcasts are digital audio files. Users can easily download them. They are available over the internet for a bare subscription fee. It’s no big deal to create podcasts. Teachers can easily create podcasts that syncs well with students’ demand, thus paving a way for them to learn more efficiently. In short, podcasts allow students a certain flexibility to learn from anywhere, anytime.

Laptops, smartphones and tablets

For a better learning experience overall, both students and teachers are looking forward to better software and technology facilities. A wide number of web and mobile applications are now available for students to explore the wide horizon of education. The conventional paper notes are now replaced with e-notes that are uploaded on the internet and can be accessible from anywhere. Laptops and tablets are also used to manage course materials, research, schedules and presentations.

No second thoughts, by integrating technology with classroom training, students and teachers have an entire world to themselves. Sans the geographical limitations, they can now explore the bounties of new learning methods that are more fun and highly interactive.

DexLab Analytics appreciates the power of technology, and in accordance, have curated state of the art Data Science Courses that can be accessed both online and offline for students’ benefit. Check out the courses NOW!


The article has been sourced from – http://www.iamwire.com/2017/08/technology-teaching-education/156418


Interested in a career in Data Analyst?

To learn more about Data Analyst with Advanced excel course – Enrol Now.
To learn more about Data Analyst with R Course – Enrol Now.
To learn more about Big Data Course – Enrol Now.

To learn more about Machine Learning Using Python and Spark – Enrol Now.
To learn more about Data Analyst with SAS Course – Enrol Now.
To learn more about Data Analyst with Apache Spark Course – Enrol Now.
To learn more about Data Analyst with Market Risk Analytics and Modelling Course – Enrol Now.

Microsoft Introduces FPGA Technology atop Google Chips through Project Brainwave

Microsoft Introduces FPGA Technology atop Google Chips through Project Brainwave

A Change Is In the Make – due to increasing competition among tech companies working on AI, several software makers are inventing their own new hardware. A few Google servers also include chips designed for machine learning, known as TPUs exclusively developed in-house to ensure higher power and better efficiency. Google rents them out to its cloud-computing consumers. Of late, Facebook too shared its interest in designing similar chips for its own data centers.

However, a big player in AI world, Microsoft is skeptical if the money spent is for good – it says the technology of machine learning is transforming so rapidly that it makes little sense to spend millions of dollars into developing silicon chips, which could soon become obsolete. Instead, Microsoft professionals are pitching for the idea of implementing AI-inspired projects, named FPGAs, which can be re-modified or reprogrammed to support latest forms of software developments in the technology domain.  The company is buying FPGAs from chip mogul, Intel, and already a few companies have started buying this very idea of Microsoft.

This week, Microsoft is back in action with the launch of a new cloud service for image-recognition projects, known as Project Brainwave. Powered by the very FPGA technology, it’s one of the first applications that Nestle health division is set to use to analyze the acuteness of acne, from images submitted by the patients. The specialty of Project Brainwave is the manner in which the images are processed – the process is quick as well as very low in cost than other graphic chip technologies used today.

It’s been said, customers using Project Brainwave are able to process a million images in just 1.8 milliseconds using a normal image recognition model for a mere 21 cents. Yes! You heard it right. Even the company claims that it performs better than it’s tailing rivals in cloud service, but unless the outsiders get a chance to test the new technology head-to-head against the other options, nothing concrete can be said about Microsoft’s technology. The biggest competitors of Microsoft in cloud-service platform include Google’s TPUs and graphic chips from Nvidia.

Let’s Take Your Data Dreams to the Next Level

At this stage, it’s also unclear how widely Brainwave is applicable in reality – FPGAs are yet to be used in cloud computing on a wide scale, hence most companies lack the expertise to program them. On the other hand, Nvidia is not sitting quietly while its contemporaries are break opening newer ideas in machine learning domain. The recent upgrades from the company lead us to a whole new world of specialized AI chips that would be more powerful than former graphic chips.

Latest reports also confirm that Google’s TPUs exhibited similar robust performance similar to Nvidia’s cutting edge chips for image recognition task, backed by cost benefits. The software running on TPUs is both faster and cheaper as compared to Nvidia chips.

In conclusion, companies are deploying machine learning technology in all areas of life, and the competition to invent better AI algorithms is likely to intensify manifold. In the coming days, several notable companies, big or small are expected to follow the footsteps of Microsoft.

For more machine learning related stories and feeds, follow DexLab Analytics. It is the best data analytics training institute in Gurgaon offering state of the art machine learning using python courses.

The article has been sourced from – https://www.wired.com/story/microsoft-charts-its-own-path-on-artificial-intelligence


Interested in a career in Data Analyst?

To learn more about Machine Learning Using Python and Spark – click here.

To learn more about Data Analyst with Advanced excel course – click here.
To learn more about Data Analyst with SAS Course – click here.
To learn more about Data Analyst with R Course – click here.
To learn more about Big Data Course – click here.

Reigning the Markets: 4 Most Influential Analytics Leaders of 2018

Data analytics in India is grabbing attention. Data and analytics, together, they play a key role in delivering business opinions, which are high-yielding and relatively new. At the helm of such robust data analytics growth are leaders from numerous organizations who introspect into data to conjure up decisions as a seamlessly as possible. They are masterminds in the world of data analytics.

Reigning the Markets: 4 Most Influential Analytics Leaders of 2018

Here, we will talk about 4 most influential analytics leaders who acted as pioneers of bringing in newer technologies and life-changing innovations into the field of analytics, machine learning, artificial intelligence and big data across diverse domains.

Debashish Banerjee, Managing Director, Deloitte Analytics

With 17 years and more experience in predictive modeling, data analytics and data science, Mr. Banerjee’s extensive contribution in the fields of actuarial risk, data mining, advanced analytics and predictive modeling in particular is phenomenal. He started his career with GE, and initiated and headed insurance analytics, pricing and reserving team of GE, India – one of the firsts in India.

In 2005, he shifted to Deloitte with a mission to initiate the advanced analytics and modeling practice in India, through which he manages and offers leadership support to the Deloitte Consulting’s Data Science practices that stresses on AI, predictive modeling, big data and cognitive intelligence. He mostly worked in marketing, customer and HR domains.

Let’s Take Your Data Dreams to the Next Level

Kaushik Mitra, Chief Data Officer and Head of Big Data & Digital Analytics, AXA Business Services (ABS)

Experienced for over 25 years in integrating analytics, technology and marketing worldwide, Kaushik Mitra dons a lot many hats. Besides assuming leadership roles for diverse domains, like AI, analytics, data science, business intelligence and modeling, Mr. Mitra is at present involved in driving an array of data innovation coupled with technology restructuring in the enterprise, as well as coordinating GDPR implementation in ABS.

Before joining ABS, he worked with Fidelity Investments in Bangalore, where he played a pivotal role in establishing their data science practice. Armed with a doctorate in Marketing from the US, he is a notable figure in the world of analytics and marketing, along with being a frequent speaker in Indian industry networks, like NASSCOM and other business forums.

Ravi Vijayaraghavan, Vice President, Flipkart

Currently, Ravi Vijayaraghavan and his team are working on how to leverage analytics, data and science to improve decision-making capabilities and influence businesses across diverse areas within Flipkart. Before joining Flipkart, he used to work as Chief Data Scientist and Global Head of the Analytics and Data Sciences Organization at [24]7.ai. It was here that he created, developed, implemented and optimized machine learning and analytics driven solutions. Also, he held important leadership portfolios at Mu Sigma and Ford Motor Company.

Deep Thomas, Chief Data & Analytics Officer, Aditya Birla Group

“Delivering nothing but sustained and rising profitability figures through potent digital transformation and leveraging data, business analytics, multi-disciplinary talent pool and innovative processes” – has been the work mantra of Deep for more than two decades. Being the Chief Data & Analytics Officer for Aditya Birla Group, he spearheads top of the line analytics solutions and frames organization-wide initiatives and tech-induced programs to enhance business growth, efficiencies and productivity within an organization.

Initially, he headed Tata Insights and Quants, the much acclaimed Tata Group’s Big Data and Decision Science Company. Apart from this, he held a variety of leadership positions in MNCs like Citigroup, HSBC and American Express across US and India to boost global digital and business transformation.

This article has been sourced from – https://analyticsindiamag.com/10-most-influential-analytics-leaders-in-india-2018

For more such interesting blogs and updates, follow DexLab Analytics. It’s a premier data science certification institute in Delhi catering to data aspirants. Take a look at their data science courses in Delhi: they are program-centric and nicely curated.


Interested in a career in Data Analyst?

To learn more about Machine Learning Using Python and Spark – click here.

To learn more about Data Analyst with Advanced excel course – click here.
To learn more about Data Analyst with SAS Course – click here.
To learn more about Data Analyst with R Course – click here.
To learn more about Big Data Course – click here.

Data Analytics: The Key to Track and Curb Leakages in GST

Though our country may have got a One Nation, One Tax Policy, in the face of GST, its revenue collection figures are not so encouraging. In the beginning, GST revenue collection for the first three months went over 90000 crore, but the figures started dropping from October to 83346. And in November, it further slipped to 80808 crore. Since then, the figures mostly lingered around 86000 in the recent months.

 
Data Analytics: The Key to Track and Curb Leakages in GST
 

The Union Ministry of Finance had to figure out the reason of this discrepancy, the reason behind such huge revenue leakage in GST collection before it’s too late, and for that data analytics came to the rescue. After carrying out a thorough analysis, on its 26th meeting on Saturday, GST Council discovered several major data gaps between the self-declared liability in FORM GSTR-1 and FORM GSTR-3B.


Highlighting the outcome of basic data analysis, the GST Council stated that the GST Network (GSTN) and the Central Board of Excise and Customs have found some inconsistency between the amount of Integrated GST (IGST) and Compensation cess paid by importers at customs ports and input tax credit of the same claimed in GSTR-3B.


“Data analytics and better administration controls can help solve GST collection challenges” – said Pratik Jain, a national leader and partner, Indirect Tax at PricewaterhouseCoopers (PwC).


He added, “Government has a lot of data now. They can use the data analytics to find out what the problem areas are, and then try and resolve that.” He also said that to stop the leakage, the government need to be a lot more vigilant and practice better controls over the administration.


Moreover, of late a parliamentary committee has found that the monthly collection from GST is not up to the mark due to constant revisions of the rates, which has undoubtedly affected the stability of the tax structure and had led to an adverse impact for trade and business verticals.  


“The Committee is constrained to observe the not-so-encouraging monthly revenue collections from GST, which still have not stabilised with frequent changes in rates and issue of notifications every now and then. Further, the Committee is surprised to learn that no GST revenue targets have been fixed by the government,” said M Veerappa Moily, the head of Standing Committee on Finance and a veteran Congress leader in a recent report presented in the Parliament.


The original article appeared inanalyticsindiamag.com/government-using-data-analytics-to-track-leakages-in-gst/

To experience the full power of data analytics and the potentials it withholds, find a good data analyst training institute in Delhi NCR. A reliable data analytics training institute like DexLab Analytics can help you unearth the true potentials of a fascinating field of science – go get details now.


Interested in a career in Data Analyst?

To learn more about Machine Learning Using Python and Spark – click here.

To learn more about Data Analyst with Advanced excel course – click here.
To learn more about Data Analyst with SAS Course – click here.
To learn more about Data Analyst with R Course – click here.
To learn more about Big Data Course – click here.

5 Ways to Grab the Hottest Job in Town

Even though it’s expected that the unemployment rate will follow a steep decline, yet finding the right job can still be challenging enough. On the other hand, hiring the right candidate is also an equally difficult task.

 
5 Ways to Grab the Hottest Job in Town
 

At times, it may seem your job search not working. You are sending resume after resume for matching job positions, but nothing fruitful is coming out. Then you start giving it a thought, why is this happening? How come, others are getting new gigs and you are stuck in the same mundane job or still looking for one!


In some cases, you might need to learn new skills or receive any particular kind of training, but in a majority of cases there are plenty of normal things that you can do to boost your candidacy. Some are right here, please take a look:


2

Make your LinkedIn Profile attractive as much as possible

Internet is everything now. Probably, you have been busy devoting a lot of time on building a powerful resume, but instead you should create a good, powerful LinkedIn profile with updated information. Having an optimized profile helps you gain the interest of notable recruiters who are in search for people like you. Include a summary, a headline, a photo and specializations, so that it pleases anyone who visits your profile.

Be a complete standout

A promising candidate should have all the attributes of being competent, adaptable, flexible, collaborative and influential. Flexibility is the key to success and a fuller career.

Do your homework before interview

Culture fit is essential.  A certain skillset can be taught, but the zeal to do homework on the company you are going for an interview cannot be taught. That you have to develop on your own. Recruiters appreciate people who do homework on the respective company and frame answers about how they can be an asset to the company. It’s always advisable to do your homework. Applicants whose answers are down to earth, authentic and show passion stands out in any interview.

Go get a personal website

The best way to impress your employers or recruiters is by having a personal website – with just one URL, you can allow hiring managers derive a whole lot of information about yourself and your work. And if you are looking forward to change your career path, you can flaunt your new passion in a great way on your personal platform.

Tap into your network

Every company receives a lot of internal referrals for recruiting and some of them are quite successful. Through this procedure, they make it sure that they find the right candidates for designated job positions. Hence, networking matters – let your network know what kind of job you are looking for. You never know which conversation will lead you where – because here every interaction is seen as an opportunity. So, just don’t waste it in vain.


Today, jobs in the field of data science and big data are flourishing. More and more interested candidates are getting trained to join the bandwagon of data analytics. DexLab Analytics is a premium data science learning platform that offers in-depth training on all major data related in-demand courses. Their data science training online is excellent. Get all the details from the website.


Interested in a career in Data Analyst?

To learn more about Machine Learning Using Python and Spark – click here.

To learn more about Data Analyst with Advanced excel course – click here.
To learn more about Data Analyst with SAS Course – click here.
To learn more about Data Analyst with R Course – click here.
To learn more about Big Data Course – click here.

3 Ways to Increase ROI with Data Science

3 Ways to Increase ROI with Data Science

In 2018, companies have decided to invest $3.7 trillion on machine learning and digital transformation so as to embrace a promising return on that sizeable investment for professionals involved in managerial roles. Nevertheless, 31% of the companies using the potent tools of machine learning and data science are not yet tracking their ROI or are in no mood to do so in the near future.

But to be on the side, ROI is very crucial for any business success – if you fail to see the ROI you expect from data science implementation, look into bigger and complex processes at work – and adjust likewise.

2

Take cues from these 3 ways, explained below:

Implementing data science strategy into C-Suite

According to Gartner, by next year 90% of big companies would hire a Chief Data Officer, a promising role that was almost nonexistent a few years ago. Of late, the term C-Suite is gaining a lot of importance – but what does it mean? C-Suite basically gets its name from a series of titles of top level executives who job profile name starts with the letter C, like Chief Executive Officer, Chief Financial Officer, Chief Operating Officer and Chief Information Officer. The recent addition of CDO to the C-Suite has been channelized to develop a holistic strategy towards managing data and unveil new trends and opportunities that the company has been attempted to tab for years.

The core responsibility of a CDO is to address a proper data management strategy and then decode it into simple, implementable steps for business operations. Its prime time to integrate data science into bigger processes of business, and soon company heads are realizing this fact and working towards it.

Your time and resources are valuable, don’t waste them

Before formulating any strategy, CDOs need to ensure the pool of professionals working with data have proper access to the desired data tools and support or not. One common problem that persists is that the data science work that takes place within an organization is done on silo, and therefore remains lost or underutilized. This needs to be worked out.

Also, besides giving special attention on transparency, data science software platforms are working towards standardizing data scientists’ efforts by limiting their resources for a given project, thereby ensuing cost savings. In this era of digitization, once you start managing your data science teams efficiently, half the battle is won then and there.

Stay committed to success

Implementing a sophisticated data science model into production process can be a challenging, lengthy and expensive process. Any kind of big, complicated project will take years to get completed but once they do, you expect to see the ROI you desire from data science but the journey might not be all doodle. It will have its own ups and downs, but if you stay committed and deploy the right tools of technology, better outcome is meant to happen.

In a nutshell, boosting of ROI is crucial for business success but the best way to trigger it would be by getting a bird’s eye view of your data science strategy, which will help in predicting success accurately and thus help taking ROI-supported decisions.

If you are looking for a good data analyst training institute in Delhi NCR, end your search with DexLab Analytics. Their data analyst certification is student-friendly and right on the point.


Interested in a career in Data Analyst?

To learn more about Data Analyst with Advanced excel course – Enrol Now.
To learn more about Data Analyst with R Course – Enrol Now.
To learn more about Big Data Course – Enrol Now.

To learn more about Machine Learning Using Python and Spark – Enrol Now.
To learn more about Data Analyst with SAS Course – Enrol Now.
To learn more about Data Analyst with Apache Spark Course – Enrol Now.
To learn more about Data Analyst with Market Risk Analytics and Modelling Course – Enrol Now.

Why Your Business Needs a Chief Productivity Officer: 5 Reasons Explained

For smooth use of technology, businesses look forward to CIOs. But that’s so passé now. This position is now losing its relevance more and more, as other notable features like migration of business applications and storage on the cloud are enhancing their capabilities.

 
Why Your Business Needs a Chief Productivity Officer: 5 Reasons Explained
 

As such, a new business position: Chief Productivity Officer (CPO) is sprouting out – this job profile dictates all the services, while ensuring your organization meets every goal.

Continue reading “Why Your Business Needs a Chief Productivity Officer: 5 Reasons Explained”

Architecture Trade-offs Pays Well for Enterprise Analytics

Today, owing to an explosion of technology options, determining which analytics stack to adopt takes into account a streak of architectural trade-offs. Over the years, with our experience and expertise we have learnt the most crucial aspect of creating sound analytics systems and pleasing customers with improved digital solutions – is the location where data is to be stored and processed, and the different types of databases to use so that only the right people gain access to it.

Architecture Trade-offs Pays Well for Enterprise Analytics

Opt for a comprehensive data analyst course Delhi NCR from DexLab Analytics.

Continue reading “Architecture Trade-offs Pays Well for Enterprise Analytics”

Write ETL Jobs to Offload the Data Warehouse Using Apache Spark

Write ETL Jobs to Offload the Data Warehouse Using Apache Spark

The surge of Big Data is everywhere. The evolving trends in BI have taken the world in its stride and a lot of organizations are now taking the initiative of exploring how all this fits in.

Leverage data ecosystem to its full potential and invest in the right technology pieces – it’s important to think ahead so as to reap maximum benefits in IT in the long-run.

“By 2020, information will be used to reinvent, digitalize or eliminate 80% of business processes and products from a decade earlier.” – Gartner’s prediction put it so right!

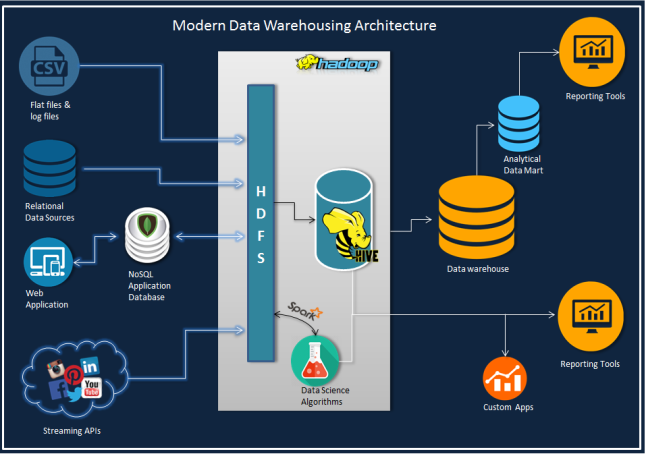
The following architecture diagram entails a conceptual design – it helps you leverage the computing power of Hadoop ecosystem from your conventional BI/ Data warehousing handles coupled with real time analytics and data science (data warehouses are now called data lakes).

moderndwarchitecture

In this post, we will discuss how to write ETL jobs to offload data warehouse using PySpark API from the genre of Apache Spark. Spark with its lightning-fast speed in data processing complements Hadoop.

Now, as we are focusing on ETL job in this blog, let’s introduce you to a parent and a sub-dimension (type 2) table from MySQL database, which we will merge now to impose them on a single dimension table in Hive with progressive partitions.

Stay away from snow-flaking, while constructing a warehouse on hive. It will reduce useless joins as each join task generates a map task.

Just to raise your level of curiosity, the output on Spark deployment alone in this example job is 1M+rows/min.

The Employee table (300,024 rows) and a Salaries table (2,844,047 rows) are two sources – here employee’s salary records are kept in a type 2 fashion on ‘from_date’ and ‘to_date’ columns. The main target table is a functional Hive table with partitions, developed on year (‘to_date’) from Salaries table and Load date as current date. Constructing the table with such potent partition entails better organization of data and improves the queries from current employees, provided the to_date’ column has end date as ‘9999-01-01’ for all current records.

The rationale is simple: Join the two tables and add load_date and year columns, followed by potent partition insert into a hive table.

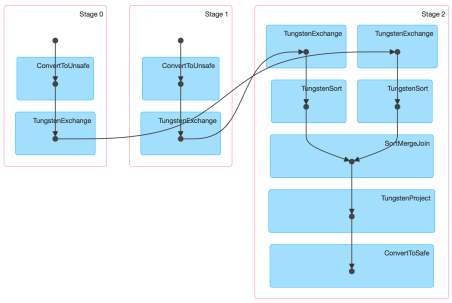
Check out how the DAG will look:

screen-shot-2015-09-28-at-1-44-32-pm

Next to version 1.4 Spark UI conjures up the physical execution of a job as Direct Acyclic Graph (the diagram above), similar to an ETL workflow. So, for this blog, we have constructed Spark 1.5 with Hive and Hadoop 2.6.0

Go through this code to complete your job easily: it is easily explained as well as we have provided the runtime parameters within the job, preferably they are parameterized.

Code: MySQL to Hive ETL Job

__author__ = 'udaysharma'
# File Name: mysql_to_hive_etl.py
from pyspark import SparkContext, SparkConf
from pyspark.sql import SQLContext, HiveContext
from pyspark.sql import functions as sqlfunc

# Define database connection parameters
MYSQL_DRIVER_PATH = "/usr/local/spark/python/lib/mysql-connector-java-5.1.36-bin.jar"
MYSQL_USERNAME = '<USER_NAME >'
MYSQL_PASSWORD = '********'
MYSQL_CONNECTION_URL = "jdbc:mysql://localhost:3306/employees?user=" + MYSQL_USERNAME+"&password="+MYSQL_PASSWORD 

# Define Spark configuration
conf = SparkConf()
conf.setMaster("spark://Box.local:7077")
conf.setAppName("MySQL_import")
conf.set("spark.executor.memory", "1g")

# Initialize a SparkContext and SQLContext
sc = SparkContext(conf=conf)
sql_ctx = SQLContext(sc)

# Initialize hive context
hive_ctx = HiveContext(sc)

# Source 1 Type: MYSQL
# Schema Name  : EMPLOYEE
# Table Name   : EMPLOYEES
# + --------------------------------------- +
# | COLUMN NAME| DATA TYPE    | CONSTRAINTS |
# + --------------------------------------- +
# | EMP_NO     | INT          | PRIMARY KEY |
# | BIRTH_DATE | DATE         |             |
# | FIRST_NAME | VARCHAR(14)  |             |
# | LAST_NAME  | VARCHAR(16)  |             |
# | GENDER     | ENUM('M'/'F')|             |
# | HIRE_DATE  | DATE         |             |
# + --------------------------------------- +
df_employees = sql_ctx.load(
    source="jdbc",
    path=MYSQL_DRIVER_PATH,
    driver='com.mysql.jdbc.Driver',
    url=MYSQL_CONNECTION_URL,
    dbtable="employees")

# Source 2 Type : MYSQL
# Schema Name   : EMPLOYEE
# Table Name    : SALARIES
# + -------------------------------- +
# | COLUMN NAME | TYPE | CONSTRAINTS |
# + -------------------------------- +
# | EMP_NO      | INT  | PRIMARY KEY |
# | SALARY      | INT  |             |
# | FROM_DATE   | DATE | PRIMARY KEY |
# | TO_DATE     | DATE |             |
# + -------------------------------- +
df_salaries = sql_ctx.load(
    source="jdbc",
    path=MYSQL_DRIVER_PATH,
    driver='com.mysql.jdbc.Driver',
    url=MYSQL_CONNECTION_URL,
    dbtable="salaries")

# Perform INNER JOIN on  the two data frames on EMP_NO column
# As of Spark 1.4 you don't have to worry about duplicate column on join result
df_emp_sal_join = df_employees.join(df_salaries, "emp_no").select("emp_no", "birth_date", "first_name",
                                                             "last_name", "gender", "hire_date",
                                                             "salary", "from_date", "to_date")

# Adding a column 'year' to the data frame for partitioning the hive table
df_add_year = df_emp_sal_join.withColumn('year', F.year(df_emp_sal_join.to_date))

# Adding a load date column to the data frame
df_final = df_add_year.withColumn('Load_date', F.current_date())

df_final.repartition(10)

# Registering data frame as a temp table for SparkSQL
hive_ctx.registerDataFrameAsTable(df_final, "EMP_TEMP")

# Target Type: APACHE HIVE
# Database   : EMPLOYEES
# Table Name : EMPLOYEE_DIM
# + ------------------------------- +
# | COlUMN NAME| TYPE   | PARTITION |
# + ------------------------------- +
# | EMP_NO     | INT    |           |
# | BIRTH_DATE | DATE   |           |
# | FIRST_NAME | STRING |           |
# | LAST_NAME  | STRING |           |
# | GENDER     | STRING |           |
# | HIRE_DATE  | DATE   |           |
# | SALARY     | INT    |           |
# | FROM_DATE  | DATE   |           |
# | TO_DATE    | DATE   |           |
# | YEAR       | INT    | PRIMARY   |
# | LOAD_DATE  | DATE   | SUB       |
# + ------------------------------- +
# Storage Format: ORC


# Inserting data into the Target table
hive_ctx.sql("INSERT OVERWRITE TABLE EMPLOYEES.EMPLOYEE_DIM PARTITION (year, Load_date) \
            SELECT EMP_NO, BIRTH_DATE, FIRST_NAME, LAST_NAME, GENDER, HIRE_DATE, \
            SALARY, FROM_DATE, TO_DATE, year, Load_date FROM EMP_TEMP")

As we have the necessary configuration mentioned in our code, we will simply call to run this job

spark-submit mysql_to_hive_etl.py

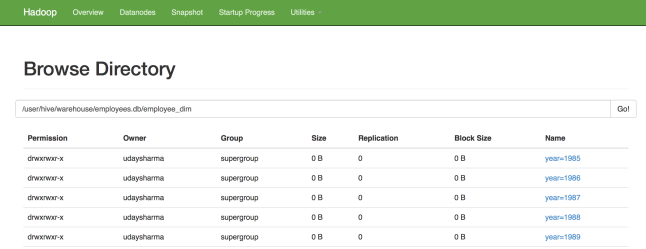
As soon as the job is run, our targeted table will consist 2844047 rows just as expected and this is how the partitions will appear:

screen-shot-2015-09-29-at-12-42-37-am

2

3

screen-shot-2015-09-29-at-12-46-55-am

The best part is that – the entire process gets over within 2-3 mins..

For more such interesting blogs and updates, follow us at DexLab Analytics. We are a premium Big Data Hadoop institute in Gurgaon catering to the needs of aspiring candidates. Opt for our comprehensive Hadoop certification in Delhi and crack such codes in a jiffy!


Interested in a career in Data Analyst?

To learn more about Data Analyst with Advanced excel course – Enrol Now.
To learn more about Data Analyst with R Course – Enrol Now.
To learn more about Big Data Course – Enrol Now.

To learn more about Machine Learning Using Python and Spark – Enrol Now.
To learn more about Data Analyst with SAS Course – Enrol Now.
To learn more about Data Analyst with Apache Spark Course – Enrol Now.
To learn more about Data Analyst with Market Risk Analytics and Modelling Course – Enrol Now.

Call us to know more