Data analyst certification Archives - DexLab Analytics | Big Data Hadoop SAS R Analytics Predictive Modeling & Excel VBA

Human Element Remains Critical for Enhanced Digital Customer Experience

Human Element Remains Critical for Enhanced Digital Customer Experience

Digital customer engagement and service is trending the charts. Companies are found actively focusing on establishing long-lasting relationships in sync with customer expectations to hit better results and profitable outcomes. Customers are even hopeful about businesses implementing smart digital channels to solve complex service issues and finish transactions.

70 % of customers expect companies to have a self-service option in their websites and 50% expect to solve issues concerning products or services themselves – according to Zendesk.

In this regard, below we’ve charted down a few ways to humanize the customer experience, keeping the human aspect in prime focus:

2

Adding Human Element through Brand Stories

Each brand tells a story. But, how, or in what ways do the brands tell their story to the customers? Is it through videos or texts? Brand’s history or values need to be iterated in the right voice to the right audience. Also, the companies must send a strong message saying how well they value their customers and how they always put their customers in the first place, before anything else.

Additionally, the company’s sales team should always look forward to help their customers with after-purchase information – such as how well the customers are enjoying certain features, whether any improvement is needed and more – valuable customer feedback always help at the end of the day!

AI for Feedback

Identify prospective customers who are becoming smarter day by day. This is done via continuous feedback loops along with automated continuous education. Whenever you receive feedback from a specific customer interaction, it’s advised to feed it back to their profile. An enclosed feedback loop is quite important to gain meaningful information about customers and their purchasing pattern. This is the best way to know well your customers and determine what they want and how.

Time and again, customers are asked by brands to take part in specific surveys and rate their services, describing what their feelings are about those particular products or services. All this helps comprehend customer’s satisfaction quotient regarding services, and in a way helps you take necessary action in enhancing customer experience.

Personalized Content for Customer Satisfaction

Keeping customers interested in your content is the key. Become a better story-teller and enhance customer satisfaction. Customers like it when you tell your brand’s story in your own, innovative way. But, of course, marketers face a real challenge when writing down an entertaining story, not appearing like written by agency but themselves.

A token of advice from our side – never go too rigid; be original, and try to narrate the story in an interactive way. To craft a unique brand story, the essence lies in using little wit, humor and a dash of self-effacement to add a beat to the brand.

End Notes

As parting thoughts, we would like to say always act in real-time, and better understand what your customers what and their behavioral traits. This way it would be easier to predict their next move. What’s more, your brand should be people-based and make intelligent use of customer’s available data to develop a deeper understating about your users and their respective needs.

DexLab Analytics is a prime data analyst training institute in Delhi – their data analyst training courses is as per industry standards and brimmed with practical expertise merged with theoretical knowledge. Visit the website now.

 
The blog has been sourced fromdataconomy.com/2018/08/how-to-keep-the-human-element-in-digital-customer-experience
 

Interested in a career in Data Analyst?

To learn more about Data Analyst with Advanced excel course – Enrol Now.
To learn more about Data Analyst with R Course – Enrol Now.
To learn more about Big Data Course – Enrol Now.

To learn more about Machine Learning Using Python and Spark – Enrol Now.
To learn more about Data Analyst with SAS Course – Enrol Now.
To learn more about Data Analyst with Apache Spark Course – Enrol Now.
To learn more about Data Analyst with Market Risk Analytics and Modelling Course – Enrol Now.

5 Incredible Techniques to Lift Data Analysis to the Next Level

5 Incredible Techniques to Lift Data Analysis to the Next Level

Today, it’s all about converting data into actionable insights. How much data an organization collects from a plethora of sources is all companies cares of. To understand the intricacies of the business operations and helps team identify future trends, data is the power.

Interestingly, there’s more than one way to analyze data. Depending on your requirement and types of data you need to have, the perfect tool for data analytics will fluctuate. Here, we’ve 5 methods of data analysis that will help you develop more relevant and actionable insights.

DexLab Analytics is a premier data analytics training institute in Noida. It offers cutting edge data analyst courses for data enthusiasts.

2

Difference between Quantitative and Qualitative Data:

What type of data do you have? Quantitative or qualitative? From the name itself you can guess quantitative deal is all about numbers and quantities. The data includes sales numbers, marketing data, including payroll data, revenues and click-through rates, and any form of data that can be counted objectively.

Qualitative data is relatively difficult to pin down; they tend to be more subjective and explanatory. Customer surveys, interview results of employees and data that are more inclined towards quality than quantity are some of the best examples of qualitative data. As a result, the method of analysis is less structured and simple as compared to quantitative techniques.

Measuring Techniques for Quantitative Data:

Regression Analysis

When it comes to making forecasts and predictions and future trend analysis, regression studies are the best bet. The tool of regression measures the relationship between a dependent variable and an independent variable.

Hypothesis Testing

Widely known as ‘T Testing’, this type of analytics method boosts easy comparison of data against the hypothesis and assumptions you’ve made regarding a set of operations. It also allows you to forecast future decisions that might affect your organization.

Monte Carlo Simulation

Touted as one of the most popular techniques to determine the impact of unpredictable variables on a particular factor, Monte Carlo simulations implement probability modeling for smooth prediction of risk and uncertainty. This type of simulation uses random numbers and data to exhibit a series of possible outcomes for any circumstance based on any results. Finance, engineering, logistics and project management are a few industries where this incredible tool is widely used.

Measuring Techniques for Qualitative Data:

Unlike quantitative data, qualitative data analysis calls for more subjective approaches, away from pure statistical analysis and methodologies. Though, you still will be able to extract meaningful information from data by employing different data analysis techniques, subject to your demands.

Here, we’ve two such techniques that focus on qualitative data:

Content Analysis

It works best when working with data, like interview data, user feedback, survey results and more – content analysis is all about deciphering overall themes emerging out of a qualitative data. It helps in parsing textual data to discover common threads focusing on improvement.

Narrative Analysis

Narrative analysis help you understand organizational culture by the way ideas and narratives are communicated within an organization. It works best when planning new marketing campaigns and mulling over changes within corporate culture – it includes what customers think about an organization, how employees feel about their job remuneration and how business operations are perceived.

Agreed or not, there’s no gold standard for data analysis or the best way to perform it. You have to select the method, which you deem fit for your data and requirements, and unravel improved insights and optimize organizational goals.

 
The blog has been sourced fromwww.sisense.com/blog/5-techniques-take-data-analysis-another-level
 

Interested in a career in Data Analyst?

To learn more about Data Analyst with Advanced excel course – Enrol Now.
To learn more about Data Analyst with R Course – Enrol Now.
To learn more about Big Data Course – Enrol Now.

To learn more about Machine Learning Using Python and Spark – Enrol Now.
To learn more about Data Analyst with SAS Course – Enrol Now.
To learn more about Data Analyst with Apache Spark Course – Enrol Now.
To learn more about Data Analyst with Market Risk Analytics and Modelling Course – Enrol Now.
Cyber Security with Data Analytics: Key to a Successful Future

Cyber Security with Data Analytics: Key to a Successful Future

Cyber security and data analytics are two dominant fields of technology that’s increasingly gaining a lot of importance. While data analytics helps in figuring out whether the latest campaign was successful or not, cyber security ensures all your confidential documents are stored in the cloud under supreme security and surveillance.

Nevertheless, learning them can be quite expensive and time-consuming. Especially so for the bosses, who like forever wonder if these in-demand courses would help their employees imbibe added skills and improved work expertise.

On the contrary, we would say attending data analyst courses in Delhi is not at all like a wager – in fact, in most cases, it turns out to be good bets for the bosses as their employees learn in-demand skills with which they strive for long-term wins for the company, pulling up the company’s fortune and future with them. So, not bad eh?

2

The Pathway to Success

Now, talking about the employment and work opportunities, if you ask which positions would fill up sooner, you’d most certainly hear: data analytics and cyber security. The world is in dire need of skilled data analysts; and trust us, when we say they are difficult to find, but harder to retain! Because mature talent is not an everyday affair, anymore. So, what happens next?

A majority of cybersecurity tool providers are adding ultra-functional data science capabilities to their cybersecurity platforms. This includes factoring behavior-based analytics and responses into antivirus suites, firewalls, and traffic analyzers – which, eventually turns the products and services smarter and effective. Another domain worth noticing is the artificial intelligence, which when fused with data science can augment conventional cybersecurity. Though the technology is still in its nascent stage, soon it’s going to garner attention and develop full-fledged.

Meanwhile, the frameworks of cybersecurity are evolving. This exposes the challenge of securing black-box algorithms – an incredible product of data science program that helps us learn and grow dynamically.

As these analytical models are so highly intricate as well as valuable for the companies, cybersecurity professionals need to be well-versed in all avenues of data science for ascertaining protection to these models, while ensuring integrity at the same time.

Conclusion

Therefore, the convergence of data science and cybersecurity is proved to be one of the trendiest areas of technology industry in the next few years. With regular innovations and technological evolution, be prepared to witness a surge in the demand for data science and cybersecurity professionals before it heads towards a near-term horizon.

So, start preparing yourself now and be ready to hone your skills in elusive cybersecurity practices and AI controls and models to stay ahead of the curve.

DexLab Analytics offers comprehensive data analytics certification courses for freshers as well as intermediates. Pick a particular course, train yourself and dig deeper into the world of analytics.

For more information, visit their official website today.


The blog has been sourced from —

vulcanpost.com/644684/data-analytics-courses-singapore/

tdwi.org/articles/2018/01/16/adv-all-cybersecurity-plus-data-science-future-career-path.aspx
 

Interested in a career in Data Analyst?

To learn more about Data Analyst with Advanced excel course – Enrol Now.
To learn more about Data Analyst with R Course – Enrol Now.
To learn more about Big Data Course – Enrol Now.

To learn more about Machine Learning Using Python and Spark – Enrol Now.
To learn more about Data Analyst with SAS Course – Enrol Now.
To learn more about Data Analyst with Apache Spark Course – Enrol Now.
To learn more about Data Analyst with Market Risk Analytics and Modelling Course – Enrol Now.

7 Leading Sectors in India That Need an AI & Analytics Makeover

7 Leading Sectors in India That Need an AI & Analytics Makeover

Advancements in the field of data analytics and artificial intelligence are fuelling innovation in every nation around the world. India too is showing keen interest in AI. This year, the government has doubled the amount invested in the innovation program Digital India which drives advances in machine learning, AI and 3-D printing.

The signs of increased activity in AI research and development are showing in different areas. Here are the topmost sectors of India that are in dire need of AI and data science revolution:

FINANCE

According to reports by PricewaterhouseCoopers, financial bodies and payment regulators deal with billions of dollars in transactions through ATMs, credit cards, e-commerce transactions, etc. When human expertise is combined with advanced analytical methods and machine learning algorithms, fraudulent transactions can be flagged the moment they occur. This leaves less room for human errors. Considering the recent discoveries about major frauds in reputed banks in India, this approach seems more like a necessity.

Image source: American Banker


AGRICULTURE

Although 40% of the Indian population works in the agricultural sector, revenues from this sector make up only 16% of the total GDP. The agricultural industry needs advanced data analytics techniques for the prediction of annual, quarterly or monthly yields; analyzing weather reports are observing the best time to sow; estimating the market price of different products so that the most profitable crop can be cultivated, etc. AI powered sensors can measure the temperature and moisture level of soil. With the help of such data farmers can identify the best time to plant and harvest crops and make efficient use of fertilizers.

Image source: Inventiva

HEALTHCARE

According to the Indian constitution, each and every citizen is supposed to get free healthcare. And government hospitals do provide that to people below poverty line. Nonetheless, 81% of the doctors work for private hospitals and nearly 60% hospitals in India are private (According to Wikipedia). The root cause for this is that government hospitals are overpopulated. People who can afford healthcare services from a private hospital prefer to be treated there. Data science can play a pivotal role in managing the growing demand for healthcare services by strengthening the current infrastructure. It can help by predicting how many days a patient is likely to be admitted and find out the proper allotment of beds. AI fine tunes medical predictions and helps selecting a proper line of treatment.

Image source: wxpress

CRIME PREDICTION

Considering the number of security threats and extremist attacks India has faced in the past, there’s urgent need to develop efficient methods that can neutralize such threats and maintain proper law and order. AI and ML can step in to ease the burden of security personnel. A welcome development is the collaboration between Israeli company Cortica and Best Group. Massive amounts of data from CCTV cameras across the nation are being analyzed to anticipate crime and take action before it happens. Streaming data is scrutinized for behavioral anomalies, which are considered as warning signs for a person who commits a violent crime. The aim of the Indian authorities is improving safely in roads, stations, bus stops and other public places.

Image source: Digital Trends

From the paragraphs above it is evident that AI and data analytics has immense scope to improve these major sectors in India. While you look forward to these developments also follow DexLab Analytics, which is a leading data analyst training institute in Delhi. For data analyst certification, get in touch with DexLab’s industry experts.

Reference:

www.brookings.edu/blog/techtank/2018/05/17/artificial-intelligence-and-data-analytics-in-india

www.analyticsvidhya.com/blog/2018/08/top-7-sectors-where-data-science-can-transform-india-with-free-datasets


Interested in a career in Data Analyst?

To learn more about Data Analyst with Advanced excel course – Enrol Now.
To learn more about Data Analyst with R Course – Enrol Now.
To learn more about Big Data Course – Enrol Now.

To learn more about Machine Learning Using Python and Spark – Enrol Now.
To learn more about Data Analyst with SAS Course – Enrol Now.
To learn more about Data Analyst with Apache Spark Course – Enrol Now.
To learn more about Data Analyst with Market Risk Analytics and Modelling Course – Enrol Now.

Fundamental Concepts of Statistics for Data Science Beginners- Part One

Fundamental Concepts of Statistics for Data Science Beginners- Part One

Do you aspire to be a data scientist? Then is it essential that you have a solid understanding of the core concepts of statistics. Everyone doesn’t have a Ph.D. in Statistics. And that isn’t the only way to excel in the field of data science. But yes, knowing stats well is a prerequisite for data science.

Nowadays, popularly used libraries, like Tesorflow, liberate the user from the intricacies of complex mathematics. Still, it is advisable to be familiar with the fundamental principles on which they work, because that will enable you to use the libraries better.

In this blog, we attempt to shed light on some basic concepts, theorems and equations of statistics for data science.

Statistical Distributions:

Statistical distributions are important tools that you must arm yourself with to be a skilled data scientist. Here, we shall talk about two important distributions, namely Poisson distribution and Binomial distribution.

Poisson distribution:
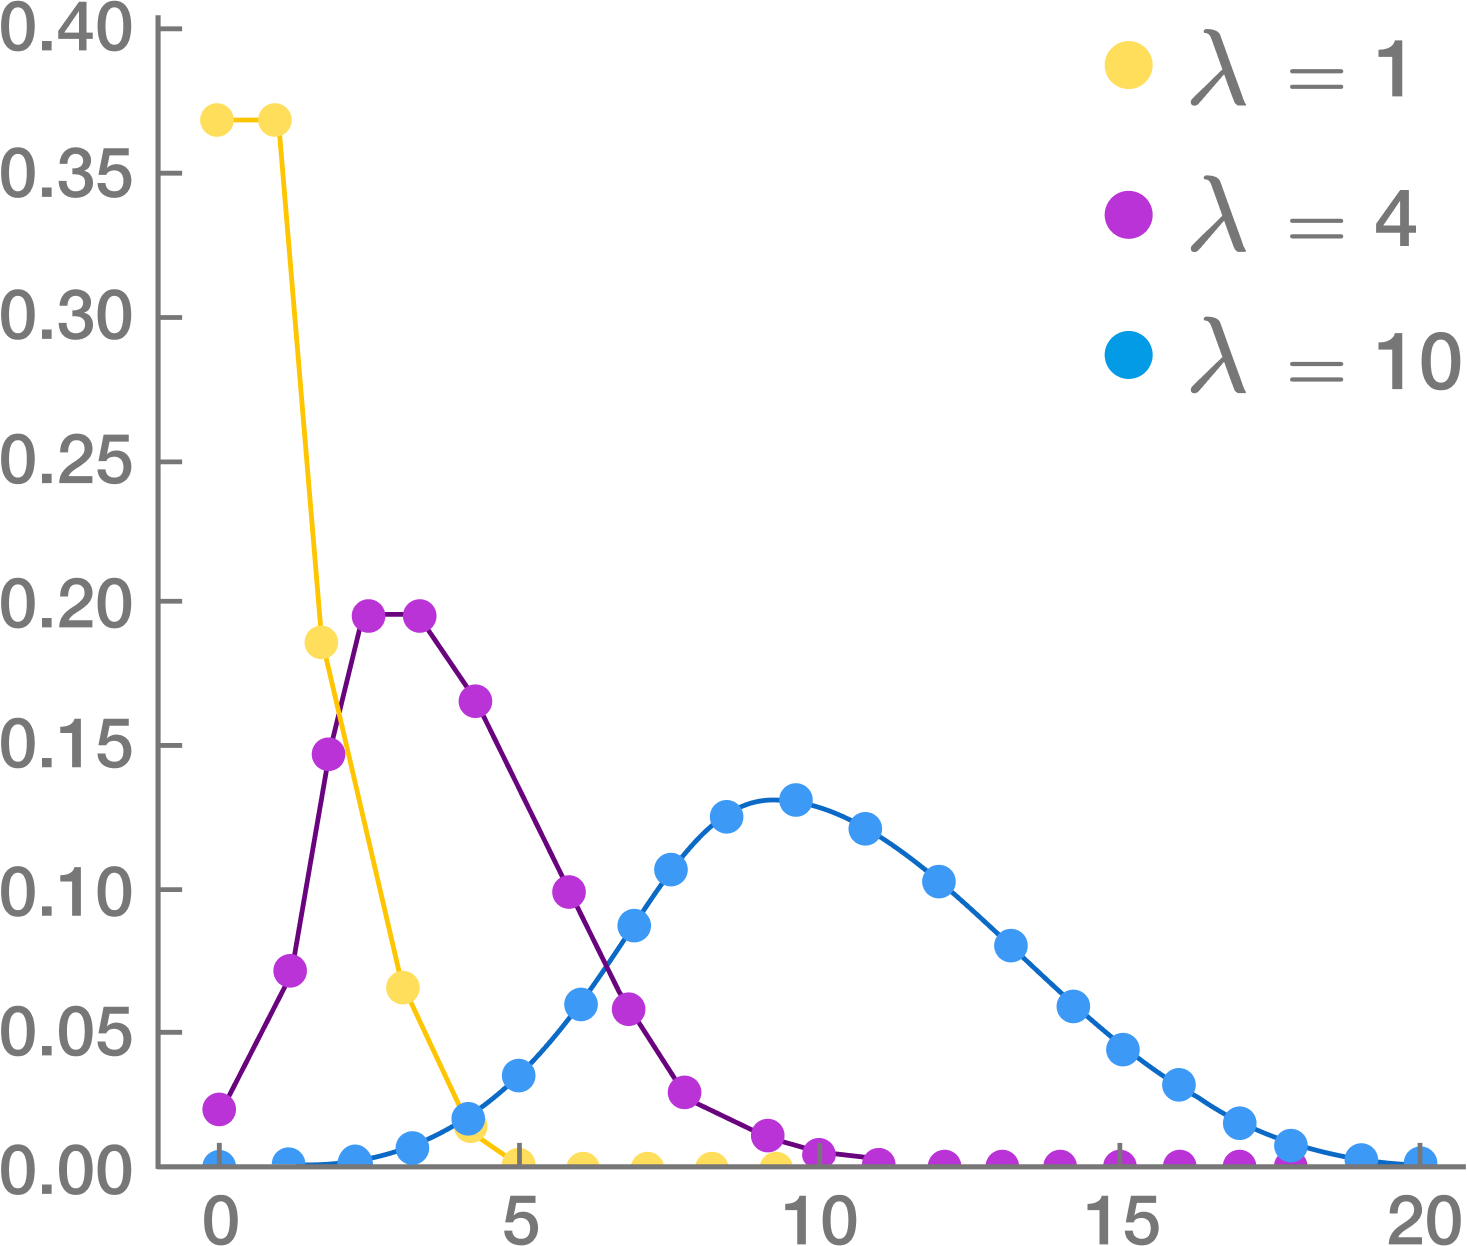
This distribution is used to find out the number of events that are expected to occur during an interval of time. For example, the number of page views in one second, the number of phone calls in a particular period of time, number of sales per hour, etc.

The symbols used in the equation are:

x: exact number of successes

e: constant equal to 2.71828 approximately

λ: average number of successes per time interval

Poisson distribution is used for calculating losses in manufacturing. Let us consider that a machine generates metal sheets that have ‘x’ flaws per yard. Suppose the error rate is 2 per yard of sheet (λ). Applying this information to Poisson distribution, we can calculate the probability of having exactly two errors in a yard.

Source: Brilliant.org

Poisson distribution is used for faster detection of anomalies.

Binomial distribution:

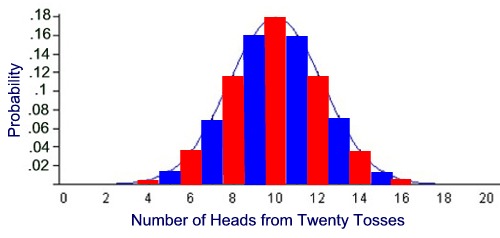
This is a very common distribution in Statistics. Suppose you have flipped a coin thrice. Using basic combinatorics for flipping a coin thrice, we see that there are eight combinations possible. We find out the probabilities of getting 0, 1, 2 or 3 heads and plot this on a graph. This gives us the binomial distribution for this particular problem. It must be remembered that Binomial distribution curve is similar to a Normal distribution Curve. Normal distribution is used when values are continuous and Binomial distribution is used for discrete values.

Source: mathnstuff.com

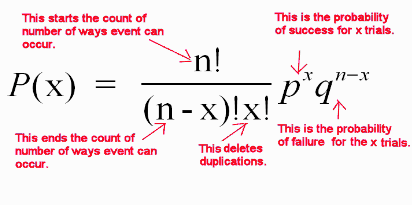
Binomial distribution is a discrete probability distribution where number of trials is predetermined and there are two possible outcomes– success and failure, win or lose, gain or loss. Depending on a few conditions, like the total number of trails is large, the probability of success is near 1 and the probability of failure is near 0, the trails are independent and identical, etc., the binomial distribution is approximated to a normal distribution.

Source: MathBitsNotebook

Binomial distribution has many applications in business. For example, it is estimated that 5% of tax returns for individuals with high net worth in USA is fraudulent. These frauds might be uncovered through audits. Binomial distribution is used to find out for ‘n’ number of tax returns that are audited, what is the probability for say 5 fraudulent returns to be uncovered.

There are some more probability distributions, like Bernoulli and Geometric distributions. We shall cover that and more in the following blogs. So, stay tuned and follow DexLab Analytics. The experts here offer top-quality data science courses in Delhi. Go through the data science certification details right now!


References:

upgrad.com/blog/basics-of-statistics-for-data-science

anomaly.io/anomaly-detection-poisson-distribution

analyticsvidhya.com/blog/2017/09/6-probability-distributions-data-science


Interested in a career in Data Analyst?

To learn more about Data Analyst with Advanced excel course – Enrol Now.
To learn more about Data Analyst with R Course – Enrol Now.
To learn more about Big Data Course – Enrol Now.

To learn more about Machine Learning Using Python and Spark – Enrol Now.
To learn more about Data Analyst with SAS Course – Enrol Now.
To learn more about Data Analyst with Apache Spark Course – Enrol Now.
To learn more about Data Analyst with Market Risk Analytics and Modelling Course – Enrol Now.

The Big Data Driven Future of Fashion: How Data Influences Fashion

The Big Data Driven Future of Fashion: How Data Influences Fashion

Big Data is revolutionizing every industry, including fashion. The nuanced notion of big data is altering the ways designers create and market their clothing. It’s not only aiding designers in understanding customer preferences but also helps them market their products well. Hadoop BI is one of the potent tools of technology that provides a wide pool of information for designers to design range of products that will sell.

2

How Does the Mechanism Work?

Large sets of data help draw patterns and obviously trends play a crucial role across the fashion industry. In terms of nature, fashion and trends both are social. Irrespective of the nature of data, structured or unstructured, framing trends and patterns in the fashion industry leads to emerging ideas, strategies, shapes and styles, all of which ushers you into bright and blooming future of fashion.

What Colors To Choose For Your Line?

KYC (Know Your Customer) is the key here too. A fashion house must know which colors are doing rounds amongst the customers. Big data tells a lot about which color is being popular among the customers, and based on that, you can change your offerings subject to trend, style picks and customer preferences.

Men’s or Women’s Clothing: Which to Choose?

Deciding between men’s or women fashion is a pivotal point for any designer. Keep in mind, target demographic for each designer is different, and they should know who will be their prospective customers and who doesn’t run a chance.

Big data tool derive insights regarding when customers will make purchases, how large will be the quantity and how many items are they going to buy. Choosing between men’s and women’s fashion could make all the difference in the world.

Arm yourself with business analyst training courses in Gurgaon; it’s high time to be data-friendly.

Transforming Runway Fashion into Retail Merchandise

Launching a brand in the eyes of the public garners a lot of attention, and the designs need to be stellar. But, in reality the fashion that we often see on runways is rarely donned by the ordinary customers; because, the dresses and outfits that are showcased on the ramp are a bit OTT, thus altered before being placed in the stores. So, big data aids in deciphering which attires are going to be successful, and which will fail down the line. So, use the power of big data prudently and reap benefit, unimaginable across the global retail stores.

Deciding Pricing of the Product

As soon as the garbs leave the runway, they are tagged with prices, which are then posted inside the stores, after analyzing how much the customers are willing to pay for a particular product. For averaging, big data is a saving grace. Big data easily averages the prices, and decides a single mean price, which seems to be quite justifiable.

However, remember, while pricing, each garments are designed keeping in mind a specified customer range. Attires that are incredibly expensive are sold off to only a selected affluent user base, while the pricing of items that are designed for general public are pegged down. Based on previous years’ data, big data consultants can decide the pricing policy so that there’s something for all.

The world of fashion is changing, and so is the way of functioning. From the perspective of fashion house owner, collect as much data as possible of customers and expand your offerings. Big data analytics is here to help you operate your business and modify product lines that appeals to the customers in future.

And from the perspective of a student, to harness maximum benefits from data, enroll in a data analyst course in Gurgaon. Ask the consultants of DexLab Analytics for more deets.


The article has been sourced from

channels.theinnovationenterprise.com/articles/8230-big-data-hits-the-runway-how-big-data-is-changing-the-fashion-industry

iamwire.com/2017/01/big-data-fashion-industry/147935

bbntimes.com/en/technology/big-data-is-stepping-into-the-fashion-world


Interested in a career in Data Analyst?

To learn more about Data Analyst with Advanced excel course – Enrol Now.
To learn more about Data Analyst with R Course – Enrol Now.
To learn more about Big Data Course – Enrol Now.

To learn more about Machine Learning Using Python and Spark – Enrol Now.
To learn more about Data Analyst with SAS Course – Enrol Now.
To learn more about Data Analyst with Apache Spark Course – Enrol Now.
To learn more about Data Analyst with Market Risk Analytics and Modelling Course – Enrol Now.

FAQs before Implementing a Data Lake

FAQs before Implementing a Data Lake

Data Lake – is a term you must have encountered numerous times, while working with data. With a sudden growth in data, data lakes are seen as an attractive way of storing and analyzing vast amounts of raw data, instead of relying on traditional data warehouse method.

But, how effective is it in solving big data related problems? Or what exactly is the purpose of a data lake?

Let’s start with answering that question –

What exactly is a data lake?

To begin with, the term ‘Data Lake’ doesn’t stand for a particular service or any product, rather it’s an encompassing approach towards big data architecture that can be encapsulated as ‘store now, analyze later’. In simple language, data lakes are basically used to store unstructured or semi-structured data that is derived from high-volume, high-velocity sources in a sudden stream – in the form of IoT, web interactions or product logs in a single repository to fulfill multiple analytic functions and cases.

2

What kind of data are you handling?

Data lakes are mostly used to store streaming data, which boasts of several characteristics mentioned below:

  • Semi-structured or unstructured
  • Quicker accumulation – a common workload for streaming data is tens of billions of records leading to hundreds of terabytes
  • Being generated continuously, even though in small bursts

However, if you are working with conventional, tabular information – like data available from financial, HR and CRM systems, we would suggest you to opt for typical data warehouses, and not data lakes.

What kind of tools and skills is your organization capable enough to provide?

Take a note, creating and maintaining a data lake is not similar to handling databases. Managing a data lake asks for so much more – it would typically need huge investment in engineering, especially for hiring big data engineers, who are in high-demand and very less in numbers.

If you are an organization and lack the abovementioned resources, you should stick to a data warehouse solution until you are in a position of hiring recommended engineering talent or using data lake platforms, such as Upsolver – for streamlining the methods of creating and administering cloud data lake without devoting sprawling engineering resources for the cause.

What to do with the data?

The manner of data storage follows a specific structure that would be suitable for a certain use case, like operational reporting but the purpose for data structuring leads to higher costs and could also put a limit to your ability to restructure the same data for future uses.

This is why the tagline: store now, analyze later for data lakes sounds good. If you are yet to make your mind whether to launch a machine learning project or boost future BI analysis, a data lake would fit the bill. Or else, a data warehouse is always there as the next best alternative.

What’s your data management and governance strategy?

In terms of governance, both data warehouses and lakes pose numerous challenges – so, whichever solution you chose, make sure you know how to tackle the difficulties. In data warehousing, the potent challenge is to constantly maintain and manage all the data that comes through and adding them consistently using business logic and data model. On the other hand, data lakes are messy and difficult to maintain and manage.

Nevertheless, armed with the right data analyst certification you can decipher the right ways to hit the best out of a data lake. For more details on data analytics training courses in Gurgaon, explore DexLab Analytics.


The article has been sourced from — www.sisense.com/blog/5-questions-ask-implementing-data-lake


Interested in a career in Data Analyst?

To learn more about Data Analyst with Advanced excel course – Enrol Now.
To learn more about Data Analyst with R Course – Enrol Now.
To learn more about Big Data Course – Enrol Now.

To learn more about Machine Learning Using Python and Spark – Enrol Now.
To learn more about Data Analyst with SAS Course – Enrol Now.
To learn more about Data Analyst with Apache Spark Course – Enrol Now.
To learn more about Data Analyst with Market Risk Analytics and Modelling Course – Enrol Now.

Industry Use Cases of Big Data Hadoop Using Python – Explained

Industry Use Cases of Big Data Hadoop Using Python – Explained

Welcome to the BIG world of Big Data Hadoop – the encompassing eco-system of all open-source projects and procedures that constructs a formidable framework to manage data. Put simply, Hadoop is the bedrock of big data operations. Though the entire framework is written in Java language, it doesn’t exclude other programming languages, such as Python and C++ from being used to code intricate distributed storage and processing framework. Besides Java architects, Python-skilled data scientists can also work on Hadoop framework, write programs and perform analysis. Easily, programs can be written in Python language without the need to translate them into Java jar files.

Python as a programming language is simple, easy to understand and flexible. It is capable and powerful enough to run end-to-end advanced analytical applications. Not to mention, Python is a versatile language and here we present a few popular Python frameworks in sync with Hadoop:


  • Hadoop Streaming API
  • Dumbo
  • Mrjob
  • Pydoop
  • Hadoopy


Now, let’s take a look at how some of the top notch global companies are using Hadoop in association with Python and are bearing fruits!

Amazon

Based on the consumer research and buying pattern, Amazon recommends suitable products to the existing users. This is done by a robust machine learning engine powered by Python, which seamlessly interacts with Hadoop ecosystem, aiding in delivering top of the line product recommendation system and boosting fault tolerant database interactions.

Facebook

In the domain of image processing, Facebook is second to none. Each day, Facebook processes millions and millions of images based on unstructured data – for that Facebook had to enable HDFS; it helps store and extract enormous volumes of data, while using Python as the backend language to perform a large chunk of its Image Processing applications, including Facial Image Extraction, Image Resizing, etc.

Rightfully so, Facebook relies on Python for all its image related applications and simulates Hadoop Streaming API for better accessibility and editing of data.

Quora Search Algorithm

Quora’s backend is constructed on Python; hence it’s the language used for interaction with HDFS. Also, Quora needs to manage vast amounts of textual data, thanks to Hadoop, Apache Spark and a few other data-warehousing technologies! Quora uses the power of Hadoop coupled with Python to drag out questions from searches or for suggestions.

2

End Notes

The use of Python is varied; being dynamically typed, portable, extendable and scalable, Python has become a popular choice for big data analysts specializing in Hadoop. Mentioned below are a couple of other notable industries where use cases of Hadoop using Python are to be found:


  • YouTube uses a recommendation engine built using Python and Apache Spark.
  • Limeroad functions on an integrated Hadoop, Apache Spark and Python recommendation system to retain online visitors through a proper, well-devised search pattern.
  • Iconic animation companies, like Disney depend on Python and Hadoop; they help manage frameworks for image processing and CGI rendering.


Now, you need to start thinking about arming yourself with big data hadoop certification course – these big data courses are quite in demand now – as it’s expected that the big data and business analytics market will increase from $130.1 billion to more than $203 billion by 2020.


This article first appeared on – www.analytixlabs.co.in/blog/2016/06/13/why-companies-are-using-hadoop-with-python


Interested in a career in Data Analyst?

To learn more about Data Analyst with Advanced excel course – Enrol Now.
To learn more about Data Analyst with R Course – Enrol Now.
To learn more about Big Data Course – Enrol Now.

To learn more about Machine Learning Using Python and Spark – Enrol Now.
To learn more about Data Analyst with SAS Course – Enrol Now.
To learn more about Data Analyst with Apache Spark Course – Enrol Now.
To learn more about Data Analyst with Market Risk Analytics and Modelling Course – Enrol Now.
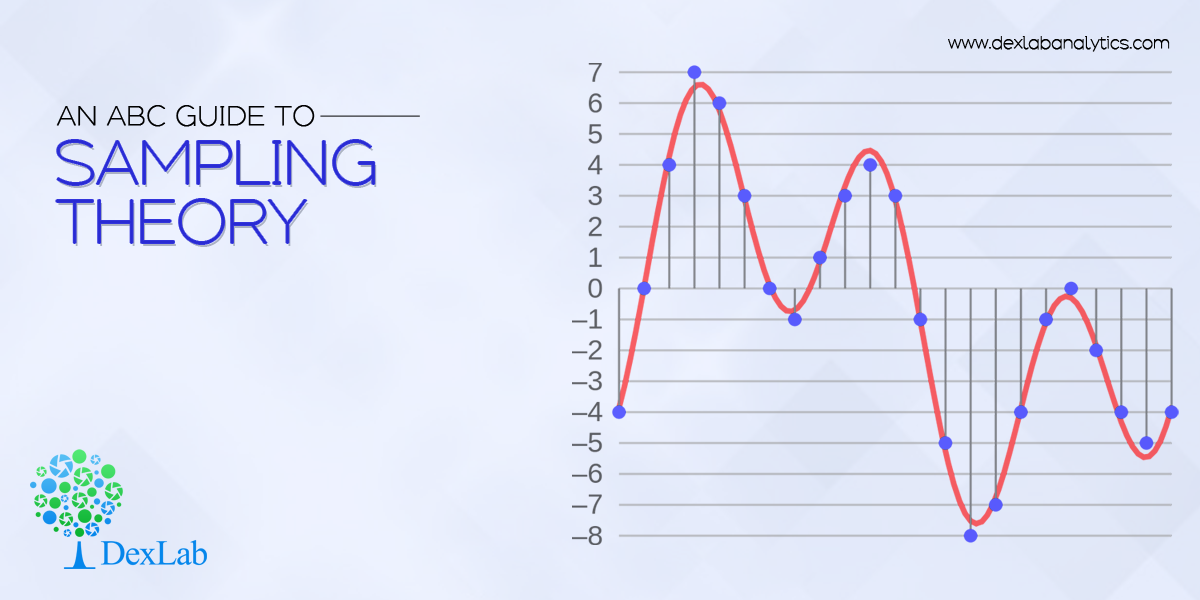
An ABC Guide to Sampling Theory

An ABC Guide to Sampling Theory

Sampling theory is a study involving collection, analysis and interpretation of data accumulated from random samples of a population. It’s a separate branch of statistics that observes the relationship existing between a population and samples drawn from the population.

In simple terms, sampling means the procedure of drawing a sample out of a population. It aids us to draw a conclusion about the characteristics of the population after carefully studying only the objects present in the sample.

Here we’ve whisked out a few sampling-related terms and their definitions that would help you understand the nuanced notion of sampling better. Let’s have a look:

Sample – It’s the finite representative subset of a population. It’s chosen from a population with an aim to scrutiny its properties and principles.

Population – When a statistical investigation focuses on the study of numerous characteristics involving items on individuals associated with a particular group, this group under study is known as the population or the universe. A group containing a finite number of objects is known as finite population, while a group with infinite or large number of objects is called infinite population.

Population parameter – It’s an obscure numerical factor of the population. It’s no brainer that the primary objective of a survey is to find the values of different measures of population distribution; and the parameters are nothing but a functional variant inclusive of all population units.

2

Estimator – Calculated based on sample values, an estimator is a functional measure.

Sampling fluctuation of an estimator – When you draw a particular sample from a given population, it contains different set of population members. As a result, the value of the estimator varies from one sample to another. This difference in values of the estimator is known as the sampling fluctuations of an estimator.

Next, we would like to discuss about the types of sampling:

There are mainly two types of random sampling, and they are as follows:

Simple Random Sampling with Replacement

In the first case, the ‘n’ units of the sample are drawn from the population in such a way that at each drawing, each of the ‘n’ numbers of the population gets the same probability 1⁄N of being selected. Hence, this methods is called the simple random sampling with replacement, clearly, the same unit of population may occur more than once inj a simple. Hence, there are N^n samples, regard being to the orders in which ‘n’ sample unit occur and each such sample has the probability 1/N^n .

Simple Random Sampling Without Replacement

In the second case each of the ‘n’ members of the sample are drawn one by one but the members once drawn are not returned back to the population and at each stage remaining amount of the population is given the same probability of being includes in the sample. This method of drawing the sample is called SRSWOR therefore under SRSWOR at any r^th number of draw there remains (N-r+1) units. And each unit has the probability of 1/((N-r+1) ) of being drawn.

Remember, if we take ‘n’ individuals at once from a given population giving equal probability to each of the observations, then the total number of possible example in (_n^N)C i.e.., combination of ‘n’ members out of ‘N’ numbers of the population will from the total no. of possible sample in SRSWOR.

The world of statistics is huge and intensively challenging. And so is sampling theory.

But, fret now. Our data science courses in Noida will help you understand the nuances of this branch of statistics. For more, visit our official site.  

P.S: This is our first blog of the series ‘sampling theory’. The rest will follow soon. Stay tuned.


Interested in a career in Data Analyst?

To learn more about Data Analyst with Advanced excel course – Enrol Now.
To learn more about Data Analyst with R Course – Enrol Now.
To learn more about Big Data Course – Enrol Now.

To learn more about Machine Learning Using Python and Spark – Enrol Now.
To learn more about Data Analyst with SAS Course – Enrol Now.
To learn more about Data Analyst with Apache Spark Course – Enrol Now.
To learn more about Data Analyst with Market Risk Analytics and Modelling Course – Enrol Now.

Call us to know more