credit risk analysis course in Delhi Archives - Page 2 of 3 - DexLab Analytics | Big Data Hadoop SAS R Analytics Predictive Modeling & Excel VBA

Role of Chief Risk Officers: From Managing Only Credit Risks to Playing Key Roles in Big Banks

Role of Chief Risk Officers: From Managing Only Credit Risks to Playing Key Roles in Big Banks

The job responsibilities of chief risk officers (CROs) have evolved drastically over the last two decades. CROs are playing key profitable roles is some of the world’s biggest banks. In the face of the global financial crisis, risk departments, particularly CROs, are handling many more tasks apart from what they were managing twenty years back, like modeling credit and market risks and avoiding fines and criminal investigations. The list of responsibilities entrusted to the CROs has grown exponentially since the last two decades. Operational risk that are quantifiable through capital necessities and penalties for nonconformity was actually developed from a set of unquantifiable ‘’other’’ risks.

2

Cyber risk:

In the present times, cyber risk has become one of the most pressing global problems that the risk departments need to cope with. The number of cyber hacks is on the rise, wreaking havoc on daily lives as well as social settings. For example, Bank of America and Wells Fargo were among the major institutes hit by the DDoS attack of 2012. It is one of the biggest cyber attacks till date, which affected nearly 80 million customers. In 2016, Swift hack was only a typo away from disrupting the global banking network.

‘’What is called ‘operational resilience’ has spun out of business continuity and operational risk, financial crime, technology and outsourcing risk- anything with risk in the title, somehow there is an expectation that it will gravitate to risk management as their responsibility,’’ says Paul Ingram, CRO of Credit Suisse International. The array of responsibilities for a CRO is so immense, including regulatory compliance, liquidity risk, counterparty risk, stress-test strategy, etc, that it is imperative for the CRO to be a part of the board of directors.

Previously, CROs reported to finance director; now they are present on the board itself. They are playing crucial roles in forming strategies and executing them, whereas around two decades ago they were only involved in risk control. The strategies should be such that the capital allocated by the board is utilized optimally, neither should the limits be exceeded nor should it be under-utilized. CROs add value to the business and are responsible for 360 degree risk assessment across the entire bank.

Banks are tackling problems like digital disruption, rising operational costs and increased competition from the non-banking sector. CROs play a crucial role in helping banks deal with these issues by making the best use of scarce resources and optimizing risk-return profiles.

Regulatory attack:

‘’Since the crisis, CROs have had their hands full implementing a vast amount of regulation,’’ says BCG’s Gerold Grasshoff. However, regulation has almost reached its apex, so CROs must now use their expertise to bring in more business for their institutions and help them gain a competitive advantage. CROs need to play active roles in finding links between the profits and losses of their businesses and balance sheets and regulatory ratios.

Risk departments were once the leaders in innovations pertaining to credit and market risk modeling. They must utilize the tactics that kept them at the forefront of innovation to help their institutions generate improved liquidity, asset and fund expenditure metrics. Their skill in spotting, checking and gauging risk is essential to provide risk-related counsel to clients. Risk departments can team up with Fintechs and regtechs to improve efficiencies in compliance and reporting sections and also enable digitizing specific risk operations.

Thus risk departments, especially CROs can add a lot of value to the banking infrastructure and help steer the institutes forward.

Credit risk modeling is an essential part of financial risk management. To develop the necessary knowledge required to model risks, enroll for credit risk analytics training at DexLab Analytics. We are the best credit risk modeling training institute in Delhi.


Interested in a career in Data Analyst?

To learn more about Machine Learning Using Python and Spark – click here.
To learn more about Data Analyst with Advanced excel course – click here.
To learn more about Data Analyst with SAS Course – click here.
To learn more about Data Analyst with R Course – click here.
To learn more about Big Data Course – click here.

How Fintechs Help Optimize the Operation of Banking Sector

How Fintechs Help Optimize the Operation of the Banking Sector

Financial technology- Fintech plays a key role in the rapidly evolving payment scenario. Fintech companies provide improved solutions that affect consumer behavior and facilitate widespread change in the banking sector. Changes in data management pertaining to the payment industry is occurring at a fast pace. Cloud-based solution and API technology (Application Programming Interfaces) has played a major role in boosting the start-up sector of online payment providers like PayPal and Stripe. As cited in a recent PwC report over 95% of traditional bankers are exploring different kinds of partnerships with Fintechs.

 Interpreting consumers’ spending behavior has enhanced payment and data security. Credit risk modeling help card providers identify fraudulent activities. The validity of a transaction can be checked using the GPS system in mobile phones. McKinsey, the consulting firm has identified that the banking sector can benefit the most from the better use of consumer and market data.  Technological advancements have led to the ease of analyzing vast data sets to uncover hidden patterns and trends. This smart data management system helps banks create more efficient and client-centric solutions. This will help banks to optimize their internal system and add value to their business relationship with customers.

Role of Big Data

 Over the past two years, the digital revolution has created more data than in the previous history of humankind. This data has wide-ranging applications such as the banks opening their credit lines to individuals and institutions with lesser-known credit-score and financial history. It provides insurance and healthcare services to the poor. It also forms the backbone of the budding P2P lending industry which is expected to grow at a compound annual growth rate (CAGR) of 48% year-on-year between 2016 and 2024.

The government has channelized the power of digital technologies like big data, cloud computing and advanced analytics to counter frauds and the nuisance of black money. Digital technologies also improve tax administration. Government’s analysis of GST data states that as on December 2017, there were 9.8 million unique GST registrations which are more than the total Indirect Tax registrations under the old system. In future big data will help in promoting financial inclusion which forms the rationale of the digital-first economy drive.

Small is becoming Conventional

Fintechs apart from simplifying daily banking also aids in the financial empowerment of new strata and players. Domains like cyber security, work flow management and smart contracts are gaining momentum across multiple sectors owing to the Fintech revolution. For example workflow management solution for MSMEs (small and medium enterprises) is empowering the industry which contributes to 30% of the country’s GDP. It also helps in the management of business-critical variables such as working capital, payrolls and vendor payments. Fintechs through their foreign exchange and trade solutions minimizes the time taken for banks to processing letter of credit (LC) for exporters. Similarly digitizing trade documents and regulatory agreements is crucial to find a permanent solution for the straggling export sector.

Let’s Take Your Data Dreams to the Next Level

Regulators become Innovators

According to the ‘laissez-faire’ theory in economics, the markets which are the least regulated are in fact the best-regulated. This is owing to the fact that regulations are considered as factors hindering innovations. This in turn leads to inefficient allocation of resources and chokes market-driven growth. But considering India’s evolving financial landscape this adage is fast losing its relevance. This is because regulators are themselves becoming innovators.

The Government of India has taken multiple steps to keep up with the global trend of innovation-driven business ecosystem. Some state-sponsored initiatives to fuel the innovative mindset of today’s generation are Startup India with an initial corpus of Rs 10,000 crore, Smart India Hackathon for crowd-sourcing ideas of specific problem statements, DRDO Cyber Challenge and India Innovation growth Program. This is what enabled the Indian government to declare that ‘young Indians will not be job seekers but job creators’ at the prestigious World Economic Forum (WEF).

From monitoring policies and promoting the ease of business, the role of the government in disruptive innovations has undergone a sea change. The new ecosystem which is fostering innovations is bound to see a plethora of innovations seizing the marketplace in the future. Following are two such steps:

  • IndiaStack is a set of application programming interface (APIs) developed around India’s unique identity project, Aadhaar. It allows governments, businesses, start-ups and developers to utilize a unique digital infrastructure to solve the nation’s problems pertaining to services that are paperless, presence-less and cashless.
  • NITI Ayog, the government’s think tank is developing Indiachain, the country’s largest block chain. Its vision is to reduce frauds, speed up enforcement of contracts, increase transparency of transactions and boost the agricultural economy of the country. There are plans to link Indiachain to IndiaStack and other digital identification databases.

As these initiatives start to unfold, India’s digital-first economy dream will soon be realized.

Advances in technologies like Retail Analytics and Credit Risk Modeling will take the guesswork and habit out of financial decisions. ‘’Learning’’ apps will not only learn the habit of users but will also engage users to improve their spending and saving decisions.

To know more about risk modeling follow Dexlab Analytics and take a look at their credit risk analytics and modeling training course.

Interested in a career in Data Analyst?

To learn more about Machine Learning Using Python and Spark – click here.
To learn more about Data Analyst with Advanced excel course – click here.
To learn more about Data Analyst with SAS Course – click here.
To learn more about Data Analyst with R Course – click here.
To learn more about Big Data Course – click here.

Breaking the Misconceptions: 4 Myths Regarding Data-Driven Financial Marketing

A majority of low-mid financial services companies toil under the wrong notion that owing to their capacity, size and scope, the complex data-driven marketing tactics are simply out of their reach – this is not true and frankly speaking quite a shame to consider even.

BREAKING THE MISCONCEPTIONS: 4 MYTHS REGARDING DATA-DRIVEN FINANCIAL MARKETING

Over the past decade, the whole concept of data analytics has undergone a massive transformation – the reason being an extensive democratization of marketing tactics. Today’s mid-size financial service providers can easily implement marketing initiatives used by dominant players without any glitch.

Besides, there are several other misconceptions regarding data and its effect on financial marketing that we hear so often and few of them are as follows:

2

Myth1 – Legally, banks are only allowed to run broad-based advertising

While it’s partially true that there are certain restrictions on banking institutions when it comes to target consumers, based on income, age, ethnicity and other factors, marketers can still practice an array of tactics, both online and offline.

Marketers can leverage a pool of data for online and offline marketing to formulate data models, keeping in mind the existing customers need and preferences. Once you have an understanding of their online behavior, how they use the data power to carry out transactions, these insights can be applied to attract new customers, who exhibit similar behaviors.

Myth 2 – Data-driven marketing doesn’t bolster customer relationship

It’s a fact, Millennials, especially wants to be aware about financial services and its associated products, and are keen to understand how can banks lend an additional support to their living and social life. Companies can start building relationship based out of it, while implementing data-driven marketing perspective into them.

Myth 3 – You need a huge budget and an encompassing database to drive marketing campaigns

Corporate honchos and digital natives certainly maintain sprawling in-house database to boost marketing activities, but don’t be under the impression that mid-size institutions cannot leverage much from virtual datamart. The impressive SaaS-based solutions houses first-party data, safely and securely and offer you mechanisms that let you integrate with other third-party data, both online and offline.

Datamarts let mid-size marketers achieve a lot of crucial task success. Firstly, you will be able to link online user IDs with offline data – this lets you derive insights about your current customers, including their intents, interests and other details. The most important thing is that it will usher you to build customer models that could target newer customers for your bank.

google-ads-1-72890

Myth 4 – Data-driven marketing is too much time-consuming

A lot of conventional marketers are of the opinion data-driven marketing is a huge concept – time-consuming and labor-intensive. But, that’s nothing but a myth. Hundreds and thousands of mid-size companies develop models, formulate offers and execute campaigns within a 30-day window using a cool datamart.

However, the design and execution part of campaigns need no time, whereas the learning part needs some time. You need to learn how to develop such intricate models, and that’s where time is involved.

To ace on financial models, get hands-on training from credit risk analysis course onlineDexLab Analytics offers superior credit risk management courses, along with data analytics, data science, python and R-Programming courses.

In the end, all that matters is prudent marketing campaigns powered by data yields better results than holding onto these misconceptions. So, break the shackles and embrace the power of data analytics.

The article has been sourced from – http://dataconomy.com/2017/08/5-misconceptions-data-driven-marketing


Interested in a career in Data Analyst?

To learn more about Machine Learning Using Python and Spark – click here.

To learn more about Data Analyst with Advanced excel course – click here.
To learn more about Data Analyst with SAS Course – click here.
To learn more about Data Analyst with R Course – click here.
To learn more about Big Data Course – click here.

How Credit Risk Modeling Is Used to Assess Credit Quality

Given the uproar on cyber crimes today, the issue of credit risk modeling is inevitable. Over the last few years, a wide number of globally recognized banks have initiated sophisticated systems to fabricate credit risk arising out of significant corporate details and disclosures. These adroit models are created with a sole intention to aid banks in determining, gauging, amassing and managing risk across encompassing business and product lines.


How Credit Risk Modeling Is Used to Assess Credit Quality


The more an institute’s portfolio expands better evaluation of individual credits is to be expected. Effective risk identification becomes the key factor to determine company growth. As a result, credit risk modeling backed by statistically-driven models and databases to support large volumes of data needs tends to be the need of the hour. It is defined as the analytical prudence that banks exhibit in order to assess the risk aspect of borrowers. The risk in question is dynamic, due to which the models need to assess the ability of a potential borrower if he can repay the loan along with taking a look at non-financial considerations, like environmental conditions, personality traits, management capabilities and more.

Continue reading “How Credit Risk Modeling Is Used to Assess Credit Quality”

Analyze the Risk of a Borrower with These Sure-fire Credit Risk Analytics Techniques

It’s a hard but true fact – no more do businesses survive without leverages. In a quest for success and expansion, they need to resort to debt, because equity alone fails to ensure survival. Be it funding a new project, fulfilling working capital requirement or expanding business operations, an organization needs funding for various corporate activities.


Analyze the Risk of a Borrower with These Sure-fire Credit Risk Analytics Techniques


Talking of India, the credit market scenario in here is not so matured in comparison to other developed countries; hence there exists an excessive dependency level on conventional banking structure. Nevertheless, raising finance from issuance of bonds by companies is also not so rare – majority of companies in need of capital raise money from bonds and shares and this practice is widely prevalent throughout the nation.

Continue reading “Analyze the Risk of a Borrower with These Sure-fire Credit Risk Analytics Techniques”

Credit Risk Modelling: A Basic Overview

Credit Risk Modelling: A Basic Overview

HISTORICAL BACKGROUND

The root cause for the Financial Crisis which stormed the globe in 2008 was the Sub-prime crisis which appeared in USA during late 2006. A sub-prime lending practice started in USA during 2003-2006. During the later parts of 2003, the housing sector started expanding and housing prices also increased. It has been shown that the housing prices were growing exponentially at that time. As a result, the housing prices followed a super-exponential or hyperbolic growth path. Such super-exponential paths for asset prices are termed as ‘bubbles’ So USA was riding a Housing price bubble. Now the bankers, started giving loans to the sub-prime segments. This segment comprised of customers who hardly had the eligibility to pay back the loans. However, since the loans were backed by mortgages bankers believed that with housing price increases the they could not only recover the loans but earn profits by selling off the houses. The expectations made by the bankers that asset prices always would ride the rising curve was erroneous. Hence, when the housing prices crashed the loans were not recoverable. Many banks sold off these loans to the investment banks who converted the loans into asset based securities. These assets based securities were disbursed all over the globe by the investments banks, the largest being done by Lehmann Brothers. When the underlying assets went valueless and the investors lost their investments, many of the investment banks collapsed. This caused the Financial Crisis and a huge loss of investors and tax-payers wealth. The involvement of Systematically Important Financial Institutions (SIFIs) and Globally Systematically Important Financial Institutions (G-SIFIs) into the frivolous lending process had amplified the intensity and the exposure of the crisis.

Understanding Credit Risk Management With Modelling and Validation – @Dexlabanalytics.

SYSTEMATICALLY IMPORTANT FINANCIAL INSTITUTIONS AND THEIR ROLE IN SYSTEMIC STABILITY

A Systematically Important Financial Institution (SIFI) is a bank, insurance company, or other financial institutions whose failure might trigger a financial crisis.

If a SIFI has the capacity to bring in a recession across the globe then it is known as a Globally Systematically Important Financial Institution (G-SIFI). The Basel Committee follows an indicator based approach for assessing the systematic importance of the G-SIFIs. The basic tenets of this approach are:

  1. The BASEL committee is of the view that the global systemic importance should be measured in terms of the impact that a failure of a bank can have on the global financial system and wider economy rather than the risk that the failure can occur. So, the concept is more of a global, system wide, loss given default (LGD) concept rather than a probability of default (PD) problem.
  2. The indicators reflect the following metrics: size of banks, their interconnectedness, the lack of availability of substitutable or financial institution infrastructure for provided services, their global activity, their complexity etc. Each of these are defined as:

(i) Cross-Jurisdiction: The indicator captures the global footprints of the banks. This indicator is divided into two activities: Cross Jurisdictional claims and Cross Jurisdictional liabilities. These two indicators measure the banks activities outside its home relative to overall activity of other banks’ in the sample. The greater the global reach of the bank, the more difficult is it to coordinate its resolution and the more widespread the spill over effects from its failure.

(ii) Size: Size of a bank is measured using the total exposure that it has globally. This is the exposure measure used to calculate Leverage ratio. BASEL III paragraph 157 uses a particular definition of exposure for this purpose. The score of each bank for this criterion is calculated as its amount of total exposure divided by the sum of total exposures of all banks in the sample.

(iii) Interconnectedness: Financial distress at one institution can materially raise the likelihood of distress at other institutions given the contractual obligations in which the firms operate. Interconnectedness is defined in terms of the following parameters: (a) Inter-financial system assets (b) Inter-financial system liabilities (c) The degree to which a bank funds itself from the other financial systems.

(iv) Complexity: The systemic impact of a bank’s distress or failure is expected to be positively related to its overall complexity. Complexity includes: business, structural and operational complexity. The more complex the bank is the greater are the costs and time needed to resolve the banks.

Given these characteristics, it was important to apply different restrictions to keep the lending practices of the banks under control. Frivolous lending done by such SIFIs had resulted in the financial crisis 2008-09. Post the crisis, regulators became more vigilant about maintaining appropriate reserves for banks to survive macroeconomic stress scenarios. Three major sources of risks to which banks are exposed to are: 1. Credit Risk 2. Market Risk 3. Operational Risk. Several regulations

have been imposed on banks to ensure that they are adequately capitalised. The major regulatory requirements to which banks need to be compliant with are:

  1. BASEL 2. Dodd Frank Act Stress Testing 3. Comprehensive Capital Adequacy Review.

Before looking into the Regulatory frameworks and their impact on the Credit Risk modelling, let us form an understanding of the framework of the Bank Capital.

Risk Management in a Commercial Lending Portfolio with Time Series and Small Datasets – @Dexlabanalytics.

CAPITAL STRUCTURE OF BANKS

The bank’s capital structure is comprised of two main components: 1. Equity Capital of Banks 2. Supplementary capital of banks. The Equity capital of banks are the purest form of banking capital. This is true or the actual capital that a bank has and it has been raised from the shareholders. The supplementary capital of banks comprises of estimated capital such as allowances, provisions etc. This portion of the capital can easily be tampered by the management to meet undue shareholders expectations or unnecessarily over reserve capital. Thus, there are strong capital norms and regulations around the supplementary capital. The two tiers of capital are: Tier1 and Tier2 capital. Tier1 capital is also decomposed into two parts: Tier1 Common capital and Tier1 capital.


Tier1 common capital = Common shareholder’s equity-goodwill-Intangibles. Goodwill and intangibles are no physical capital. In scenarios, where the goodwill and intangible assets are stressed, the capital in the banks would deteriorate. Therefore, they cannot be added to the company’s tier1 capital. Only the core or the physical amount of capital present in the bank account is the capital.

Tier1 Capital = Total Shareholders’ equity (Common + Preffered stocks) -goodwill -intangibles + Hybrid securities.

Tier 1 is the core equity capital for the bank. The components of Tier1 capital are common across all geographies for the banking system. Equity capital includes issued and fully paid equities. This is the purest form of capital that the bank has.

Tier2 Capital: tier 2 capital comprises of estimated reserves and provisions. This is the part of capital which is used to cushion against expected losses. Tier 2 capital has the following composition:Tier 2 = Subordinated debts +Allowances for Loans and lease losses + Provisions for bad debts -> This portion of the capital is reserved out of profits. Hence,

managers always try to under report these parameters to meet shareholder’s expectations. However, under reserving often poses the chances of bankruptcies or regulatory penalties. Total Capital of a Bank = Tier 1 capital + Tier 2 Capital

Explaining the Everlasting Bond between Data and Risk Analytics – @Dexlabanalytics.

CALCULATION OF CAPITAL RATIOS

Every bank faces three main types of risks: 1. Credit risk 2. Market Risk 3. Operational risk. Credit Risk is the risk that arises from lending out funds to borrowers, given their chances of defaulting on loans. Market Risk is the risk that the bank faces due to market fluctuations like stock price changes, interest rate risk and price level fluctuation etc. Operational risk occurs as a failure of the operational processes. The exposure of the banks to these risks differ from bank to bank. So the capital that they to set aside would differ based on the exposure to risk. Therefore, regulators have defined a metric called Risk Weighted Assets (RWA) to identify the exposure of the bank’s assets to risk. Every bank must keep aside their capital relative to the exposure of their asset to risk. The biggest advantage of RWAs is that they not only include On-balance sheet items but off-balance sheet items as well. Banks need to maintain their Tier1 common capital, tier1 capital and tier2 capital relative to their RWAs. Thus, arises the Capital ratios.


Total RWA = RWA for Credit Risk + RWA for Market Risk + RWA for Operational Risk

Tier1 Common Capital Ratio = tier1 common capital / RWA (CR + MR + OR)

Tier1 Capital Ratio = Tier1 Capital / RWA (CR+MR+OR)

Total Capital Ratio = Total capital/ RWA(CR+MR+OR)

Leverage Ratio = Tier1 Capital / Firms consolidated assets

Regulators require some critical cut-offs for each of these ratios:

Tier1 Common Capital Ratio > = 2% all times

Tier1 Ratio >= 4% all times

Tier 2 capital cannot exceed Tier1 capital

Leverage ratio > = 3% of all times.


In the next blog we explore how the credit risk models help in ensuring the capital adequacy of the banks and in the business risk management.


Looking for credit risk analysis course online? Drop by DexLab Analytics – it offers excellent credit risk analysis course at affordable rates.


Interested in a career in Data Analyst?

To learn more about Data Analyst with Advanced excel course – Enrol Now.
To learn more about Data Analyst with R Course – Enrol Now.
To learn more about Big Data Course – Enrol Now.

To learn more about Machine Learning Using Python and Spark – Enrol Now.
To learn more about Data Analyst with SAS Course – Enrol Now.
To learn more about Data Analyst with Apache Spark Course – Enrol Now.
To learn more about Data Analyst with Market Risk Analytics and Modelling Course – Enrol Now.

The Basics Of The Banking Business And Lending Risks:

The Basics Of The Banking Business And Lending Risks:

Banks, as financial institutions, play an important role in the economic development of a nation. The primary function of banks had been to channelize the funds appropriately and efficiently in the economy. Households deposit cash in the banks, which the latter lends out to those businesses and households who has a requirement for credit. The credit lent out to businesses is known as commercial credit(Asset Backed Loans, Cash flow Loans, Factoring Loans, Franchisee Finance, Equipment Finance) and those lent out to the households is known as retail credit(Credit Cards, Personal Loans, Vehicle Loans, Mortgages etc.). Figure1 below shows the important interlinkages between the banking sector and the different segments of the economy:

Untitled

Figure 1: Inter Linkages of the Banking Sector with other sectors of the economy

Banks borrow from the low-risk segment (Deposits from household sector) and lend to the high-risk segment (Commercial and retail credit) and the profit from lending is earned through the interest differential between the high risk and the low risk segment. For example: There are 200 customers on the books of Bank XYZ who deposit $1000 each on 1st January, 2016. These borrowers keep their deposits with the bank for 1 year and do not withdraw their money before that. The bank pays 5% interest on the deposits plus the principal to the depositors after 1 year. On the very same day, an entrepreneur comes asking for a loan of $ 200,000 for financing his business idea. The bank gives away the amount as loan to the entrepreneur at an interest rate of 15% per annum, under the agreement that he would pay back the principal plus the interest on 31st December, 2016. Therefore, as on 1st January, 2016 the balance sheet on Bank XYZ is:

dexlab-01

Consider two scenarios:

Scenario 1: The Entrepreneur pays off the Principal plus the interest to the bank on 31st December, 2016

This is a win – win situation for all. The pay-offs were as follows:


Entrepreneur: Met the capital requirements of his business through the funding he obtained from the bank.

Depositors: The depositors got back their principal, with the interest (Total amount = 1000 + 0.05 * 1000 = 1050).

Bank: The bank earned a net profit of 10%. The profit earned by the bank is the Net Interest Income = Interest received – Interest Paid (= $30,000 – $10000 = $20,000).

Credit Risk Analytics and Regulatory Compliance – An Overview – @Dexlabanalytics.

Scenario2: The Entrepreneur defaults on the loan commitment on 31st December, 2016

This is a drastic situation for the bank!!!! The disaster would spread through the following channel:


Entrepreneur: Defaults on the whole amount lent.

Bank: Does not have funds to pay back to the depositors. Hence, the bank has run into liquidity crisis and hence on the way to collapse!!!!!!

Depositors: Does not get their money back. They lose confidence on the bank.


Only way to save the scene is BAILOUT!!!!!

2

The Second Scenario highlighted some critical underlying assumptions in the lending process which resulted in the drastic outcomes:

Assumption1: The Entrepreneur (Obligor) was assumed to be a ‘Good’ borrower. No specific screening procedure was used to identify the affordability of the obligor for the loan.

Observation: The sources of borrower and transaction risks associated with an obligor must be duly assessed before lending out credit. A basic tenet of risk management is to ensure that appropriate controls are in place at the acquisition phase so that the affordability and the reliability of the borrower can be assessed appropriately. Accurate appraisal of the sources of an obligor’s origination risk helps in streamlining credit to the better class of applicants.

Assumption2: The entire amount of the deposit was lent out. The bank was over optimistic of the growth opportunities. Under estimation of the risk and over emphasis on growth objectives led to the liquidation of the bank.

Observation: The bank failed to keep back sufficient reserves to fall back up on, in case of defaults. Two extreme lending possibilities for a bank are: a. Bank keeps 100% reserves and lends out 0%, b. Bank keeps 0% and lends out 100%. Under the first extreme, the bank does not grow at all. Under the second extreme (which is the case here!!!) the bank runs a risk of running into liquidation in case of a default. Every bank must solve an optimisation problem between risk and growth opportunities.

The discussion above highlights some important questions on lending and its associated risks:


  1. What are the different types of risks associated with the lending process of a bank?
  2. How can the risk from lending to different types of customers be identified?
  3. How can the adequate amount of capital to be reserved by banks be identified?


The answers to these questions to be discussed in the subsequent blogs.

Stay glued to our site for further details about banking structure and risk modelling. DexLab Analytics offers a unique module on Credit Risk Modelling Using SAS. Contact us today for more details!


Interested in a career in Data Analyst?

To learn more about Data Analyst with Advanced excel course – Enrol Now.
To learn more about Data Analyst with R Course – Enrol Now.
To learn more about Big Data Course – Enrol Now.

To learn more about Machine Learning Using Python and Spark – Enrol Now.
To learn more about Data Analyst with SAS Course – Enrol Now.
To learn more about Data Analyst with Apache Spark Course – Enrol Now.
To learn more about Data Analyst with Market Risk Analytics and Modelling Course – Enrol Now.
The Opportunities and Challenges in Credit Scoring with Big Data

The Opportunities and Challenges in Credit Scoring with Big Data

Within the past few decades, the banking institutions have collected plenty of data in order to describe the default behaviour of their clientele. Good examples of them are historical data about a person’s date of birth, their income, gender, status of employment etc. the whole of this data has all been nicely stored into several huge databases or data warehouses (for e.g. relational).

And on top of all this, the banks have accumulated several business experiences about their crediting products. For instance, a lot of credit experts have done a pretty swell job at discriminating between low risk and high risk mortgages with the use of their business mortgages, thereby making use of their business expertise only. It is now the goal of all credit scoring to conduct a detailed analysis of both the sources of data into a more detailed perspective with then come up with a statistically based decision model, which allows to score future credit applications and then ultimately make a decision about which ones to accept and which to reject.

With the surfacing of Big Data it has created both chances as well as challenges to conduct credit scoring. Big Data is often categorised in terms of its four Vs viz: Variety, Velocity, Volume, and Veracity. To further illustrate this, let us in short focus into some key sources or processes, which will generate Big Data.  

The traditional sources of Big Data are usually large scale transactional enterprise systems like OLTP (online Transactional Processing), ERP (Enterprise Resource Processing) and CRM (Customer Relationship Management) applications. The classical credit is generally constructed using the data extracted from these traditional transactional systems.

However, the online graphing is more recent example. Simply think about the all the major social media networks like, Weibo, Wechat, Facebook, Twitter etc. All of these networks together capture the information about close to two billion people relating to their friends preferences and their other behaviours, thereby leaving behind a huge trail of digital footprint in the form of data.

Also think about the IoT (the internet of things) or the emergence of the sensor enable ecosystems which is going to link the various objects (for e.g. cars, homes etc) with each other as well as with other humans. And finally, we get to see a more and more transparent or public data such as the data about weather, maps, traffic and the macro-economy. It is a clear indication that all of these new sources of generating data will offer a tremendous potential for building better credit scoring models.

The main challenges:

The above mentioned data generating processes can all be categorised in terms of their sheer volume of the data which is being created. Thus, it is evident that this poses to be a serious challenge in order to set up a scalable storage architecture which when combined with a distributed approach to manipulate data and query will be difficult.

Big Data also comes with a lot of variety or in several other formats. The traditional data or the structured data, such as customer name, their birth date etc are usually more and more complementary with unstructured data such as images, tweets, emails, sensor data, Facebook pages, GPS data etc. While the former may be easily stored in traditional databases, the latter needs to be accommodated with the use of appropriate database technology thus, facilitating the storage, querying and manipulation of each of these types of unstructured data. Also it requires a lot of effort since it is thought to be that at least 80 percent of all data in unstructured.

The speed at which data is generated is the velocity factor and it is at that perfect speed that it must be analysed and stored. You can imagine the streaming applications like on-line trading platforms, SMS messages, YouTube, about the credit card swipes and other phone calls, these are all examples of high velocity data and form an important concern.

Veracity which is the quality or trustworthiness of the data, is yet another factor that needs to be considered. However, sadly more data does not automatically indicate better data, so the quality of data being generated must be monitored closely and guaranteed.

So, in closing thoughts as the velocity, veracity, volume, and variety keeps growing, so will the new opportunities to build better credit scoring models.     

Looking for credit risk modelling courses? Take up our credit risk management course online or classroom-based from DexLab Analytics and get your career moving….


Interested in a career in Data Analyst?

To learn more about Data Analyst with Advanced excel course – Enrol Now.
To learn more about Data Analyst with R Course – Enrol Now.
To learn more about Big Data Course – Enrol Now.

To learn more about Machine Learning Using Python and Spark – Enrol Now.
To learn more about Data Analyst with SAS Course – Enrol Now.
To learn more about Data Analyst with Apache Spark Course – Enrol Now.
To learn more about Data Analyst with Market Risk Analytics and Modelling Course – Enrol Now.

Understanding Credit Risk Management With Modelling and Validation

The term credit risk encompasses all types of default risks that are associated with different financial instruments such as – (like for example, a debtor has not met his or her legal duties according to the debt contract), migrating risk (arises from adverse movements internally or externally with the ratings) and country risks (the debtor cannot pay as per the duties because of measure or events taken by political or monetary agencies of the country itself).

In compliance to Basel Regulations, most banks choose to develop their own credit risk measuring parameters: Probability Default (PD), Loss Given Default (LGD), and Exposure at Default (EAD). Several MNCs have gathered solid experience by developing models for the Internal Ratings Based Approach (IRBA) for different clients.

For implementation of these Credit Risk Assessment parameters, we need the following data analytics and visualization tools:

  • SAS Credit Risk modelling for banking
  • SA Enterprise miner and SAS Credit scoring
  • Matlab
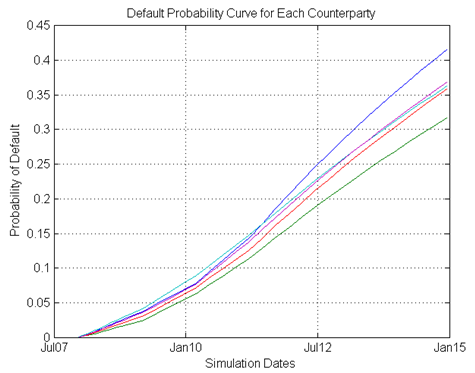
Default Probability Curve for Each Counterparty
                                                                               Image Source: businessdecision.be

Credit and counterparty risk validating:

The models that are built for the computation of risks must be revalidated on a regular basis.

On one hand, the second pillar of the Basel regulations implies that supervisors should check that their risk models are working consistently for optimum results. On the other hand, recent crises have drawn the focus of the stakeholders of the banks (business, CRO) to a higher interest on the models.

The process of validation includes in a review of the development process and all the related aspects of model implementation. The process can be divided into two parts:

  1. Quality control is mainly concerned about the ongoing monitoring of the model in use, the quality of the input variables, judgemental decisions and the resulting output models.
  2. Quantitatively with backresting, we can statistically compare the periodic risk parameters with its actual outcomes.

In the context of credit risk, the process of validation is concerned with three main parameters they are – probability of default (PD), exposure at default (EAD) and the loss given default (LGD). And for all of the above mentioned three a complete backresting is done at the three levels:

  1. Discriminatory power: this is the ability of the model to differentiate between defaults, non-defaults, or between high-losses and low losses.
  2. Power of prediction: this is a checking using comparison between defaults and non-defaults, or between high losses and low losses.
  3. Stability: is the portfolio change between the time when the model was first developed and now.

In the below three X three matrix (parameter X level) each and every component has had one or more standardized tests to process. With the right Credit Risk Modelling training an individual can implement all the above tests and provide for the needful reporting of the same.

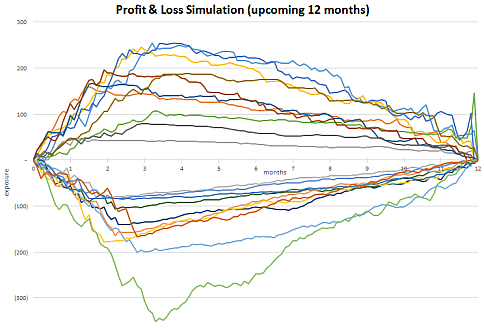
In terms of the counterparty credit risk context, one must consider the uncertainty of exposure and the bilateral nature of the risk associated. Hence, exposure at the default can be replaced by the EPE (expected positive exposure) and EEPE (effective expected positive exposure).

The test include comparing the observed P&L with the EEPE (make sure the violations are moderate and the pass rate does not exceed a predetermined level for instance 70%).

Deep Learning and AI using Python

For better visualization, here is an example of the same:

For better visualization, here is an example of the same:
                                                                  Image Source: businessdecision.be

Risk models:

As per the National Bank of Belgium, which is he Belgian regulator (NBB), it insists that appropriate conservative measures should be incorporated to compensate for the discrepancies of the value and risk models. For example, as per the NBB requisites there should be an assessment of the model risk, which is based on the inventory of:

  1. The risk that model covers, along with an assessment of the quality of the results calculated by the model (maturity of the model, adequacy of assumptions made, weaknesses and limitations of the model, etc) and the improvements that are planned to be included over time.
  2. The risks that are not yet be covered by the model along with an assessment of the materiality of these risks and their process of handling the same.
  3. The elements that are covered by a general modelling method along with the entities that are covered by a more simplified method, or the ones that are not covered at all.

A quality Credit Risk Management Course can provide you with the necessary functional and technical knowledge to assess the model risk.


Interested in a career in Data Analyst?

To learn more about Data Analyst with Advanced excel course – Enrol Now.
To learn more about Data Analyst with R Course – Enrol Now.
To learn more about Big Data Course – Enrol Now.

To learn more about Machine Learning Using Python and Spark – Enrol Now.
To learn more about Data Analyst with SAS Course – Enrol Now.
To learn more about Data Analyst with Apache Spark Course – Enrol Now.
To learn more about Data Analyst with Market Risk Analytics and Modelling Course – Enrol Now.
Call us to know more