This is a blog which shall widen your approach on the Statistical Application using R & Python. You perhaps already have been calculating Geometric Mean using R & Python and are already aware of the Application of Harmonic Mean using R & Python. However, if you are eager to further your knowledge about Skewness & Kurtosis and interested to know of their application using R and Python, then this is the right place.
Skewness:
Skewness is a metric which tells us about the location of my dataset. That is, if you want to know where most of the values are concentrated on an ascending scale.
Skewness is of two kinds: Positive skew and Negative skew. A positively skewed dataset will have most of the values concentrated at the beginning of the scale. Eg: If a woman is asked to rate 100 tinder profiles based on the looks on a scale of 1 – 10, 1 being the ugliest and 10 being the most handsome. Then the resulting ratings will be positively skewed. This is to say that women are harsh critiques of looks.
Now, consider another example: Say if the wealth of the 1% richest people were to be plotted on a scale of say $0 – $200 billion. Then, most of the values will be concentrated at the end of the scale. This will be an example of a negatively skewed dataset.
In essence, skewness is the third central moment about mean and gives us a feel for the location of the data set values. It is recommended to go through STATISTICAL APPLICATION IN R & PYTHON: CHAPTER 1 – MEASURE OF CENTRAL TENDENCY to have an understanding of the Central Tendency and its measures. Having no skewness will mean the data set is fairly symmetrical and has a bell shaped curve.
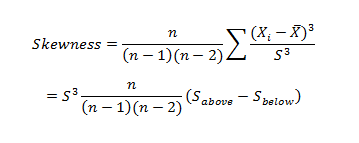
Where n is the sample size, Xi is the ith X value, X is the average and S is the sample standard deviation. Note the exponent in the summation. It is “3”.

Kurtosis:
Kurtosis is a statistical measure that’s used to describe, or Skewness, of observed data around the mean, sometimes referred to as the volatility to volatility. Kurtosis is used generally in the statistical field to describe trends in charts. Kurtosis can be present in a chart with fat tails and a low, even distribution, as well as be present in a chart with skinny tails and a distribution concentrated toward the mean.
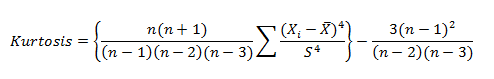
Kurtosis for a normal distribution is 3. Most software packages use the formula:
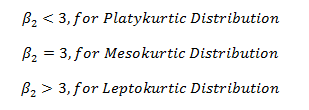
The types of kurtosis are:-

Application:
A person tries to analyze last 12months interest rate of the investment firm to understand the risk factor for the future investment.
The interest rates are:
12.05%, 13%, 11%, 18%, 10%, 11.5%, 15.08%, 21%, 6%, 8%, 13.2%, 7.5%.
Here is the table:
Months (One Year) | Interest Rate (%) |
| April | 12.05 |
| May | 13 |
| June | 11 |
| July | 18 |
| August | 10 |
| September | 11.5 |
| October | 15.08 |
| November | 21 |
| December | 6 |
| January | 8 |
| February | 13.2 |
| March | 7.5 |

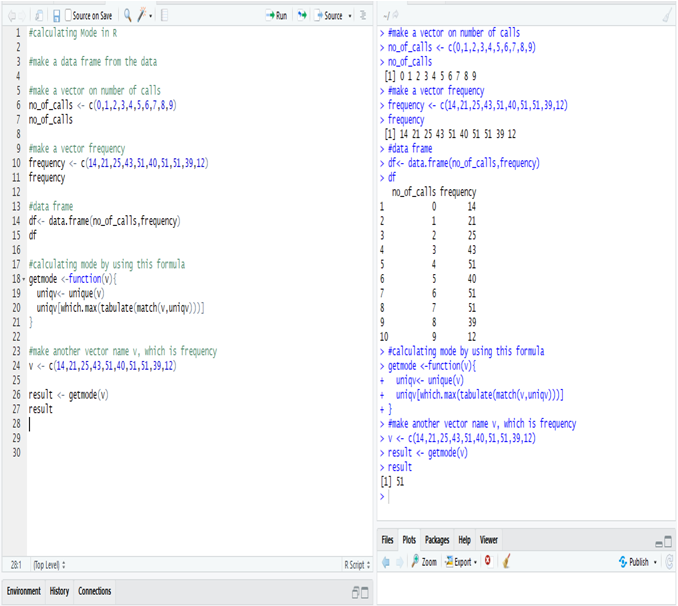
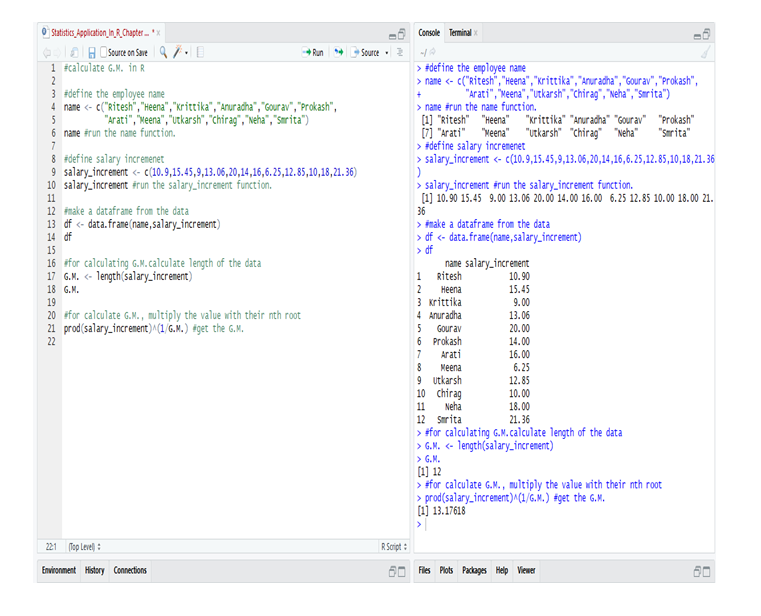
Calculate skewness & Kurtosis in R:
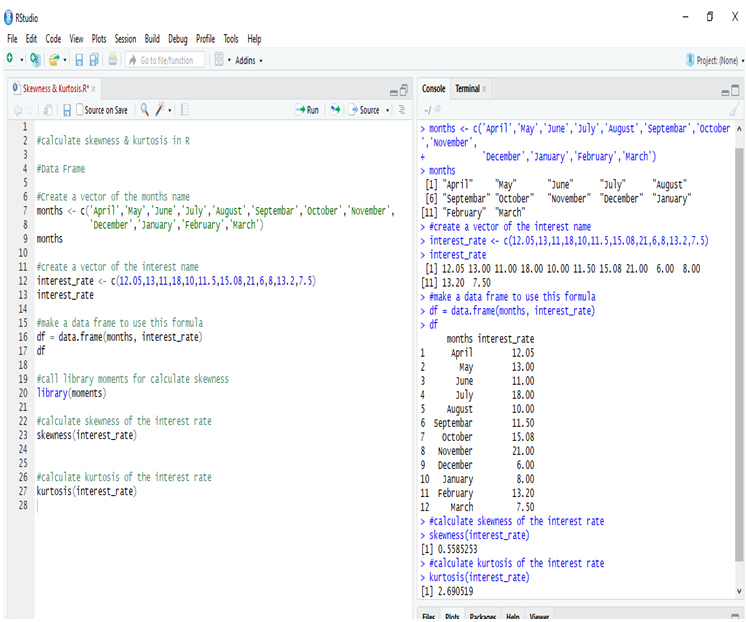
Calculating the Skewness & Kurtosis of interest rate in R, we get the positive skewed value, which is near to 0. The skewness of the interest rate is 0.5585253.
The kurtosis of the interest rate is 2.690519
Kurtosis is less than 3, so this is Platykurtic distribution.
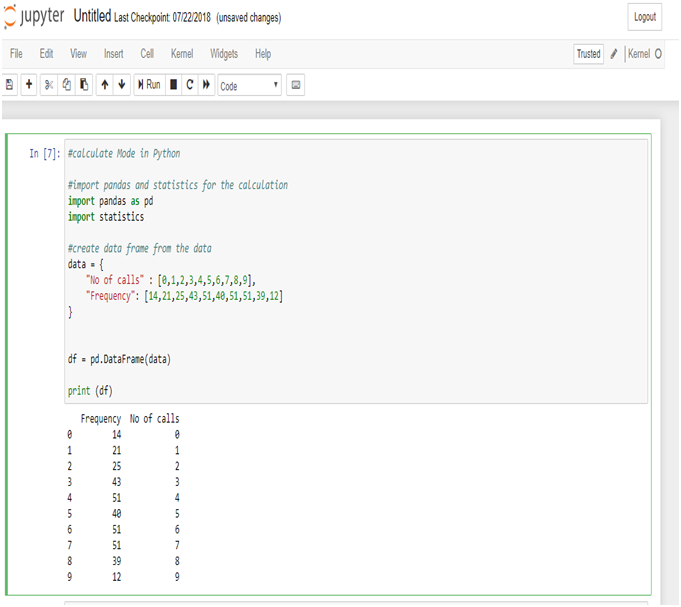
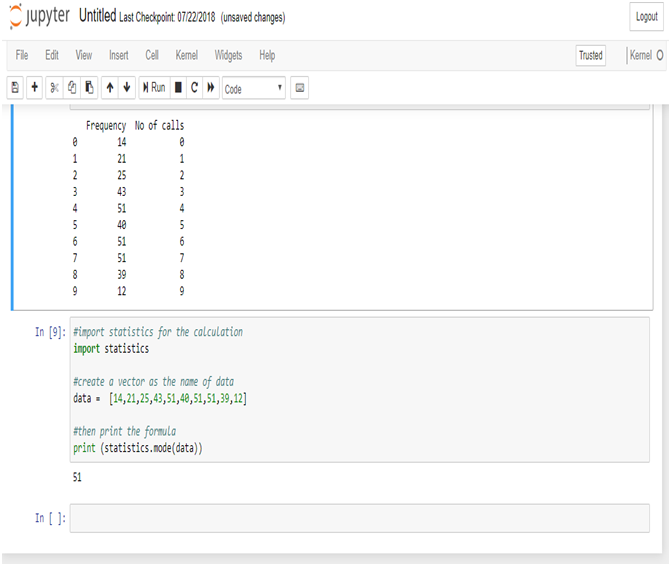
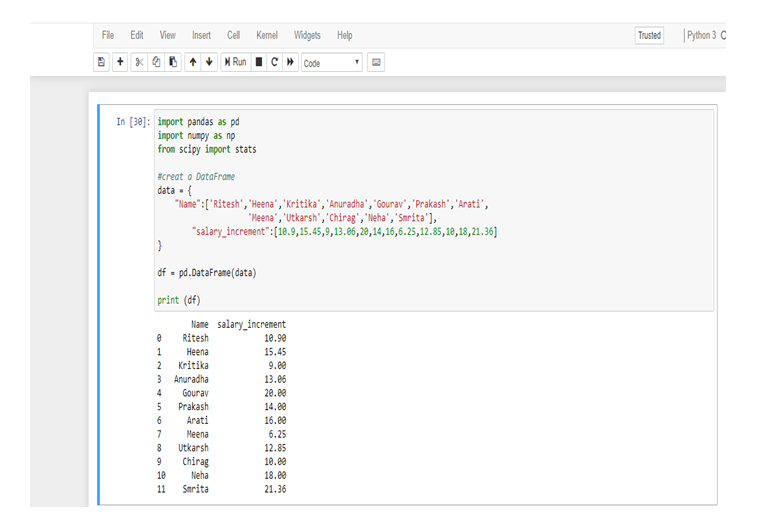
Calculate Skewness & Kurtosis in Python:
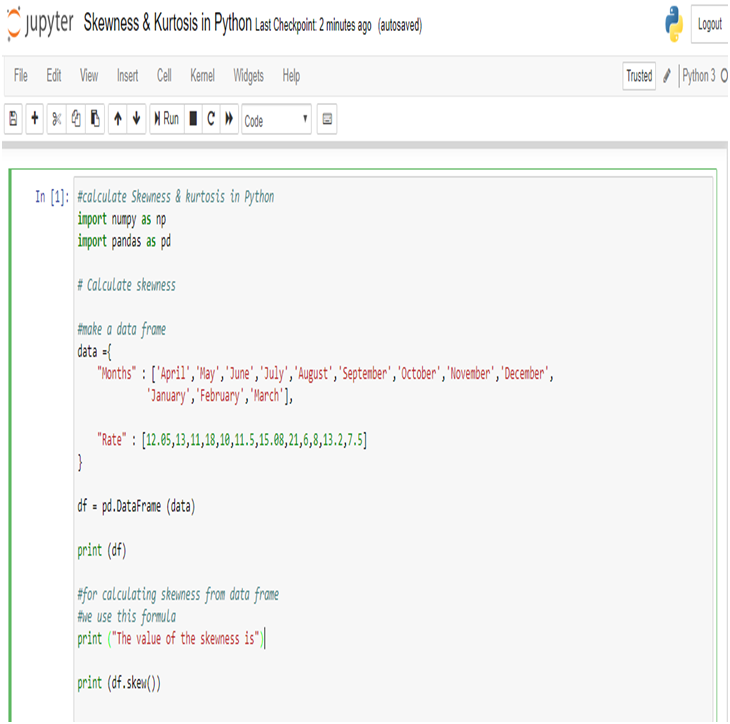
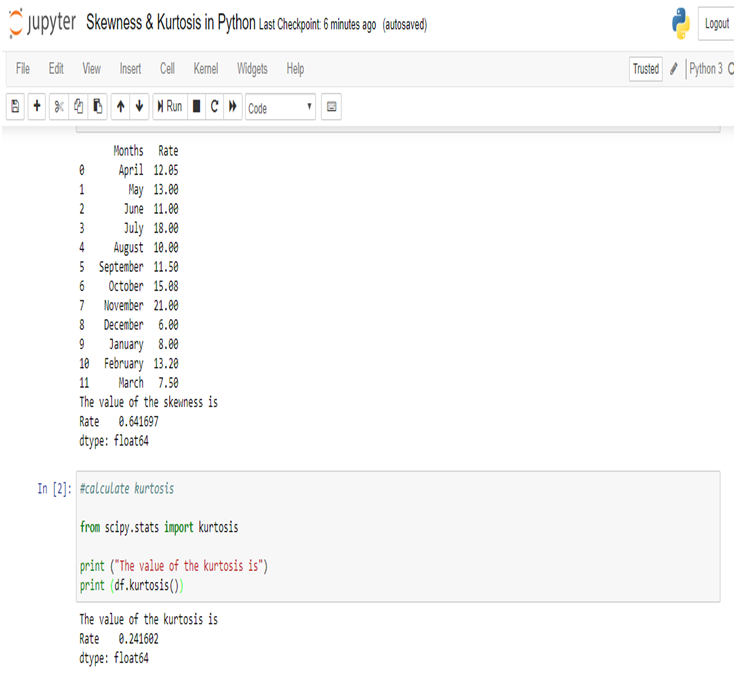
Calculating the Skewness & Kurtosis of interest rate in Python, we get the positive skewed value and near from 0. The skewness of the interest rate is 0.641697.
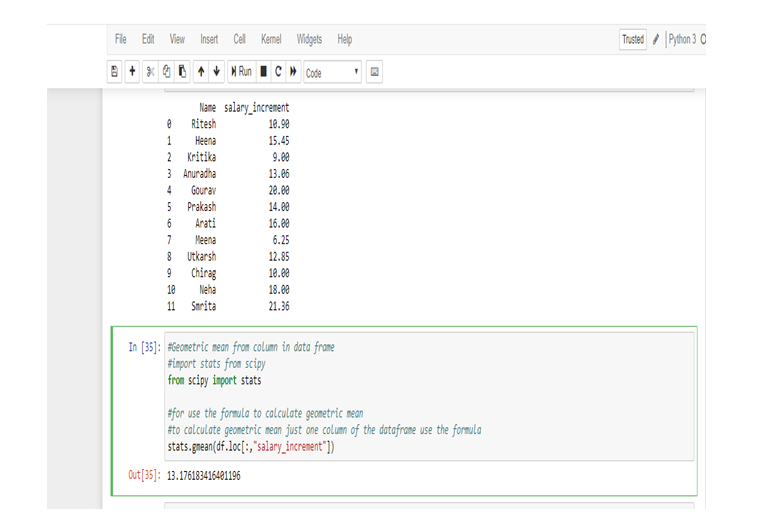
The kurtosis of the interest rate is 0.241602.
Kurtosis is less than 3, so this is Platykurtic distribution.
Conclusion:
Firstly, according to the output of the data the value is positively skewed(R & Python), positive skewness indicates a distribution with an asymmetric tail extending toward more positive values.
And the kurtosis is less than 3 (R & Python), it is a platykurtic distribution. Positive kurtosis indicates a relatively peaked distribution. And the distribution is light tails.
Secondly, the value of the skewness and kurtosis are different in R and Python, but the actual effects are more or less the same. The results are different because skewness and kurtosis are calculated with different formulae or method for the measurement like Bowley’s measure, Pearson’s(First, Second) measures, Fisher’s measure & Moment’s measure. And different software (ex. R, Python, SAS, Excel etc) using different processes to calculate skewness & kurtosis brings the same ultimate result. The numerical values change only when the numbers are also changed. So, we sometimes get different results.

There are numerous other blogs that you can follow with Dexlab Analytics. Also, if you want to explore computer vision course Python, neural network machine learning Python and more extensive courses on R & Python, then you can also join us and boost both your passion and career.
Interested in a career in Data Analyst?
To learn more about Data Analyst with Advanced excel course – Enrol Now.
To learn more about Data Analyst with R Course – Enrol Now.
To learn more about Big Data Course – Enrol Now.To learn more about Machine Learning Using Python and Spark – Enrol Now.
To learn more about Data Analyst with SAS Course – Enrol Now.
To learn more about Data Analyst with Apache Spark Course – Enrol Now.
To learn more about Data Analyst with Market Risk Analytics and Modelling Course – Enrol Now.