computer vision course python Archives - DexLab Analytics | Big Data Hadoop SAS R Analytics Predictive Modeling & Excel VBA

5 Ways Artificial Intelligence Will Impact Our Future

5 Ways Artificial Intelligence Will Impact Our Future

Artificial Intelligence, or, its more popular acronym AI is no longer a term to be read about in a sci-fi book, it is a reality that is reshaping the world by introducing us to virtual assistants, helping us be more secure by enabling us with futuristic measures. The evolution of AI has been pretty consistent and as we are busy navigating through a pandemic-ridden path towards the future, adapting to the “new normal”, and becoming increasingly reliant on technology, AI assumes a greater significance.

The AI applications which are already being implemented has resulted in a big shift, causing an apprehension that the adoption of AI technology on a larger scale would eventually lead to job cuts, whereas in reality, it would lead to the creation of new jobs across industries. Adoption of AI technology would push the demand for a workforce that is highly skilled, enrolling in an artificial intelligence course in delhi could be a timely decision.

Now that we are about to reach the end of 2020, let us take a look at the possible impacts of AI in the future.

AI will create more jobs

Yes, contrary to the popular apprehension AI would end up creating jobs in the future. However, the adoption of AI to automate tasks means yes, there would be a shift, and a job that does not need special skills will be handled by AI powered tools. Jobs that could be done without error, completed faster, with a higher level of efficiency, in short better than humans could be performed by robots. However, with that being said there would be more specialized job roles, remember AI technology is about the simulation of human intelligence, it is not the intelligence, so there would be humans in charge of carrying out the AI operated areas to monitor the work. Not just that but for developing smarter AI application and implementation there should be a skilled workforce ready, a report by World Economic Forum is indicative of that. From design to maintenance, AI specialists would be in high demand especially the developers. The fourth industrial revolution is here, industries are gearing up to build AI infrastructure, it is time to smell the coffee as by the end of 2022 there will be millions of AI jobs waiting for the right candidates.

Dangerous jobs will be handled by robots

In the future, hazardous works will be handled by robots. Now the robots are already being employed to handle heavy lifting tasks, along with handling the mundane ones that require only repetition and manual labor. Along with automating these tasks, the robot workforce can also handle the situation where human workers might sustain grave injuries. If you have been aware and interested then you already heard about the “SmokeBot”. In the future, it might be the robots who will enter the flaming buildings for assessment before their human counterparts can start their task. Manufacturing plants that deal with toxic elements need robot workers, as humans run a bigger risk when they are exposed to such chemicals. Furthermore, the nuclear plants might have a robot crew that could efficiently handle such tasks. Other areas like pipeline exploration, bomb defusing, conducting rescue operations in hostile terrain should be handled by AI robots.

Smarter healthcare facilities

 AI  implementation which has already begun would continue to transform the healthcare services. With AI being in place CT scan and MRI images could be more precise pointing out even minuscule changes that earlier went undetected. Drug development could also be another area that would see vast improvement and in a post-pandemic world, people would need to be better prepared to fight against such viruses. Real-time detection could prevent many health issues going severe and keeping a track of the health records preventive measures could be taken. One of the most crucial changes that could be revolutionary, is the personalized medication which could only be driven by AI technology. This would completely change the way healthcare functions. Now that we are seeing chat bots for handling sales queries, the future healthcare landscape might be ruled by virtual assistants specifically developed for offering assistance to the patients. There are going to be revolutionary changes in this field in the future, thereby pushing the demand for professionals skilled in deep learning for computer vision with python.

Smarter finance

We are already living in an age where we have robo advisors, this is just the beginning and the growing AI implementation would enable an even smarter analytics system that would minimize the credit risk and would allow banks and other financial institutes to minimize the risk of fraud. Smarter asset management, enhanced customer support are going to be the core features. Smarter ML algorithms would detect any and every oddity in behavior or in transactions and would help prevent any kind of fraud from happening. With analytics being in place it would be easier to predict the future trends and thereby being more efficient in servicing the customers. The introduction of personalized services is going to be another key feature to look out for.

Data Science Machine Learning Certification

Retail space gets a boost

The retailers are now aiming to implement AI applications to  offer smart shopping solutions to the future buyers. Along with coming up with personalized shopping suggestions for the customers and showing them suggestions based on their shopping pattern, the retailers would also be using the AI to predict the future trends and work accordingly. Not just that but they can easily maintain the supply and demand balance with the help of AI solutions and stock up items that are going to be in demand instead of items that would not be trendy. The smarter assistants would ensure that the customer queries are being handled and they could also be helping them with shopping by providing suggestions and information. From smart marketing to smarter delivery, the future of retail would be dominated by AI as the investment in this space is gradually going up.

The future is definitely going to be impacted by the AI technology in more ways than one. So, be future ready and get yourself upskilled as it is the need of the hour, stay updated and develop the skill to move towards the AI future with confidence.


.
How Computer Vision Technology Is Empowering Different Industries?

How Computer Vision Technology Is Empowering Different Industries?

Computer vision is an advanced branch of AI that revolves around the concept of object recognition and smart classification of objects in images or, videos. This is indeed a revolutionary innovation that aims to simulate the way human vision is trained to identify and classify objects. Studying deep learning for computer vision course can help gain specialized knowledge in this field. The growing application of computer vision across industries is now opening up multiple career avenues.

The application of computer vision is changing different industries:

Healthcare

In healthcare computer vision technology is adding efficiency to medical imaging procedures such as MRI. Detecting even the smallest of oddity is now possible which ensures accurate diagnosis. In departments like radiology, cardiology,  computer vision techniques are gradually being adopted. Not just that, during surgical procedures too computer vision can offer cutting edge solutions. A case in point here would be Gauss Surgical’s blood monitoring system that analyzes the amount of blood loss during surgery.

Automotive

The self-driving cars are no longer a sci-fi theme, but, a hardcore reality, computer vision technology analyzes the road conditions, detects humans crossing the road, objects as well as road signs and lane changes. There are advanced systems that aim to prevent accidents that run on the same technology and could also signal if the driver behind the wheel is not awake, thus saving lives in real-time.

Manufacturing

The manufacturing industry is reaping benefits of computer vision technology in so many ways. Using computer vision the equipment condition can be monitored and measures could be taken accordingly to prevent untimely breakdown. Maintaining production quality also gets easier with computer vision application as even the smallest defect in a product or, on the packaging could be detected which might get missed by human eyes. Not just that but, even the labels could be efficiently screened to detect printing errors.

Agriculture

In the field of agriculture, computer vision technology is helping maintain quality and adding efficiency. Using drones to monitor the crops is getting easier, not just that but computer vision technology is helping farmers separate crops as per quality and decide which crop could be stored for a long time. Livestock monitoring is another job that could be efficiently handled using computer vision technology.  However, one significant application is perhaps using computer vision to detect crops that are infected and need pesticide.

Military applications

Computer vision can add an edge to modern warfare, its adoption in the military surely indicate that. Autonomous vehicles powered with computer vision techniques can save so many lives, especially when deployed during battles. Not just that, but detecting landmines, or, enemy, both high-risk yet extremely important operations can be handled successfully by adopting computer vision techniques. Image sensors could deliver the intelligence the military think-tank needs to take timely decisions.

Surveillance

Surveillance is a highly crucial area that could immensely benefit from computer vision applications. In shops preventing crimes like shoplifting could become easier, as the cameras could easily detect any kind of suspicious behavior and activity going on in the shop premises. Another factor to consider here would be the application of facial recognition to identify miscreants from videos.

Data Science Machine Learning Certification

Computer vision technology is changing the way we look at our world, and with further research, there would be smarter products on the market that can truly transform our lives by allowing us to be more efficient. For someone aspiring to make a career in this promising domain should undergo computer vision course python training.


.

5 Most Powerful Computer Vision Techniques in use

5 Most Powerful Computer Vision Techniques in use

Computer Vision is one of the most revolutionary and advanced technologies that deep learning has birthed. It is the computer’s ability to classify and recognize objects in pictures and even videos like the human eye does. There are five main techniques of computer vision that we ought to know about for their amazing technological prowess and ability to ‘see’ and perceive surroundings like we do. Let us see what they are.

Image Classification

The main concern around image classification is categorization of images based on viewpoint variation, image deformation and occlusion, illumination and background clutter. Measuring the accuracy of the description of an image becomes a difficult task because of these factors. Researchers have come up with a novel way to solve the problem.

They use a data driven approach to classify the image. Instead of classifying what each image looks like in code, they feed the computer system with many image classes and then develop algorithms that look at these classes and “learn” about the visual appearance of each class. The most popular system used for image classification is Convolutional Neural Networks (CNNs).

Object Detection

Object detection is, simply put, defining objects within images by outputting bounding boxes and labels or tags for individual objects. This differs from image classification in that it is applied to several objects all at once rather than identifying just one dominant object in an image. Now applying CNNs to this technique will be computationally expensive.

So the technique used for object detection is region-based CNNs of R-CNNs. In this technique, first an image is scanned for objects using an algorithm that generates hundreds of region proposals. Then a CNN is run on each region proposal and only then is each object in each region proposal classified. It is like surveying and labelling the items in a warehouse of a store.

Object Tracking

Object tracking refers to the process of tracking or following a specific object like a car or a person in a given scene in videos. This technique is important for autonomous driving systems in self-driving cars. Object detection can be divided into two main categories – generative method and discriminative method.

The first method uses the generative model to describe the evident characteristics of objects. The second method is used to distinguish between object and background and foreground.

Semantic Segmentation

Crucial to computer vision is the process of segmentation wherein whole images are divided or segmented into pixelgroups that are subsequently labeled and classified.

The science tries to understand the role of each pixel in the image. So, for instance, besides recognizing and detecting a tree in an image, its boundaries are depicted as well. CNNs are best used for this technique.

Instance Segmentation

This method builds on semantic segmentation in that instead of classifying just one single dominant object in an image, it labels multiple images with different colours.

When we see complicated images with multiple overlapping objects and different backgrounds, we apply instance segmentation to it. This is done to generate pixel studies of each object, their boundaries and backdrops.

Data Science Machine Learning Certification

Conclusion

Besides these techniques to study and analyse and interpret images or a series of images, there are many more complex techniques that we have not delved into in this blog. However, for more on computer vision, you can peruse the DexLab Analytics website. DexLab Analytics is a premiere Deep Learning training institute In Delhi.


.

Computer Vision and Image Classification -A study

Computer Vision and Image Classification -A study

Computer vision is the field of computer science that focuses on replicating parts of the complexity of the human vision system and enabling computers to identify and process objects in images and videos in the same way that humans do. With computer vision, our computer can extract, analyze and understand useful information from an individual image or a sequence of images. Computer vision is a field of artificial intelligence that works on enabling computers to see, identify and process images in the same way that human vision does, and then provide the appropriate output.
Initially computer vision only worked in limited capacity but due to advance innovations in deep learning and neural networks, the field has been able to take great leaps in recent years and has been able to surpass humans in some tasks related to detecting and labeling objects.

The Contribution of Deep Learning in Computer Vision

While there are still significant obstacles in the path of human-quality computer vision, Deep Learning systems have made significant progress in dealing with some of the relevant sub-tasks. The reason for this success is partly based on the additional responsibility assigned to deep learning systems.

It is reasonable to say that the biggest difference with deep learning systems is that they no longer need to be programmed to specifically look for features. Rather than searching for specific features by way of a carefully programmed algorithm, the neural networks inside deep learning systems are trained. For example, if cars in an image keep being misclassified as motorcycles then you don’t fine-tune parameters or re-write the algorithm. Instead, you continue training until the system gets it right.

With the increased computational power offered by modern-day deep learning systems, there is steady and noticeable progress towards the point where a computer will be able to recognize and react to everything that it sees.

Application of Computer Vision

The field of Computer Vision is too expansive to cover in depth.  The techniques of computer vision can help a computer to extract, analyze, and understand useful information from a single or a sequence of images. There are many advanced techniques like style transfer, colorization, action recognition, 3D objects, human pose estimation, and much more but in this article we will only focus on the commonly used techniques of computer vision. These techniques are: –

  • Image Classification
  • Image Classification with Localization
  • Object Segmentation
  • Object Detection

So in this article we will go through all the above techniques of computer vision and we will also see how deep learning is used for the various techniques of computer vision in detail. To avoid confusion we will distribute this article in a series of multiple blogs. In first blog we will see the first technique of computer vision which is Image Classification and we will also explore that how deep learning is used in Image Classification.

Data Science Machine Learning Certification

Image Classification

Image classification is the process of predicting a specific class, or label, for something that is defined by a set of data points. Image classification is a subset of the classification problem, where an entire image is assigned a label. Perhaps a picture will be classified as a daytime or nighttime shot. Or, in a similar way, images of cars and motorcycles will be automatically placed into their own groups.

There are countless categories, or classes, in which a specific image can be classified. Consider a manual process where images are compared and similar ones are grouped according to like-characteristics, but without necessarily knowing in advance what you are looking for. Obviously, this is an onerous task. To make it even more so, assume that the set of images numbers in the hundreds of thousands. It becomes readily apparent that an automatic system is needed in order to do this quickly and efficiently.

There are many image classification tasks that involve photographs of objects. Two popular examples include the CIFAR-10 and CIFAR-100 datasets that have photographs to be classified into 10 and 100 classes respectively.

Deep learning for Image Classification

The deep learning architecture for image classification generally includes convolutional layers, making it a convolutional neural network (CNN). A typical use case for CNNs is where you feed the network images and the network classifies the data. CNNs tend to start with an input “scanner” which isn’t intended to parse all the training data at once. For example, to input an image of 100 x 100 pixels, you wouldn’t want a layer with 10,000 nodes.

Rather, you create a scanning input layer of say 10 x 10 which you feed the first 10 x 10 pixels of the image. Once you passed that input, you feed it the next 10 x 10 pixels by moving the scanner one pixel to the right. This technique is known as sliding windows.

Following Layers are used to build Convolutional Neural Networks:

  • INPUT [32x32x3] will hold the raw pixel values of the image, in this case an image of width 32, height 32, and with three color channels R,G,B.
  • CONV layer will compute the output of neurons that are connected to local regions in the input, each computing a dot product between their weights and a small region they are connected to in the input volume. This may result in volume such as [32x32x12] if we decided to use 12 filters.
  • RELU layer will apply an element wise activation function, such as the max(0,x)max(0,x)thresholding at zero. This leaves the size of the volume unchanged ([32x32x12]).
  • POOL layer will perform a downsampling operation along the spatial dimensions (width, height), resulting in volume such as [16x16x12].
  • FC (i.e. fully-connected) layer will compute the class scores, resulting in volume of size [1x1x10], where each of the 10 numbers correspond to a class score, such as among the 10 categories of CIFAR-10. As with ordinary Neural Networks and as the name implies, each neuron in this layer will be connected to all the numbers in the previous volume.

Output of the Model History

In this way, ConvNets transform the original image layer by layer from the original pixel values to the final class scores. Note that some layers contain parameters and other don’t. In particular, the CONV/FC layers perform transformations that are a function of not only the activations in the input volume, but also of the parameters (the weights and biases of the neurons). On the other hand, the RELU/POOL layers will implement a fixed function. The parameters in the CONV/FC layers will be trained with gradient descent so that the class scores that the ConvNet computes are consistent with the labels in the training set for each image.

Conclusion

The above content focuses on image classification only and the architecture of deep learning used for it. But there is more to computer vision than just classification task. The detection, segmentation and localization of classified objects are equally important. We will see these in next blog.


Interested in a career in Data Analyst?

To learn more about Data Analyst with Advanced excel course – Enrol Now.
To learn more about Data Analyst with R Course – Enrol Now.
To learn more about Big Data Course – Enrol Now.

To learn more about Machine Learning Using Python and Spark – Enrol Now.
To learn more about Data Analyst with SAS Course – Enrol Now.
To learn more about Data Analyst with Apache Spark Course – Enrol Now.
To learn more about Data Analyst with Market Risk Analytics and Modelling Course – Enrol Now.

A Handbook of the Basic Data Types in Python 3: Strings

A Handbook of the Basic Data Types in Python 3: Strings

In general, a data type defines the format, sets the upper & lower bounds of the data so that a program could use it appropriately. Data types are the classification or categorization of data items which describes the character of a variable. The most used data types are numeric, non-numeric and Boolean (true/false).

Python has the following standard Data Types:

  • Booleans
  • Numbers
  • String
  • List
  • Tuple
  • Set
  • Dictionary

Mutable and Immutable Objects

Data objects of the above types are stored in a computer’s memory for processing. Some of these values can be modified during processing, but the contents of the others can’t be altered once they are created in the memory.

Number values, strings, and tuple are immutable, which means their contents can’t be altered after creation.

On the other hand, the collection of items in a List or Dictionary object can be modified. It is possible to add, delete, insert, and rearrange items in a list or dictionary. Hence, they are mutable objects.

Booleans

A Boolean is such a data type that almost every programming language has, and so does Python. Boolean in Python can have two values – True or False. These values can be used for assigning and comparison.

Numbers

Numbers are one of the most prominent Python data types. In Numbers, there are mainly 3 types which include Integer, Float, and Complex.

String

A sequence of one or more characters enclosed within either single quotes ‘or double quotes” is considered as String in Python. Any letter, a number or a symbol could be a part of the string. Multi-line strings can be represented using triple quotes,”’ or “””.

Data Science Machine Learning Certification

List

Python list is an array-like construct which stores a heterogeneous collection of items of varied data typed objects in an ordered sequence. It is very flexible and does not have a fixed size. The Index in a list begins with a zero in Python.

Tuple

A tuple is a sequence of Python objects separated by commas. Tuples are immutable, which means tuples once created cannot be modified. Tuples are defined using parentheses ().

Set

A set is an unordered collection of items. Set is defined by values separated by a comma inside braces { }. Amongst all the Python data types, the set is one which supports mathematical operations like union, intersection, symmetric difference etc. Since the set derives its implementation from the “Set” in mathematics, so it can’t have multiple occurrences of the same element.

Dictionary

A dictionary in Python is an unordered collection of key-value pairs. It’s a built-in mapping type in Python where keys map to values. These key-value pairs provide an intuitive way to store data. To retrieve the value we must know the key. In Python, dictionaries are defined within braces {}.

This article is about one specific data type, which is a string. The String is a sequence of characters enclosed in single (”) or double quotation (“”) marks.

Here are examples of creating strings in Python.

Counting Number of Characters Using LEN () Function

The LEN () built-in function counts the number of characters in the string.

Creating Empty Strings

Although variables S3 and S4 do not contain any characters they are still valid strings. S3 and S4 both represent empty strings here.

We can verify this fact by using the type () function.

String Concatenation

String concatenation means joining one or more strings together. To concatenate strings in Python we use + operator.

String Repetition Operator (*)

Just like in numbers, * operator can also be used with strings. When used with strings * operator repeats the string n number of times. Its general format is: 1 string * n,

where n is a number of type int.

Membership Operators – in and not in

The in or not in operators are used to check the existence of a string inside another string. For example:

Indexing in a String

In Python, characters in a string are stored in a sequence. We can access individual characters inside a string by using an index.

An index refers to the position of a character inside a string. In Python, strings are 0 indexed. This means that the first character is at index 0; the second character is at index 1 and so on. The index position of the last character is one less than the length of the string.

To access the individual characters inside a string we type the name of the variable, followed by the index number of the character inside the square brackets [].

Instead of manually counting the index position of the last character in the string, we can use the LEN () function to calculate the string and then subtract 1 from it to get the index position of the last character.

We can also use negative indexes. A negative index allows us to access characters from the end of the string. Negative index starts from -1, so the index position of the last character is -1, for the second last character it is -2 and so on.

Slicing Strings

String slicing allows us to get a slice of characters from the string. To get a slice of string we use the slicing operator. Its syntax is:

str_name[start_index:end_index]

str_name[start_index:end_index] returns a slice of string starting from index start_index to the end_index. The character at the end_index will not be included in the slice. If end_index is greater than the length of the string then the slice operator returns a slice of string starting from start_index to the end of the string. The start_index and end_index are optional. If start_index is not specified then slicing begins at the beginning of the string and if end_index is not specified then it goes on to the end of the string. For example:

Apart from these functionalities, there are so many built-in methods for strings which make the string as the useful data type of Python. Some of the common built-in methods are as follows: –

capitalize ()

Capitalizes the first letter of the string

join (seq)

Merges (concatenates) the string representations of elements in sequence seq into a string, with separator string.

lower ()

Converts all the letters in a string that are in uppercase to lowercase.

max (str)

Returns the max alphabetical character from the string str.

min (str)

Returns the min alphabetical character from the string str.

replace (old, new [, max])

Replaces all the occurrences of old in a string with new or at most max occurrences if max gave.

 split (str=””, num=string.count(str))

Splits string according to delimiter str (space if not provided) and returns list of substrings; split into at most num substrings if given.

upper()

Converts lowercase letters in a string to uppercase.

Conclusion

So in this article, firstly, we have seen a brief introduction of all the data types of python. Later in this article, we focused on the strings. We have seen several Python operations on strings as well as the most common useful built-in methods of strings.

Python is the language of the present age, wherein almost every field there is a need for Python. For example, Python for data analysisMachine Learning Using Python has been easy and comprehensible than they were ever before. Thus, if you are also interested in Python and looking for promising courses Computer Vision Course PythonRetail Analytics using PythonNeural Network Machine Learning Python, then get in touch with Dexlab Analytics now and step into the world of opportunities!


Interested in a career in Data Analyst?

To learn more about Data Analyst with Advanced excel course – Enrol Now.
To learn more about Data Analyst with R Course – Enrol Now.
To learn more about Big Data Course – Enrol Now.

To learn more about Machine Learning Using Python and Spark – Enrol Now.
To learn more about Data Analyst with SAS Course – Enrol Now.
To learn more about Data Analyst with Apache Spark Course – Enrol Now.
To learn more about Data Analyst with Market Risk Analytics and Modelling Course – Enrol Now.

Python Statistics Fundamentals: How to Describe Your Data? (Part II)

Python Statistics Fundamentals: How to Describe Your Data? (Part II)

In the first part of this article, we have seen how to describe and summarize datasets and how to calculate types of measures in descriptive statistics in Python. It’s possible to get descriptive statistics with pure Python code, but that’s rarely necessary.

Python is an advanced programming language extensively used in all of the latest technologies of Data Science, Deep Learning and Machine learning. Furthermore, it is particularly responsible for the growth of the Machine Learning course in IndiaMoreover, numerous courses like Deep Learning for Computer vision with Python, Text Mining with Python course and Retail Analytics using Python are pacing up with the call of the age. You must also be in line with the cutting-edge technologies by enrolling with the best Python training institute in Delhi now, not to regret it later.

In this part, we will see the Python statistics libraries which are comprehensive, popular, and widely used especially for this purpose. These libraries give users the necessary functionality when crunching data. Below are the major Python libraries that are used for working with data.

Data Science Machine Learning Certification

NumPy and SciPy – Fundamental Scientific Computing

NumPy stands for Numerical Python. The most powerful feature of NumPy is the n-dimensional array. This library also contains basic linear algebra functions, Fourier transforms, advanced random number capabilities. NumPy is much faster than the native Python code due to the vectorized implementation of its methods and the fact that many of its core routines are written in C (based on the CPython framework).

For example, let’s create a NumPy array and compute basic descriptive statistics like mean, median, standard deviation, quantiles, etc.

SciPy stands for Scientific Python, which is built on NumPy. NumPy arrays are used as the basic data structure by SciPy.

Scipy is one of the most useful libraries for a variety of high-level science and engineering modules like discrete Fourier transforms, Linear Algebra, Optimization and Sparse matrices. Specifically in statistical modelling, SciPy boasts of a large collection of fast, powerful, and flexible methods and classes. It can run popular statistical tests such as t-test, chi-square, Kolmogorov-Smirnov, Mann-Whitney rank test, Wilcoxon rank-sum, etc. It can also perform correlation computations, such as Pearson’s coefficient, ANOVA, Theil-Sen estimation, etc.

Pandas – Data Manipulation and Analysis

Pandas library is used for structured data operations and manipulations. It is extensively used for data preparation. The DataFrame() function in Pandas takes a list of values and outputs them in a table. Seeing data enumerated in a table gives a visual description of a data set and allows for the formulation of research questions on the data.

The describe() function outputs various descriptive statistics values, except for the variance. The variance is calculated using the var() function in Pandas.

The mean() function, returns the mean of the values for the requested axis.

Matplotlib – Plotting and Visualization

Matplotlib is a Python library for creating 2D plots. It is used for plotting a wide variety of graphs, starting from histograms to line plots to heat plots. One can use Pylab feature in IPython notebook (IPython notebook –pylab = inline) to use these plotting features inline. If the inline option is ignored, then pylab converts IPython environment to an environment, very similar to Matlab.

matplotlib.pylot is a collection of command style functions.

If a single list array is provided to the plot() command, matplotlib assumes it is a sequence of Y values and internally generates the X value for you.

Each function makes some change to a figure, like creating a figure, creating a plotting area in a figure, decorating the plot with labels, etc. Now, let us create a very simple plot for some given data, as shown below:

Scikit-learn – Machine Learning and Data Mining

Scikit-learn built on NumPy, SciPy and matplotlib. Scikit-learn is the most widely used Python library for classical machine learning. But, it is necessary to include it in the discussion of statistical modeling as many classical machine learning (i.e. non-deep learning) algorithms can be classified as statistical learning techniques. This library contains a lot of efficient tools for machine learning and statistical modeling including classification, regression, clustering and dimensional reduction.

Conclusion

In this article, we covered a set of Python open-source libraries that form the foundation of statistical modelling, analysis, and visualization. On the data side, these libraries work seamlessly with the other data analytics and data engineering platforms, such as Pandas and Spark (through PySpark). For advanced machine learning tasks (e.g. deep learning), NumPy knowledge is directly transferable and applicable in popular packages such as TensorFlow and PyTorch. On the visual side, libraries like Matplotlib, integrate nicely with advanced dashboarding libraries like Bokeh and Plotly.


https://pandas.pydata.org/pandas-docs/stable/reference/api/pandas.DataFrame.html


Interested in a career in Data Analyst?

To learn more about Data Analyst with Advanced excel course – Enrol Now.
To learn more about Data Analyst with R Course – Enrol Now.
To learn more about Big Data Course – Enrol Now.

To learn more about Machine Learning Using Python and Spark – Enrol Now.
To learn more about Data Analyst with SAS Course – Enrol Now.
To learn more about Data Analyst with Apache Spark Course – Enrol Now.
To learn more about Data Analyst with Market Risk Analytics and Modelling Course – Enrol Now.

Python Statistics Fundamentals: How to Describe Your Data? (Part I)

Python Statistics Fundamentals: How to Describe Your Data?

Statistics is a branch of mathematics which deals with the collection, analysis, interpretation and presentation of masses of numerical data. Statistics is a tool used to communicate our understanding of data. It helps us understand the world better, make assertions, and communicate our confidence in the statements we are making.

Two main statistical methods are used in data analysis:

  1. Descriptive statistics: This method is used to summarize data from a sample using measures such as the mean or standard deviation
  2. Inferential statistics: With this method, you can conclude data that are subject to random variation (e.g., observational errors, sampling variation).

This article is about the descriptive statistics which are used to describe and summarize the datasets. We are also going to see the available Python libraries to get those numerical quantities.

This whole topic will be covered in a series of two blogs. This first blog is about the types of measures in descriptive statistics. Furthermore, we will also see the built-in Python “Statistics” library, which has a relatively small number of the most important statistics functions.

Descriptive statistics can be defined as the measures that summarize a given data, and these measures can be broken down further into the measures of central tendency and the measures of dispersion. Measures of central tendency include mean, median, and the mode, while the measures of dispersion include standard deviation and variance.

We will cover the following topics in descriptive statistics:

  • Measures of Central Tendency
  1. Mean
  2. Median
  3. Mode
  • Measures of Dispersion
  1. Variation
  2. Standard Deviation

First, we need to import the Python statistics module.

Mean

The arithmetic mean is the sum of data divided by the number of data-points. It is a measure of the central location of data in a set of values that vary in range. In Python, we usually do this by dividing the sum of given numbers with the count of the number present. Python mean function can be used to calculate the mean/average of the given list of numbers. It returns the mean of the data set passed as parameters.

mean( ): Arithmetic mean (“average”) of data.

harmonic_mean( ): It is the reciprocal of the arithmetic mean of the reciprocals of the data (say for three numbers a, b and c, 1/mean = 3/(1/a + 1/b + 1/c)).

Median

median( ): Median or middle value of data is calculated as the mean of middle two. When the number of data points is odd, the middle data point is returned. The median is a robust measure of a central location and is less affected by the presence of outliers in your data compared to the mean.

median_low( ): Low median of data is calculated when the number of data points is odd. Here the middle value is usually returned. When it is even, the smaller of the two middle values is returned.

median_high( ): High median of data is calculated when the number of data points is odd. Here, the middle value is usually returned. When it is even, the larger of the two middle values is returned.

Mode

mode( ): Mode (most common value) of discrete data. The mode (when it exists) is the most typical value and is a robust measure of central location.

Measures of Dispersion

Measures of dispersion are statistics that describe how data varies, usually relative to the typical value. While measures of centre give us an idea of the typical value, measures of spread give us a sense of how much the data tends to diverge from the typical value.

These following functions (from the statistics module in python) calculate a measure of how much the population or sample tends to deviate from the typical or average values.

Data Science Machine Learning Certification

Population Variance

pvariance( ): Returns the population variance of data. Use this function to calculate the variance from the entire population. To estimate the variance from a sample, the variance ( ) function is usually a better choice. When called with the entire population, this gives the population variance σ². When called on a sample instead, this is the biased sample variance s², also known as variance with N degrees of freedom.

Population Standard Deviation

pstdev( ): Return the population standard deviation (the square root of the population variance)

Sample Variance

variance ( ): Returns the sample variance of data, an iterable of at least two real-valued numbers. Variance, or second moment about the mean, is a measure of the variability (spread or dispersion) of data. A large variance indicates that the data is spread out; a small variance indicates it is clustered closely around the mean. If the optional second argument is given to the function, it should be the mean of data. This is the sample variance s² with Bessel’s correction, also known as variance with N-1 degrees of freedom.

Sample Standard Deviation

stdev( ): Returns the sample standard deviation (the square root of the sample variance)

Conclusion

So, this article focuses on describing and summarizing the datasets, also helping you to calculate numerical quantities in Python. It’s possible to get descriptive statistics with pure Python code, but that’s rarely necessary. In the next series of this blog we will see the Python statistics libraries which are comprehensive, popular, and widely used especially for this purpose.


Interested in a career in Data Analyst?

To learn more about Data Analyst with Advanced excel course – Enrol Now.
To learn more about Data Analyst with R Course – Enrol Now.
To learn more about Big Data Course – Enrol Now.

To learn more about Machine Learning Using Python and Spark – Enrol Now.
To learn more about Data Analyst with SAS Course – Enrol Now.
To learn more about Data Analyst with Apache Spark Course – Enrol Now.
To learn more about Data Analyst with Market Risk Analytics and Modelling Course – Enrol Now.

Statistical Application in R & Python: Negative Binomial Distribution

Statistical Application in R & Python: Negative Binomial Distribution

Negative binomial distribution is a special case of Binomial distribution. If you haven’t checked the Exponential Distribution, then read through the Statistical Application in R & Python: EXPONENTIAL DISTRIBUTION.

It is important to know that the Negative Binomial distribution could be of two different types, i.e. – Type 1 and Type 2. In many ways, it could be seen as a generalization of the geometric distribution. The Negative Binomial Distribution essentially operates on the same principals as the binomial distribution but the objective of the former is to model for the success of an event happening in “n” number of trials. Here it is worth observing that the Geometric distribution models for the first success whereas a Negative Binomial distribution models for the Kth 

Data Science Machine Learning Certification

This is explained below.

Type 1 Binomial distribution  aims to model the trails up to and including the “kth success” in “n number of trials”. To give a simple example, imagine you are asked to predict the probability that the fourth person to hear a gossip will believe that! This kind of prediction could be made using the negative binomial type 1 distribution. 

Conversely, Type 2 Binomial distribution is used to model the number of failures before the “kth success”. To give an example, imagine you are asked about how many penalty kicks it will take before a goal is scored by a particular football player. This could be modeled using a negative binomial type 2 distribution, which might be pretty tricky or almost impossible with any other methods.

The probability distribution function is given below: 

In the next section, we will take you through its practical application in Python and R. 

Application:

Mr. Singh works in an Insurance Company where his target is to sale a minimum of five policies in a day. On a particular day, he had already sold 2 policies after numerous attempts. The probability of sales on each policy is 0.6. Now, if the policies may be considered as independent Bernoulli trials, then:

  1. What is the probability that he has exactly 4 failed attempts before his 3rd successful sales of the day?
  2. What is the probability that he was fewer than 4 failed attempts before his 3rd successful sales of the day?

So, the number of sales = 3.

The probability of failed attempts is 4.

The success of each sale is 0.6.

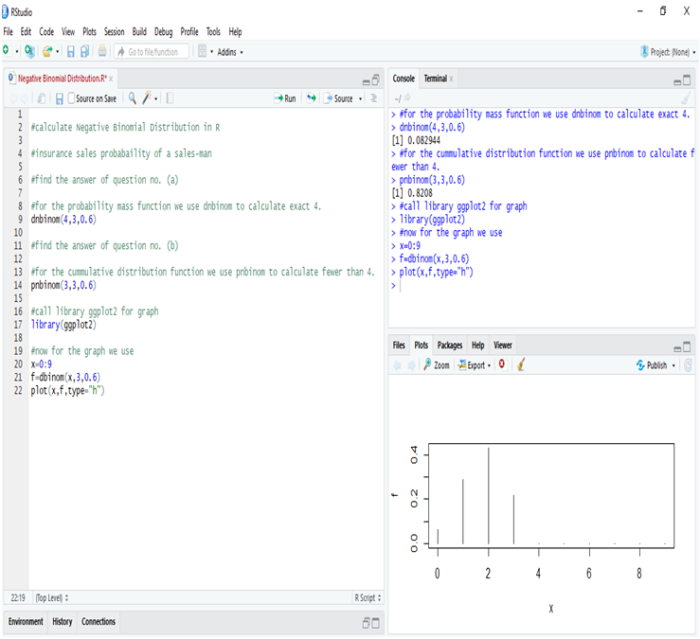
Calculate Negative Binomial Distribution in R:

In R, we calculate negative binomial distribution to find the probability of insurance sales. Thus, we get,

  1. The probability that he has exactly 4 failed attempts before his 3rd successful sales are 8.29%.
  2. The probability that he has fewer than 4 failed attempts before his 3rd successful sales is 82.08%.

Hence, we can see that chances are quite high that Mr. Singh will succeed in making a sale after 4 failed attempts.

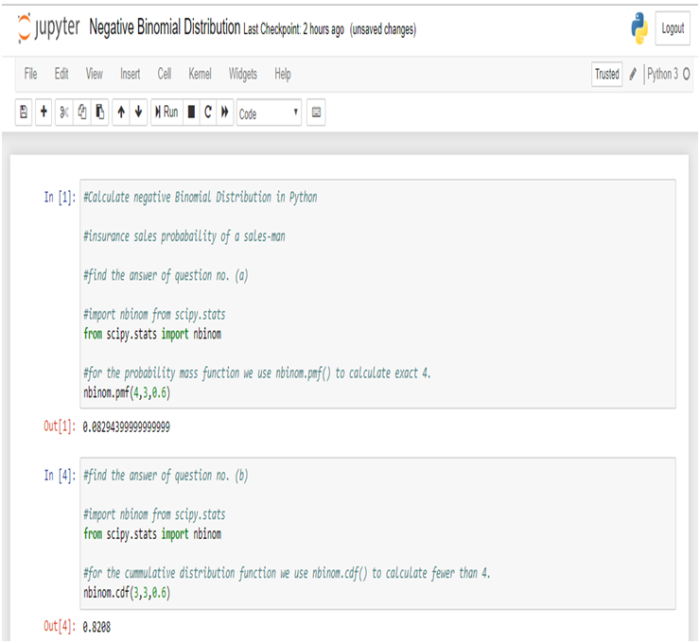
Calculate Negative Binomial Distribution in Python:

In Python, we get the same results as above.

Conclusion:

Negative Binomial distribution is the discrete probability distribution that is actually used for calculating the success and failure of any observation. When applied to real-world problems, the outcomes of the successes and failures may or may not be the outcomes we ordinarily view as good and bad, respectively.

Suppose we used the negative binomial distribution to model the number of days a certain machine works before it breaks down. In this case, “success” would be the days that the machine worked properly, whereas the day when the machine breaks down would be a “failure”. Another example would be, if we used the negative binomial distribution to model the number of attempts an athlete makes on goal before scoring r goals, though, then each unsuccessful attempt would be a “success”, and scoring a goal would be “failure”.

This blog will surely aid in developing a better understanding of how negative binomial distribution works in practice. If you have any comments please leave them below. Besides, if you are interested in catching up with the cutting edge technologies, then reach the premium training institute of Data Science and Machine Learning leading the market with the top-notch Machine Learning course in India.


Interested in a career in Data Analyst?

To learn more about Data Analyst with Advanced excel course – Enrol Now.
To learn more about Data Analyst with R Course – Enrol Now.
To learn more about Big Data Course – Enrol Now.

To learn more about Machine Learning Using Python and Spark – Enrol Now.
To learn more about Data Analyst with SAS Course – Enrol Now.
To learn more about Data Analyst with Apache Spark Course – Enrol Now.
To learn more about Data Analyst with Market Risk Analytics and Modelling Course – Enrol Now.

An All-Inclusive Guide on Python and its Changing Trends

An All-Inclusive Guide on Python and its Changing Trends

Python is an extremely readable and versatile high-level programming language. Many companies such as Google, YouTube, Dropbox use the language for developing applications. It also finds its use extensively in diverse fields as in Python for data analysis, Machine Learning Using Python, Natural Language Processing, Web Development, Scientific Computing, Image processing, Robotics, Computer Vision and many more.

It supports both Object-oriented programming and Functional programming. Python is generally referred to as an interpreted language which implies that each line of code is executed one by one and if the interpreter finds an error, it stops immediately with an error message on the screen.

Another important feature of Python is its interactive prompt. A Python statement can be typed and immediately executed, which is in sharp contradiction to any other compiled language.

What are Python 2.x and Python 3.x?

There are two main versions of Python: Python 2.x and Python 3.x. If someone is new to Python, then he/she might be in confusion about which version to use. However, in the current scenario, we can easily migrate from Python 2 to Python 3, as the Python Software Foundation has finally taken the step to formally announce that Python 2 will reach the end of life (EOL) on January 1st, 2020.

Key differences between Python 2.x and Python 3.x

This article discusses the differences between these two versions of Python, making Python 3 less confusing for a new programmer.

  1. Print Function

In Python 2, print is a statement. There is no need of parenthesis.

In Python 3, print is a function. It needs parenthesis.

  1. Integer Division

In Python 2, if the division operator is performed on two integers, then the output will be an integer for example: – 7/3 = 2.

In Python 3, if the division operator is performed on two integers, then the output will be accurate. It can also be in float for example: – 7/3 = 2.33.

To get the result in an integer only a different division operator is used that is (//) it returns an integer result for example, – 7//3 = 2.

 3. Unicode Support

Both the versions of Python can handle strings (sequences of characters) differently.

Python 2 uses the ASCII encoding standard by default. ASCII is limited to representing 256 characters. This limits the flexibility of Python to encode the characters, particularly non-standard ones. Using Unicode in Python 2 requires extra syntax—for example when using print, the input text is to be wrapped in the Unicode() function to handle special characters.

In Python 3, Unicode is the default. The Unicode standard is much more versatile—it supports over 128,000 characters. There is no need for an extra syntax to define the Unicode values—they get printed automatically as utf-8 strings.

  1. Range Function

In Python 2, the range function returns a list of numbers.

In Python 2, the xrange class represents an iterable that provides the same object.

 In Python 3, original range function is removed and xrange is renamed to range:

In Python 3, it is needed to convert the range object to a list if someone desires the same result as the range function provides in Python 2.

  1. ­­­­Input() Method

Mainly what is expected from the input() method is that it reads input as string, then it can be converted into any datatype as per the requirement.

In Python 2, it has both the input() and raw_input() methods for taking input. The difference between the raw_input() and input()is that the raw_input() reads input as a string while the input() reads input as string only if it is inside quotes else reads as an integer.

In Python 3, there is no raw_input() method. The raw_input() method is replaced by input() in python 3. 

If someone still wants to use the input() method like in python 2, then it can be availed by using eval() method.

There are many other differences between Python 2 and Python 3 like: –

  1. Next() Method

In Python 2, .next() method is used and in Python 3 next() function is used to iterate the next element of an iterator.

  1. Raising Exception

To raise an exception in Python 3, the argument should be in parenthesis, while in Python 2, it is not necessary.

  1. Handling Exception

Handling exception is also changed in Python 3, “as” keyword is used in Python 3, while it is not necessary in Python 2.

So, if someone is a beginner, then it is strongly recommended to use Python 3 because it is the future of Python and also January 1, 2020, will be the last day of Python 2. It means that no improvement will be done anymore after that day, even if someone finds a security problem in it.

Data Science Machine Learning Certification

It is highly recommended to upgrade the version of the programming language to Python 3. Some ways can help the Python 2 users in porting their code from Python 2 to Python 3 and get the feel of Python 3 and figure out how it is different from Python 2. The code can be imported by using tools like “Futurize” and “Modernize”. Also, if someone wants to check the availability of Python 3 as part of his tests, then “caniusepython3.check()” can be used.

As a final note, everyone must look for upgrading their Python version to Python 3 to understand the subtleties of the new version and usher in the future. However, if you are interested in Deep learning for computer vision with Python and similar courses, then opt for the premium Python training institute in Delhi now!


.

Call us to know more