Certificate in Machine Learning Archives - DexLab Analytics | Big Data Hadoop SAS R Analytics Predictive Modeling & Excel VBA

Time Series Analysis & Modelling with Python (Part II) – Data Smoothing

dexlab_time_series

Data Smoothing is done to better understand the hidden patterns in the data. In the non- stationary processes, it is very hard to forecast the data as the variance over a period of time changes, therefore data smoothing techniques are used to smooth out the irregular roughness to see a clearer signal.

In this segment we will be discussing two of the most important data smoothing techniques :-

  • Moving average smoothing
  • Exponential smoothing

Moving average smoothing

Moving average is a technique where subsets of original data are created and then average of each subset is taken to smooth out the data and find the value in between each subset which better helps to see the trend over a period of time.

Lets take an example to better understand the problem.

Suppose that we have a data of price observed over a period of time and it is a non-stationary data so that the tend is hard to recognize.

QTR (quarter)Price
110
211
318
414
515
6?


In the above data we don’t know the value of the 6th quarter.

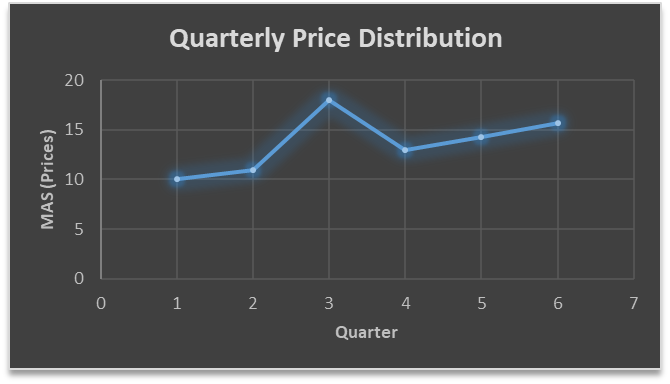
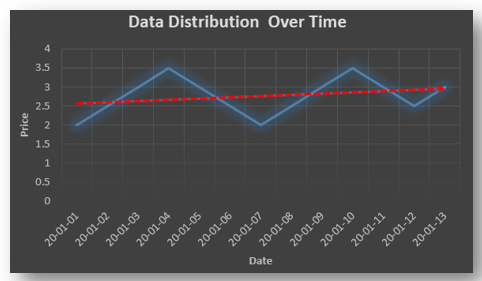
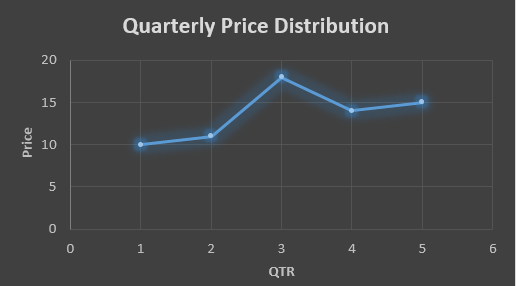
….fig (1)

The plot above shows that there is no trend the data is following so to better understand the pattern we calculate the moving average over three quarter at a time so that we get in between values as well as we get the missing value of the 6th quarter.

To find the missing value of 6th quarter we will use previous three quarter’s data i.e.

MAS =  = 15.7

QTR (quarter)Price
110
211
318
414
515
615.7

MAS =  = 13

MAS =  = 14.33

QTR (quarter)PriceMAS (Price)
11010
21111
31818
41413
51514.33
615.715.7


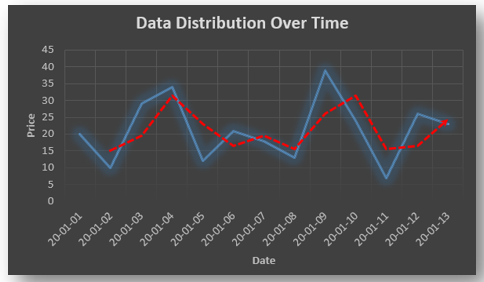
….. fig (2)

In the above graph we can see that after 3rd quarter there is an upward sloping trend in the data.

Exponential Data Smoothing

In this method a larger weight ( ) which lies between 0 & 1 is given to the most recent observations and as the observation grows more distant the weight decreases exponentially.

The weights are decided on the basis how the data is, in case the data has low movement then we will choose the value of  closer to 0 and in case the data has a lot more randomness then in that case we would like to choose the value of  closer to 1.

EMA= Ft= Ft-1 + (At-1 – Ft-1)

Now lets see a practical example.

For this example we will be taking  = 0.5

Taking the same data……

QTR (quarter)Price

(At)

EMS Price(Ft)
11010
211?
318?
414?
515?
6??


To find the value of yellow cell we need to find out the value of all the blue cells and since we do not have the initial value of F1 we will use the value of A1. Now lets do the calculation:-

F2=10+0.5(10 – 10) = 10

F3=10+0.5(11 – 10) = 10.5

F4=10.5+0.5(18 – 10.5) = 14.25

F5=14.25+0.5(14 – 14.25) = 14.13

F6=14.13+0.5(15 – 14.13)= 14.56

QTR (quarter)Price

(At)

EMS Price(Ft)
11010
21110
31810.5
41414.25
51514.13
614.5614.56

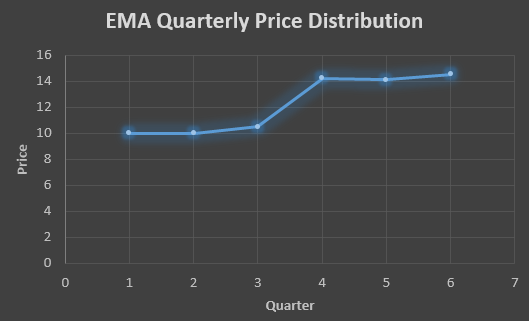
In the above graph we see that there is a trend now where the data is moving in the upward direction.

So, with that we come to the end of the discussion on the Data smoothing method. Hopefully it helped you understand the topic, for more information you can also watch the video tutorial attached down this blog. The blog is designed and prepared by Niharika Rai, Analytics Consultant, DexLab Analytics DexLab Analytics offers machine learning courses in Gurgaon. To keep on learning more, follow DexLab Analytics blog.


.
Time Series Analysis Part I


A time series is a sequence of numerical data in which each item is associated with a particular instant in time. Many sets of data appear as time series: a monthly sequence of the quantity of goods shipped from a factory, a weekly series of the number of road accidents, daily rainfall amounts, hourly observations made on the yield of a chemical process, and so on. Examples of time series abound in such fields as economics, business, engineering, the natural sciences (especially geophysics and meteorology), and the social sciences.

  • Univariate time series analysis- When we have a single sequence of data observed over time then it is called univariate time series analysis.
  • Multivariate time series analysis – When we have several sets of data for the same sequence of time periods to observe then it is called multivariate time series analysis.

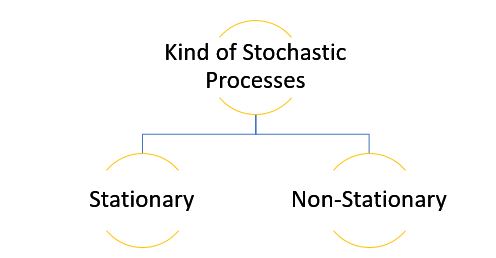
The data used in time series analysis is a random variable (Yt) where t is denoted as time and such a collection of random variables ordered in time is called random or stochastic process.

Stationary: A time series is said to be stationary when all the moments of its probability distribution i.e. mean, variance , covariance etc. are invariant over time. It becomes quite easy forecast data in this kind of situation as the hidden patterns are recognizable which make predictions easy.

Non-stationary: A non-stationary time series will have a time varying mean or time varying variance or both, which makes it impossible to generalize the time series over other time periods.

Non stationary processes can further be explained with the help of a term called Random walk models. This term or theory usually is used in stock market which assumes that stock prices are independent of each other over time. Now there are two types of random walks:
Random walk with drift : When the observation that is to be predicted at a time ‘t’ is equal to last period’s value plus a constant or a drift (α) and the residual term (ε). It can be written as
Yt= α + Yt-1 + εt
The equation shows that Yt drifts upwards or downwards depending upon α being positive or negative and the mean and the variance also increases over time.
Random walk without drift: The random walk without a drift model observes that the values to be predicted at time ‘t’ is equal to last past period’s value plus a random shock.
Yt= Yt-1 + εt
Consider that the effect in one unit shock then the process started at some time 0 with a value of Y0
When t=1
Y1= Y0 + ε1
When t=2
Y2= Y1+ ε2= Y0 + ε1+ ε2
In general,
Yt= Y0+∑ εt
In this case as t increases the variance increases indefinitely whereas the mean value of Y is equal to its initial or starting value. Therefore the random walk model without drift is a non-stationary process.

So, with that we come to the end of the discussion on the Time Series. Hopefully it helped you understand time Series, for more information you can also watch the video tutorial attached down this blog. DexLab Analytics offers machine learning courses in delhi. To keep on learning more, follow DexLab Analytics blog.


.
How Conversational AI and Chatbots are Revolutionizing Indian banking Industry

Thanks to the advancements in AI and ML, bank work can now be done with the click of a phone button! Innovations in the field of customer services form an important part of the technology overhaul. The banking sector is making hefty investments on AI technology to simplify user experience and enhance overall performance of financial institutes.

Let’s take a look at how conversational AI and chatbots are revolutionizing the Indian banking industry.

  • Keya by Kotak Mahindra Bank

Keya is the first AI-powered chatbot in Indian banking sector. It is incorporated in Kotak’s phone-banking helpline to improve its long-established interactive voice response (IVR) system.

‘’Voice commands form a significant share of search online. In addition, the nature of the call is changing with customers using voice as an escalation channel. Keya is an intelligent voicebot developed keeping in mind the customers’ changing preference for voice over text. It is built on a technology that understands a customer’s query and steers the conversation to provide a quick and relevant response”, says Puneet Kapoor, Senior Executive Vice President, Kotak Mahindra Bank.

2

  • Bank of Baroda chatbot

Akhil Handa, Head of Fintech Initiatives, Bank of Baroda said that their chatbot will manage product-related queries. He believes that the services of the chatbot will result in better customer satisfaction, speedy responses and cost minimization.

  • Citi Union Bank’s Lakshmi Bot

Lakshmi, India’s first humanoid banker is a responsive robot powered by AI. It can converse with customers on more than 125 topics, including balance, interest rates and transactional history.

  • IBM Watson by SBI

Digital platforms of SBI, like SBI inTouch, are utilizing AI-powered bots, such as IBM Watson, to enhance customer experience. SBI stated that modern times will witness the coexistence of men and machines in banks.

  • AI-driven digital initiatives by YES Bank in partnership with Payjo

Payjo is a top AI Banking platform based out of Silicon Valley in California. YES Bank has partnered with Payjo to launch YES Pay Bot, its first Bot using AI, which improves already popular wallet services. The YES Pay wallet service is trusted by more than half-a-million customers.

  • YES TAG chatbot

YES TAG chatbot has been launched by YES Bank and enables transactions through 5 messaging apps. Customers can carry out a wide range of activities, such as check balance, FD details, status of cheque, transfer money, etc. It is currently used in Android and will soon be available on Apple App Store.

  • Digibank

Asia’s largest bank, DBS Bank, has developed Digibank, which is India’s first mobile bank that is ‘chatbot staffed’. It provides real-time solution to banking related issues. This chatbot employs a trained AI platform, called KAI, which is a product of New York startup- Kasisto.

  • Axis Bank launches intelligent chatbot in association with Active.ai

Axis Bank facilitates smart banking with the launch of a chatbot that employs conversational interface to offer interactive mobile banking solutions. This intelligent chatbot was developed in association with Singapore based AI company- Active AI.

  • HDFC Bank launches OnChat in partnership with Niki.ai

To enable smooth ecommerce and banking transactions, HDFC in partnership with Niki.ai has launched a conversational chatbot, called OnChat. It is available on Facebook messenger even to people who aren’t HDFC customers. Users can recharge phone, book cabs and pay utility bills through this chatbot.

  • EVA by HDFC Bank

EVA is exclusively for the customers of HDFC Bank. It is an electronic virtual assistant developed in partnership with Senseforth, an AI startup based in Bengaluru.

  • mPower by YES Bank

mPower is a chatbot for loan products that has been developed by YES Bank in association with Gupshup-a leading bot company. It assists customers on a variety of loan related topics like personal loans, car loans and loan against securities.

In the future, there will be three kinds of bots- speech-based bot, textbots and video chatbots. Conversational bots work in harmony with human employees to enrich customer experience.

Thus, AI-powered technology is the way forward. To be industry-ready in this AI-era, enroll for the Machine Learning course in Gurgaon at Dexlab Analytics. It is a premier Analytics training institute in Delhi.


Interested in a career in Data Analyst?

To learn more about Data Analyst with Advanced excel course – Enrol Now.
To learn more about Data Analyst with R Course – Enrol Now.
To learn more about Big Data Course – Enrol Now.

To learn more about Machine Learning Using Python and Spark – Enrol Now.
To learn more about Data Analyst with SAS Course – Enrol Now.
To learn more about Data Analyst with Apache Spark Course – Enrol Now.
To learn more about Data Analyst with Market Risk Analytics and Modelling Course – Enrol Now.

The Evolution of Neural Networks

The Evolution of Neural Networks

Recently, Deep Learning has gone up from just being a niche field to mainstream. Over time, its popularity has skyrocketed; it has established its position in conquering Go, learning autonomous driving, diagnosing skin cancer, autism and becoming a master art forger.

Before delving into the nuances of neural networks, it is important to learn the story of its evolution, how it came into limelight and got re-branded as Deep Learning.

The Timeline:

Warren S. McCulloch and Walter Pitts (1943): “A Logical Calculus of the Ideas Immanent in Nervous Activity”

Here, in this paper, McCulloch (neuroscientist) and Pitts (logician) tried to infer the mechanisms of the brain, producing extremely complicated patterns using numerous interconnected basic brain cells (neurons).  Accordingly, they developed a computer-programmed neural model, known as McCulloch and Pitt’s model of a neuron (MCP), based on mathematics and algorithms called threshold logic.

2

Marvin Minsky (1952) in his technical report: “A Neural-Analogue Calculator Based upon a Probability Model of Reinforcement”

Being a graduate student at Harvard University Psychological Laboratories, Minsky executed the SNARC (Stochastic Neural Analog Reinforcement Calculator). It is possibly the first artificial self-learning machine (artificial neural network), and probably the first in the field of Artificial Intelligence.

Marvin Minsky & Seymour Papert (1969): “Perceptron’s – An Introduction to Computational Geometry” (seminal book):  

In this research paper, the highlight has been the elucidation of the boundaries of a Perceptron. It is believed to have helped usher into the AI Winters – a time period of hype for AI, in which funds and publications got frozen.

Kunihiko Fukushima (1980) – “Neocognitron: A Self-organizing Neural Network Model for a Mechanism of Pattern Recognition Unaffected by Shift in Position” (this concept is an important component for Convolutional Neural Network – LeNet)

Fukushima conceptualized a whole new, much improved neural network model, known as ‘Neocognitron’. This name is derived from ‘Cognitron’, which is a self-organizing multi layered neural network model proposed by [Fukushima 1975].

David B. Parker (April 1985 & October 1985) in his technical report and invention report – “Learning – Logic”

David B. Parker reinvented Backpropagation, by giving it a new name ‘Learning Logic’. He even reported it in his technical report as well as filed an invention report.

Yann Le Cun (1988) – “A Theoretical Framework for Back-Propagation”

You can derive back-propagation through numerous ways; the simplest way is explained in Rumelhart et al. 1986. On the other hand, in Yann Le Cun 1986, you will find an alternative deviation, which mainly uses local criteria to be minimized locally.


J.S. Denker, W.R. Garner, H.P. Graf, D. Henderson, R.E. Howard, W. Hubbard, L.D. Jackel, H.S. Baird, and I. Guyon at AT&T Bell Laboratories (1989): “Neural Network Recognizer for Hand-Written ZIP Code Digits”

In this paper, you will find how a system ascertains hand-printed digits, through a combination of neural-net methods and traditional techniques. The recognition of handwritten digits is of crucial notability and of immense theoretical interest. Though the job was comparatively complicated, the results obtained are on the positive side.

Yann Le Cun, B. Boser, J.S. Denker, D. Henderson, R.E. Howard, W. Hubbard, L.D. Jackel at AT&T Bell Laboratories (1989): “Backpropagation Applied to Handwritten ZIP Code Recognition”

A very important real-world application of backpropagation (handwritten digit recognition) has been addressed in this report. Significantly, it took into account the practical need for a chief modification of neural nets to enhance modern deep learning.

Besides Deep Learning, there are other kinds of architectures, like Deep Belief Networks, Recurrent Neural Networks and Generative Adversarial Networks etc., which can be discussed later.

For comprehensive Machine Learning training Gurgaon, reach us at DexLab Analytics. We are a pioneering data science online training platform in India, bringing advanced machine learning courses to the masses.


Interested in a career in Data Analyst?

To learn more about Data Analyst with Advanced excel course – Enrol Now.
To learn more about Data Analyst with R Course – Enrol Now.
To learn more about Big Data Course – Enrol Now.

To learn more about Machine Learning Using Python and Spark – Enrol Now.
To learn more about Data Analyst with SAS Course – Enrol Now.
To learn more about Data Analyst with Apache Spark Course – Enrol Now.
To learn more about Data Analyst with Market Risk Analytics and Modelling Course – Enrol Now.

Call us to know more