Business analyst training courses in Noida Archives - Page 3 of 3 - DexLab Analytics | Big Data Hadoop SAS R Analytics Predictive Modeling & Excel VBA

Take Small Steps With Big Feet of Business Analytics

Take Small Steps With Big Feet of Business Analytics

Do these following questions clog your mind?

I aspire to become a business analytics professional, but I don’t know what skills to possess?

I am sceptical; which training should I opt for in order to establish my career in the sphere of business analytics?

I am looking forward to switch my career into data analytics, but I don’t know which skills to imbibe for better prospects?

Answer: Yes, they do.

Continue reading “Take Small Steps With Big Feet of Business Analytics”

What Does The Market Look Like for Hadoop in 2018 – 2022?

What Does The Market Look Like for Hadoop in 2018 – 2022?

It will be a simple understatement to say that Hadoop took the Big Data market up by storm this past years from 2012-2016. This time-period in the history of data witnessed a wave of mergers, acquisitions and high valuation rounds of finances. It will not be a simple exaggeration to state that today Hadoop is the only cost sensible and scalable open-source alternative option against the other commercially available Big Data Management tools and packages.

Recently it has not only emerged as the de-facto for all industry standard business intelligence (BI), and has become an integral part of almost all commercially available Big Data solutions.

Until 2015, it had become quite clear that Hadoop did fail to deliver in terms of revenues. From 2012 to 2015, the growth and development of Hadoop systems have been financed by venture capitalists mostly. It also made some funds through acquisition money and R&D project budgets.

But it is no doubt that Hadoop talent is sparse and also does not come in cheap. Hadoop smarts a steep learning curve that most cannot manage to climb. Yet, still more and more enterprises are finding themselves be attracted towards the gravitational pull of this massive open-source system, of Hadoop. It is mostly due to the functionality that it offers. Several interesting trends have emerged in the Hadoop market within the last 2 years like:

  • The transformation from batch processing to online processing
  • The emergence of MapReduce alternatives like Spark, DataTorrent and Storm
  • Increasing dissatisfaction among the people with the gap between SQL-on-Hadoop and the present provisions
  • Hadoop’s case will further see a spur with the emergence of IoT
  • In-house development and deployment of Hadoop
  • Niche enterprises are focussing on enhancing Hadoop features and its functionality like visualization features, governance, ease of use, and its way to ease up to the market.

While still having a few obvious setbacks, it is of no doubt that, Hadoop is here to stay for the long haul. Moreover, there is rapid growth to be expected in the near future.
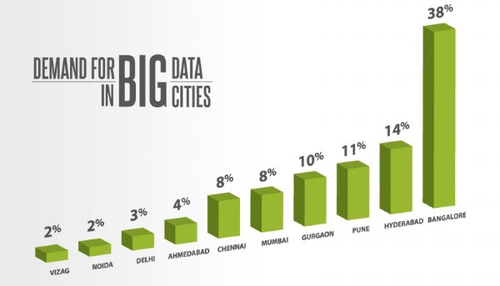
Hadoop+the+Next+Big+Thing+in+India_2

Image Source: aws.amazon.com

As per market, forecasts the Hadoop market is expected to grow at CAGR (compounded annual growth rate) of 58% thereby surpassing USD 16 billion by 2020.

The major players in the Hadoop industry are as follows: Teradata Corporation, Rainstor, Cloudera, Inc. and Hortonworks Inc., Fujitsu Ltd., Hitachi Data Systems, Datameer, Inc., Cisco Systems, Inc., Hewlett-Packard, Zettaset, Inc., IBM, Dell, Inc., Amazon Web Services, Datastax, Inc., MapR Technologies, Inc., etc.

Several opportunities are emerging for Hadoop market with the changing global environment where Big Data is affecting the IT businesses in the following two ways:

  1. The need to accommodate this exponentially increasing amount of data (storage, analysis, processing)
  2. Increasingly cost-prohibitive models for pricing that are being imposed by the established IT vendors
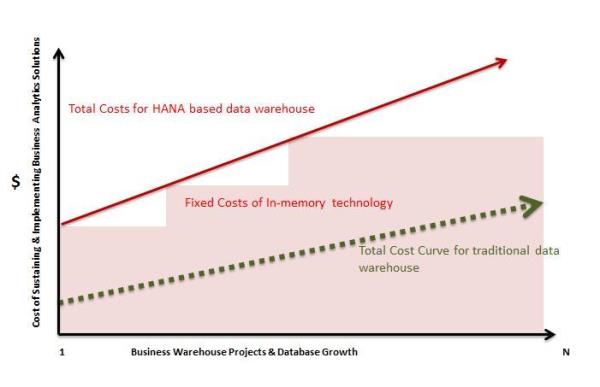
010516Yelamaneni1

Image Source: tdwi.org

The forecast for Hadoop market for the years 2017-2022 can be summarised as follows:

  1. Hadoop market segment as per geographical factors: EMEA, America and Asia/Pacific
  2. As per software and hardware services: commercially supported software for Hadoop, Hadoop appliances and hardware, Hadoop services (integration, consulting, middleware, and support), outsourcing and training
  3. By verticals
  4. By tiers of data (quantity of data managed by organizations)
  5. As per application: advanced/predictive analysis, ETL/data integration, Data mining/visualization. Social media and click stream analysis. Data warehouse offloading; IoT (internet of things) and mobile devices. Active archives along with cyber security log analysis.

010516Yelamaneni2

Image Source: tdwi.org

This chain link graph shows that each component in an industry is closely linked to data analytics and management and plays an equally important role in generating business opportunities and better revenue streams.

Enjoy 10% Discount, As DexLab Analytics Launches #BigDataIngestion
DexLab Analytics Presents #BigDataIngestion

Contact Us Through Our Various Social Media Channels Or Mail To Know More About Availing This Offer!


THIS OFFER IS FOR COLLEGE STUDENTS ONLY!


Interested in a career in Data Analyst?

To learn more about Machine Learning Using Python and Spark – click here.
To learn more about Data Analyst with Advanced excel course – click here.
To learn more about Data Analyst with SAS Course – click here.
To learn more about Data Analyst with R Course – click here.
To learn more about Big Data Course – click here.
5 Analytics Tools To Improve Your Business Decisions

5 Analytics Tools To Improve Your Business Decisions

Big Data has proved to be inevitable for business organisations in the quest for stepping ahead of their competitors. Nevertheless, only having Big Data at hand does not solve problems. You also need the availability of efficient analytics software that can put your data to the best use.

A business analytics tool is responsible for analysing massive amounts of data in order to extract valuable information. Such information in turn, can be used for improving operational efficiency and for taking better decisions.

2

So, let us here go through the top 10 data analytics tools available in the market.

  • Yellowfin BI

Yellowfin Business Intelligence (BI) is a reporting, dashboard and data analysis software. The software is able to conduct analysis of huge amounts of database, in order to figure out appropriate information. With Yellowfin, your dashboard can be easily accessible from everywhere including company intranet, mobile device or web page.

  • Business Intelligence & Reporting Tools (BIRT)

BIRT is open source software programmed for JAVA and JAVA EE platforms. It consists of a runtime component and a visual report designer, which can be used for creating reports, visual data, and charts and so on. Information gathered from this software can be used for tracking historical data and analysing it and as well as for monitoring ongoing developments in various fields. BIRT can also be used for real-time decision-making purposes.

  • Clear Analytics

Clear Analytics is quite easy to manage as the software is based on Excel spreadsheets. While the software allows you to continue managing data using Excel, it also adds some extra features like reports scheduling, administrative capabilities, version control, governance etc. for better decision making. In short, Clear Analytics can be your choice in case you want high-end performance in exchange of minimal effort.

  • Tableau

Tableau is BI software that provides insight into the data that a business organisation requires for connecting the dots, in order to make clear and effective decisions. Data visualisation in Tableau is much dynamic and elaborative as compared to the other programmes available. Besides, it also provides easier access to data given its extended mobile device support. Additionally, the costs of implementing this program as well as its upgrade are relatively low.

  • GoodData

GoodData is a service BI platform. It takes into account both internal and external datasets (cloud) of an organisation to analyse and provide better governance. The platform is programmed for managing data security and governance thereby, consequently providing the user with the desired results. The most important feature of this platform is that it can analyse datasets of any size, thus making it effective for its users. Recently, the company rebranded their software as an Open Analytics platform.

These are some of the major analytics tools used by organisations irrespective of their scale in order to enhance their business intelligence. Whether you are looking to enhance your career or take better business decisions, a Data analyst certification course can help you to achieve such objectives. Data Analysis helps you to track the competitive landscape and figure out the essentials that needs to be done, in order to get ahead of your competitors. If you are a manager, you can take precise decisions based on quantitative data. Since big data is potential of driving your success, it is your job to master the science and use it for your advantage.


Interested in a career in Data Analyst?

To learn more about Data Analyst with Advanced excel course – Enrol Now.
To learn more about Data Analyst with R Course – Enrol Now.
To learn more about Big Data Course – Enrol Now.

To learn more about Machine Learning Using Python and Spark – Enrol Now.
To learn more about Data Analyst with SAS Course – Enrol Now.
To learn more about Data Analyst with Apache Spark Course – Enrol Now.
To learn more about Data Analyst with Market Risk Analytics and Modelling Course – Enrol Now.

Approach – Actionable Analytics

Approach – Actionable Analytics


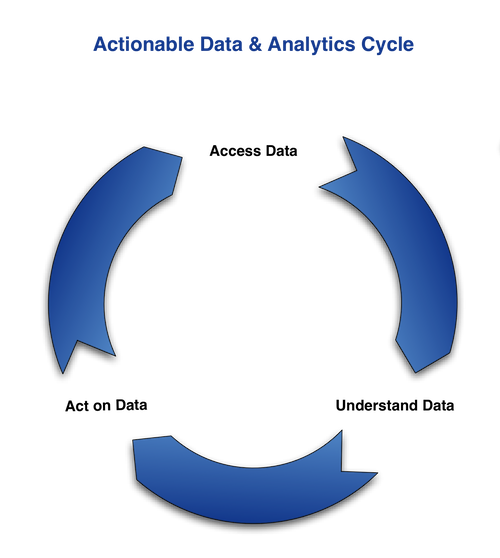
In this blog post, we will discuss on the approach we can follow to provide an actionable analytics. Doing actionable analytics is not easier said than done. It requires a focused analytical process. Here we will outline the three important phase or levers that can improve the process of delivering actionable analytics. The three phases can help you to improve the financial aspects of the business by doing actionable analytics.


  • Discover
  • Explore 
  • Engage

Actionable-Data-Analytics-Cycle_f_improf_500x558

For example, if we are delivering actionable analytics for the marketing function. In each phase we will identify some critical characteristics or parameters that are going to influence the financial value directly or indirectly.

Continue reading “Approach – Actionable Analytics”

Call us to know more