Use intelligence to make the world a better place to live in – Google’s London-based AI coterie, DeepMind is a pioneer in artificial intelligence research programs and has churned out two distinct types of AI that uses the ‘power of imagination’ to plan ahead and fulfil tasks with a higher success rate than the previous ones that lacked imagination.
In a recent interview, DeepMind researchers shared a crisp review of “a new family of approaches for imagination-based planning.” I2As, the so-called Imagination-Augmented Agents make use of an internal ‘imagination encoder’, which helps the AI determine what are and what aren’t productive predictions about its atmosphere.
The fascinating world of Business Intelligence is expanding. The role of data scientists is evolving. The mysticism associated with data analytics is breaking off, making a way for non-technical background people to understand and dig deeper into the nuances and metrics of data science.
“Data democratization is about creating an environment where every person who can use data to make better decisions, has access to the data they need when they need it,” says Amir Orad, CEO of BI software company Sisense. Data is not to be limited only in the hands of data scientists, employees throughout the organization should have easy access to data, as and when required.
In supreme and sophisticated geospatial realm, data have been predominant. Or, should I say it is the matured fosterling of Geographic Information Systems (GIS). Choose, whatever suits you; subject to whom you work for or what you need to work on. The meat and potatoes? To excel on location analytics, concentrate only on the best most current data.
In today’s world, data is valuable. It is vital and veritable. It is indispensable in Geographic Information Systems (GIS).
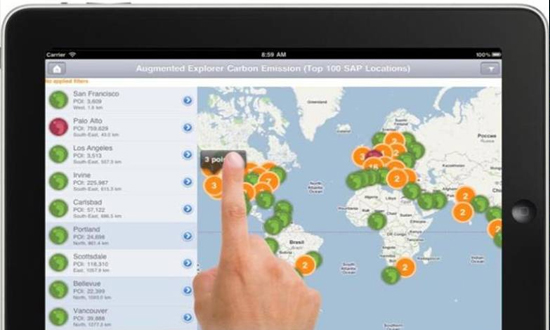
To second that, today’s tech-efficient society is anchored on location-based data, than ever, especially with the rise in Twitter, Google, Facebook and other social media apps, which collects and stores data from their highly-valued users to sell them off to money-grubbing advertisers. Though secretly. On the other hand, cell phones go a step ahead in broadcasting your current location data 24/7. Otherwise, how would your friends know that you are safe when a severe earthquake rattled your neighbouring city! (Thanks to location settings)
Feisty Predicaments
However, the real challenge lies in data identification and consumption. Countless number of users gets baffled when it comes to finding data, and if found, how to consume it to set off their business determinations. To solve this, many imminent think tanks of tech industry came out with direct and decisive solutions. Some of them were loaded with an abundance of data, i.e. digestible and disintegrated. By disintegration, they meant that the data was categorized into: points of interest, roads, boundaries and demographics, for easy comprehensibility. Furthermore, industry data bundles concerning telecommunications, retail and insurance fields were added to make the coverage global and profitable. To top it off, quality content and sprawling file formats boosted the results and mechanisms, both.
Conflux of GIS and BI
Location technology – Does this ring a bell? Yes? Then you would be familiar with GIS but others, particularly new Business Intelligence users and consumers must have just started taking baby steps on basic mapping. For BI, maps are the backdrop against which business analysts project their business data, stats and analytical information. Analysing the data to understand the insights of consumers is crucial, directly affecting the business decisions and revenues thereby. For example, heat maps, used to see the concentration of installations, customers and IoT devices provides an unparalleled accurateness of spatial relationships, which is impossible to obtain from the spreadsheets.
One of the integral location analytics issues is to help in identifying the high-risk zones at the time of natural disasters, like tornadoes, earthquakes, floods, hurricanes or mudslides. For example, in the US, the East Coast is vulnerable to a lot of hurricanes and floods, whereas earthquakes and mudslides snap the West Coast time to time. Assessment of these location problems is intrinsically important for mortgage underwriters, insurance agents and public safety departments. And best data along with effective geo-coding is the solution to all the inconveniences.
To learn more about Machine Learning Using Python and Spark – click here. To learn more about Data Analyst with Advanced excel course – click here. To learn more about Data Analyst with SAS Course – click here. To learn more about Data Analyst with R Course – click here. To learn more about Big Data Course – click here.
Ever wondered why many organizations often find it hard to implement Big Data? The reason often is poor or non-existent data management strategies which works counterproductive.
Data cannot be delivered or analysed without proper technology systems and procedural flows data can never be analysed or delivered. And without an expert team to manage and maintain the setup, errors, and backlogs will be frequent.
Before we make a plan of the data management strategies we must consider what systems and technologies one may need to add and what improvements can be made to an existing processes; and what do these roles bring about in terms of effects with changes.
However, a much as is possible any type of changes should be done by making sure a strategy is going to be integrated with the existing business process.
And it is also important to take a holistic point of view, for data management. After all, a strategy that does not work for its users will never function effectively for any organization.
With all these things in mind, in this article we will examine each of the three most important non-data components for a successful data management strategy – this should include the process, the technology and the people.
Recognizing the right data systems:
There is a lot of technology implemented into the Big Data industry, and a lot of it is in the form of a highly specific tool system. Almost all of the enterprises do need the following types of tech:
Data mining:
This will isolate specific information from a large data sets and transform it into usable metrics. Some o the familiar data mining tools are SAS, R and KXEN.
Automated ETL:
The process of ETL is used to extract, transform, and also will load data so that it can be used. ETL tools also automate this process so that human users will not have to request data manually. Moreover, the automated process is way more consistent.
Enterprise data warehouse:
A centralised data warehouse will be able to store all of an organization’s data and also integrate a related data from other sources, this is an indispensible part of any data management plan. It also keeps data accessible, and associates a lot of kinds of customer data for a complete view.
Enterprise monitoring:
These are tools, which provide a layer of security and quality assurance by monitoring some critical environments, with problem diagnosing, whenever they arise, and also to quickly notify the team behind analytics.
Business intelligence and reporting, Analytics:
These are tools that turn processed data into insights, that are tailored to extract roles along with users. Data must go to the right people and in the right format for it to be useful.
Analytics:
And in analytics highly specific metrics are combined like customer acquisition data, product life cycle, and tracking details, with intuitive user friendly interfaces. They often integrate with some non-analytics tools to ensure the best possible user experience.
So, it is important to not think of the above technologies as simply isolated elements but instead consider them as a part of a team. Which must work together as an organized unit.
To learn more about Data Analyst with Advanced excel course – Enrol Now. To learn more about Data Analyst with R Course – Enrol Now. To learn more about Big Data Course – Enrol Now.
To learn more about Machine Learning Using Python and Spark – Enrol Now. To learn more about Data Analyst with SAS Course – Enrol Now. To learn more about Data Analyst with Apache Spark Course – Enrol Now. To learn more about Data Analyst with Market Risk Analytics and Modelling Course – Enrol Now.
The companies’ data governance program is usually linked to the implementation of the General Data Regulation Program. And throughout time several articles have been written about to link the two initiatives but till none was so clearly distinct as the recent one on LinkedIn by Dennis Slattery. He made an analogy of a wedding between Governance and Privacy, which is very fitting but also highlights the fact that, a long term marriage with optimum success is based on the foundations that strengthen it with mutual efforts.
We can also take a similar message from the famous quote by Henry Ford – coming together is just the beginning, keeping together is actual progress, and working together is success.
Data analytics should tie its hands with privacy policies for a successful approach towards good business.
So, how can we make this marriage successful?
The GDPR regulation is quite clear on what it states, about things that must be done in order to protect the Data Citizen’s Rights. However, the bigger question most companies are facing is how to comply with regulations and/or go beyond the bare minimum and let GDPR work for them.
Majority of such discussions around the topic of how to implement GDPR today are focussed on one of two approaches – either top down or bottoms up. But we would argue otherwise, as these two approaches are not mutually exclusive and that a successful implementation of the GDPR must be based on a combination of these complementary approaches.
For the top down approach, the team for GDPR will reach out to the businesses to get a clear understanding of all business (data) processes, which involve either one or another. And for each of these processes like for third party credit checks, data analytics, address verification, and much more there are several attributes which must be clarified. Like for instance:
Have they acquired consent for the particular process?
What is the business purpose for the collection?
Who is the controller?
Who is the processor?
Who is responsible as the Data protection officer?
What is the period for retention of data?
What type of data is collected?
Along with several other information
However, it must be noted that this is not a one-time effort, once all the processes related to the personal data have been identified and classified they will still be needed to be maintained as the organization grows and evolves with development in its infrastructure over time.
The bottom up approach is a little more technical in nature. The businesses that have already established metadata management tools can then use these technologies to identify personally the identifiable information (PII) and then try and classify these data elements and assign the relevant attributes for GDPR. This approach shall quickly hit a bottleneck as the same data can be utilized for several business purposes and thus, cannot be classified for GDPR.
With successful implementation of the GDPR we will be able to marry both the approaches well.
Big Data Hadoop training from DexLab Analytics from Dexlab Analytics
Interested in a career in Data Analyst?
To learn more about Machine Learning Using Python and Spark – click here. To learn more about Data Analyst with Advanced excel course – click here. To learn more about Data Analyst with SAS Course – click here. To learn more about Data Analyst with R Course – click here. To learn more about Big Data Course – click here.
Big Data has proved to be inevitable for business organisations in the quest for stepping ahead of their competitors. Nevertheless, only having Big Data at hand does not solve problems. You also need the availability of efficient analytics software that can put your data to the best use.
A business analytics tool is responsible for analysing massive amounts of data in order to extract valuable information. Such information in turn, can be used for improving operational efficiency and for taking better decisions.
So, let us here go through the top 10 data analytics tools available in the market.
Yellowfin BI
Yellowfin Business Intelligence (BI) is a reporting, dashboard and data analysis software. The software is able to conduct analysis of huge amounts of database, in order to figure out appropriate information. With Yellowfin, your dashboard can be easily accessible from everywhere including company intranet, mobile device or web page.
Business Intelligence & Reporting Tools (BIRT)
BIRT is open source software programmed for JAVA and JAVA EE platforms. It consists of a runtime component and a visual report designer, which can be used for creating reports, visual data, and charts and so on. Information gathered from this software can be used for tracking historical data and analysing it and as well as for monitoring ongoing developments in various fields. BIRT can also be used for real-time decision-making purposes.
Clear Analytics
Clear Analytics is quite easy to manage as the software is based on Excel spreadsheets. While the software allows you to continue managing data using Excel, it also adds some extra features like reports scheduling, administrative capabilities, version control, governance etc. for better decision making. In short, Clear Analytics can be your choice in case you want high-end performance in exchange of minimal effort.
Tableau
Tableau is BI software that provides insight into the data that a business organisation requires for connecting the dots, in order to make clear and effective decisions. Data visualisation in Tableau is much dynamic and elaborative as compared to the other programmes available. Besides, it also provides easier access to data given its extended mobile device support. Additionally, the costs of implementing this program as well as its upgrade are relatively low.
GoodData
GoodData is a service BI platform. It takes into account both internal and external datasets (cloud) of an organisation to analyse and provide better governance. The platform is programmed for managing data security and governance thereby, consequently providing the user with the desired results. The most important feature of this platform is that it can analyse datasets of any size, thus making it effective for its users. Recently, the company rebranded their software as an Open Analytics platform.
These are some of the major analytics tools used by organisations irrespective of their scale in order to enhance their business intelligence. Whether you are looking to enhance your career or take better business decisions, a Data analyst certification course can help you to achieve such objectives. Data Analysis helps you to track the competitive landscape and figure out the essentials that needs to be done, in order to get ahead of your competitors. If you are a manager, you can take precise decisions based on quantitative data. Since big data is potential of driving your success, it is your job to master the science and use it for your advantage.
Interested in a career in Data Analyst?
To learn more about Data Analyst with Advanced excel course – Enrol Now. To learn more about Data Analyst with R Course – Enrol Now. To learn more about Big Data Course – Enrol Now.
To learn more about Machine Learning Using Python and Spark – Enrol Now. To learn more about Data Analyst with SAS Course – Enrol Now. To learn more about Data Analyst with Apache Spark Course – Enrol Now. To learn more about Data Analyst with Market Risk Analytics and Modelling Course – Enrol Now.
The main objective behind using any analytics tool is to analyze data and gather commercially relevant and actionable insights to accelerate results and performances of any organization. But currently there are a variety of tools available so, it often becomes difficult for managers to know which ones to use and when. You may be considering an online certificate in business analyticsso reviewing and understanding these key tools may be of great value.
So, we thought you may want to know a few of the key analytics tools in use today and how they can be helpful for different business organizations.
In this blog post, we will discuss on the approach we can follow to provide an actionable analytics. Doing actionable analytics is not easier said than done. It requires a focused analytical process. Here we will outline the three important phase or levers that can improve the process of delivering actionable analytics. The three phases can help you to improve the financial aspects of the business by doing actionable analytics.
Discover
Explore
Engage
For example, if we are delivering actionable analytics for the marketing function. In each phase we will identify some critical characteristics or parameters that are going to influence the financial value directly or indirectly.