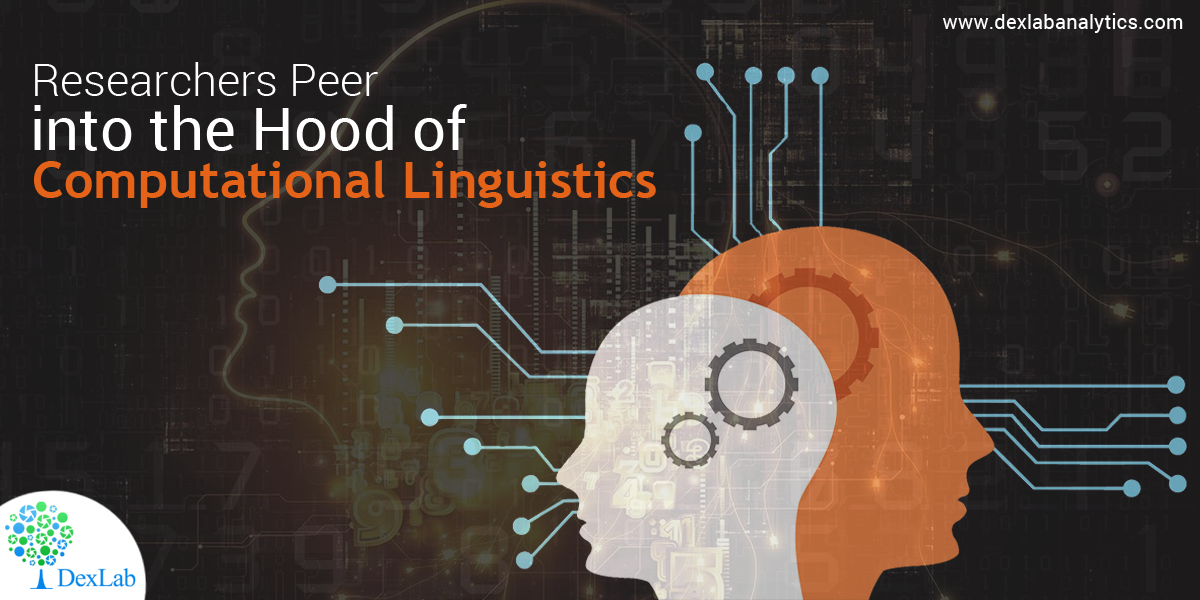
Well, these two sentences have virtually similar words, but owing to their structure, they exude entirely two different meanings. Understanding the true meaning of the sentences just by having a look at the words was something only reserved for the human intelligence, until now. Breakthroughs in Natural Language Processing (NLP), also known as computational linguistics have blazed a trail in this domain, which was once dominated by humans.
Use intelligence to make the world a better place to live in – Google’s London-based AI coterie, DeepMind is a pioneer in artificial intelligence research programs and has churned out two distinct types of AI that uses the ‘power of imagination’ to plan ahead and fulfil tasks with a higher success rate than the previous ones that lacked imagination.
In a recent interview, DeepMind researchers shared a crisp review of “a new family of approaches for imagination-based planning.” I2As, the so-called Imagination-Augmented Agents make use of an internal ‘imagination encoder’, which helps the AI determine what are and what aren’t productive predictions about its atmosphere.
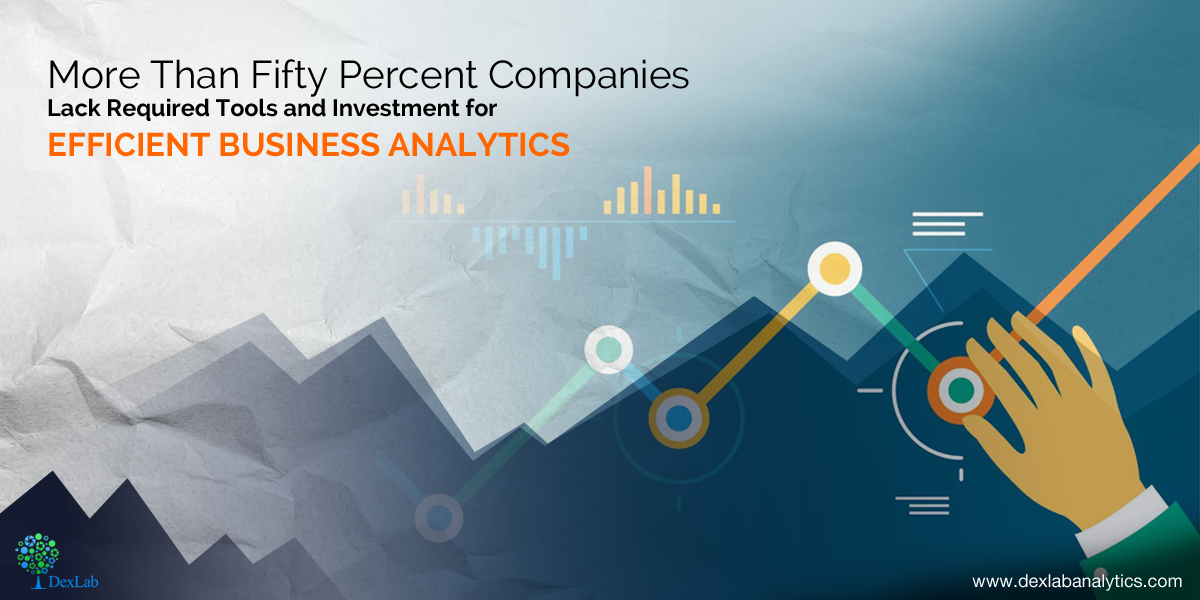
Fifty-nine percent of the companies around the world are not using Predictive Models or Advanced Analytics – says Forbes Insights/Dun & Bradstreet Study.
A recent study by Forbes Insights and Dun & Bradstreet, “Analytics Accelerates Into the Mainstream: 2017 Enterprise Analytics Study,” elucidates the ever-increasing indispensable role that analytics play in today’s business world, all the way from devising strategies to operations. The gloomy Forbes study highlights the crucial need for immediate investment, implementation and prioritization of analytics within companies.
The survey was carried on more than 300 senior executives in Britain, Ireland and North America and the report illuminates that the leading corporate giants need to invest more on the people, the processes they use and technologies that authorize decision support and decision automation.
Bruce Rogers, chief insights officer at Forbes Media was found quoting, “This study underlines the need for continued focus and investment,” he further added, “Without sophisticated analysis of quality data, companies risk falling behind.”
“All analytics are not created equal,” said Nipa Basu, chief analytics officer, Dun & Bradstreet. She explained, “This report shows a critical opportunity for companies to both create a solid foundation of comprehensive business data – master data – and to utilize the right kind of advanced analytics. Those that haven’t yet begun to prioritize implementation of advanced analytics within their organizations will be playing catch-up for a long while, and may never fully recover.”
Key findings revealed:
Need for tools and best practices
Though data usage and consumption growth brags about success, little sophistication is observed in how data are analysed. Only 23% of the surveyed candidates are found to be using spreadsheets for all sorts of data work, while another 17% uses dashboards that are a little more efficient than spreadsheets.
The survey says mere 41% rely on predictive models and/or advanced analytical and forecasting techniques, and 19% of the respondents implement no analytical tools that are more complicated than fundamental data models and regressions.
Skill deficiency stalling analytics success
Twenty seven percent of respondents diagnosed with skill gaps as a major blocker between current data and analytics efforts. Fifty two percent were found to be working with third-party data vendors to tackle such lacks of skills. Moreover, 55% of the surveyed contestants said that third-party analytics partners performs better than those who works in-house, exhibiting both a shortage of analytics capabilities among in-house analysts and a dearth in skilled workers.
Investment crunch
Survey respondents ticked lack of investment and problems with technology as the top hindrances to fulfilling their data strategy goals. Despite the increasing use of data, investment in deft personnel and technology is lagging behind.
CFO’s introspect into data for careful insights
According to the survey, 63% of those who are in the financial domains shared they are using data and analytics to discover opportunities to fund business growth. Further, 60% of the survey respondents revealed they rely on data to boost long-term strategic planning.
To learn more about Data Analyst with Advanced excel course – Enrol Now. To learn more about Data Analyst with R Course – Enrol Now. To learn more about Big Data Course – Enrol Now.
To learn more about Machine Learning Using Python and Spark – Enrol Now. To learn more about Data Analyst with SAS Course – Enrol Now. To learn more about Data Analyst with Apache Spark Course – Enrol Now. To learn more about Data Analyst with Market Risk Analytics and Modelling Course – Enrol Now.
Two decades ago, if someone asked me to write a computer program that played tic-tac-toe, I would have failed horribly. Now being an accomplished computer programmer, I know the desirable tricks to solve tic-tac-toe with the help of “Minimax Algorithm”, and what it takes is just about an hour to jot down the program. No doubt, my coding skills have evolved over the period of time, but also computer science technology has reached unattainable heights.
Computers paved the ways for a startled innovation. When in 1997, IBM introduced a chess-playing computer, known as Deep Blue, which eventually beat world-renowned Grandmaster Garry Kasparov in a six-game match, people remained in awe for years. Following the trend, in 2016, Google’s London-based AI Company, DeepMind launched AlphaGo – and it mastered over the ancient board game Go. Computers have outplayed the best human players in the games of chess, draughts and backgammon, now it’s time for Go.
The technology goes on thriving, beating humans at games. In late May, AlphaGo is all set to take on its human rival Ke Jie, the best player in the world during the Future of Go Summit in Wuzhen, China. Games, which solely relied on human intelligence, wit, intuition, discern is now excelled by the AI, which is powered by improved engineering and computer superiority.
Don’t you think this is great! Where AI is driving our cars, looking for ways to cure deadly cancer and helping us in everyday work, winning at Go takes AI a step ahead. It not only makes the games more fun and exciting, but endlessly enjoyable.
The strategy explained
In the eastern part of the world, notably in China, Japan and South Korea, Go is extremely popular and many celebrities indulge in it. The game developers showed interest for long in the complexity of this game. However, the rules are simple – the main objective is to secure the maximum territories by placing and capturing black and white stones on a 19×19 grid.
Chess is less complicated than Go; in the latter, the chances of recognising wins and losses is relatively tougher, as stones possess equal values, and ensures understated impacts throughout the board. To play Go, AlphaGo program implemented deep learning in neural networks – a brain-stimulated program. The connections formed here runs in-between layers of simulated neurons, further strengthened by examples and experiences. Firstly, it analysed 30 million positions from expert games, while gaining abstract information about the state of play from the board data, just like other programmes that classify images from pixels. After all this, finally it played against itself over 50 computers to improve its performance, with each iteration and this came to be known as reinforcement learning.
The round of applause
“AlphaGo plays in a human way”, says Fan – DeepMind’s program AlphaGo beat Fan Hui, the European Go champion. He further added, “If no one told me, maybe I would think the player was a little strange, but a very strong player, a real person.” “The program seems to have developed a conservative (rather than aggressive) style”, adds Toby Manning, a veteran Go player and a referee.
To learn more about Advanced Credit Risk Modeling course – Enrol Now. To learn more about Advanced IFRS9 Certification Course – Enrol Now. To learn more about Big Data Course – Enrol Now.
To learn more about Machine Learning Using Python and Spark – Enrol Now. To learn more about Data Analyst with SAS Course – Enrol Now. To learn more about Data Analyst with Apache Spark Course – Enrol Now. To learn more about Data Analyst with Market Risk Analytics and Modelling Course – Enrol Now.
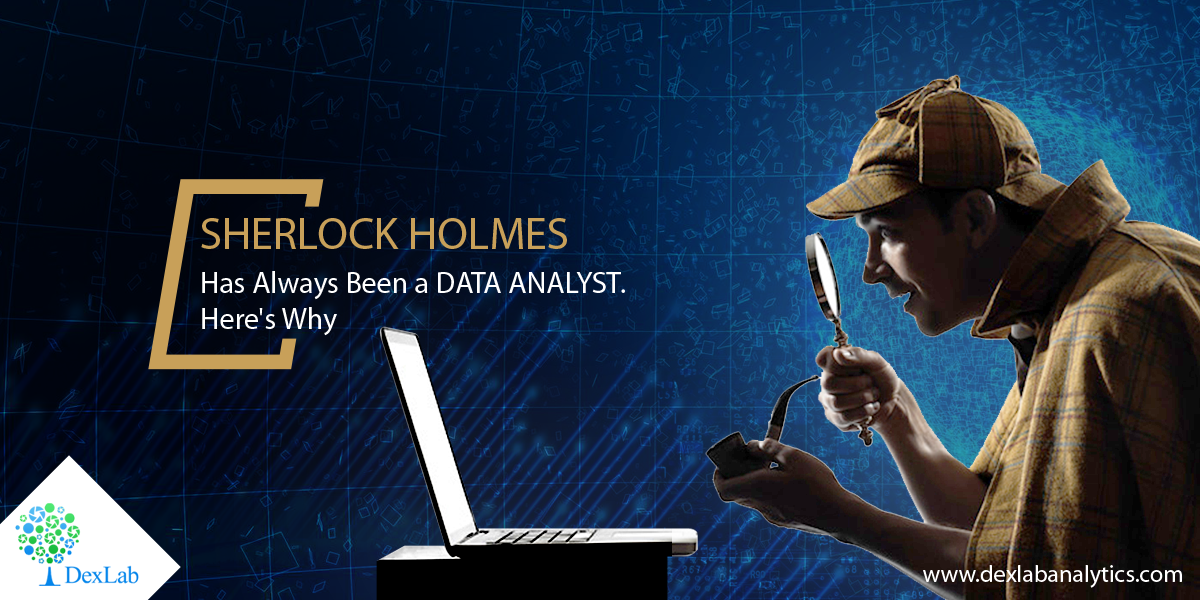
The job of a data analyst or scientist revolves around gathering a bunch of disorganized data, and then using them to build a case through deduction and logic. Finally, following that you will reach a conclusion after analysis.
Below quote from Sherlock Holmes is relevant –
“When you have eliminated the impossible whatever remains, no matter how Improbable it is must be the truth.”
He always started each case by focusing on the problem.
The problem would sometimes arrive in the form of a letter, sometimes as an item in the newspaper, but most often, it would announce itself by a knock at the door. The client would then present the mystery to Holmes and he would probe the client for salient information. Holmes never relied on guesswork or on assumptions. For Holmes, each new case was unique, and what mattered were reliable and verifiable facts about the case. These gave the investigation an initial focus and direction.
Deduction, Reasoning & Analytics
“It is a capital mistake to theorize before one has data. Insensibly one begins to twist facts to suit theories, instead of theories to suit facts.”
Similarly a data analyst is expected not to assume or formulate theories, which can make the reasoning biased. In his stories, Sherlock Holmes demonstrates his keen powers of observation and deduction from data in front of him. He can decipher how the light enters in Watson’s bathroom based on how his beard is shaved; he attests one person has lived in China from one of his tattoos; he discovers previous financial situation of a man who he had never seen before just looking to the hat the man had just used.
A data scientist has powerful computational and statistics tools that help him finding patterns amid so much data.
In the end, a data analyst’s introduction can be similar to what Sherlock said:
“My name is Sherlock Holmes. It is my business to know what other people do not
To learn more about Machine Learning Using Python and Spark – click here. To learn more about Data Analyst with Advanced excel course – click here. To learn more about Data Analyst with SAS Course – click here. To learn more about Data Analyst with R Course – click here. To learn more about Big Data Course – click here.
A data architect is a noteworthy role in the present analytics industry. One can naturally evolve from a data analyst or a database designer to a data architect after gathering sufficient experience in the field. The prominence of this role showcases the emergence of the online websites and other internet avenues which require the integration of data from several unrelated data sources.
These data sources can be anything from:
External sources, like market feeds (for e.g. Bloomberg) or other News Agencies (like, Reuters)
Or they could be internal sources like exiting systems that collect data, for instance HR operations that gather employee data
Here is a depiction of a day in the life of a successful data architect:
Data analyst certification from a reputable analytics-training institute can help to speed up your process of evolution from being a data analyst to becoming a successful data architect!
To learn more about Data Analyst with Advanced excel course – Enrol Now. To learn more about Data Analyst with R Course – Enrol Now. To learn more about Big Data Course – Enrol Now.
To learn more about Machine Learning Using Python and Spark – Enrol Now. To learn more about Data Analyst with SAS Course – Enrol Now. To learn more about Data Analyst with Apache Spark Course – Enrol Now. To learn more about Data Analyst with Market Risk Analytics and Modelling Course – Enrol Now.
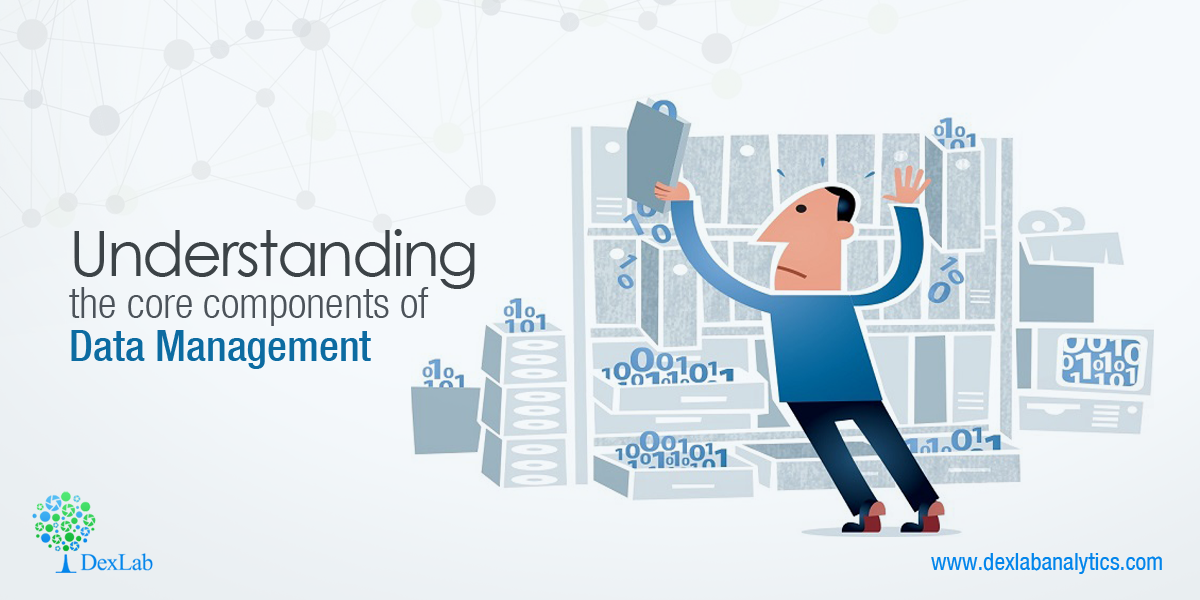
Ever wondered why many organizations often find it hard to implement Big Data? The reason often is poor or non-existent data management strategies which works counterproductive.
Data cannot be delivered or analysed without proper technology systems and procedural flows data can never be analysed or delivered. And without an expert team to manage and maintain the setup, errors, and backlogs will be frequent.
Before we make a plan of the data management strategies we must consider what systems and technologies one may need to add and what improvements can be made to an existing processes; and what do these roles bring about in terms of effects with changes.
However, a much as is possible any type of changes should be done by making sure a strategy is going to be integrated with the existing business process.
And it is also important to take a holistic point of view, for data management. After all, a strategy that does not work for its users will never function effectively for any organization.
With all these things in mind, in this article we will examine each of the three most important non-data components for a successful data management strategy – this should include the process, the technology and the people.
Recognizing the right data systems:
There is a lot of technology implemented into the Big Data industry, and a lot of it is in the form of a highly specific tool system. Almost all of the enterprises do need the following types of tech:
Data mining:
This will isolate specific information from a large data sets and transform it into usable metrics. Some o the familiar data mining tools are SAS, R and KXEN.
Automated ETL:
The process of ETL is used to extract, transform, and also will load data so that it can be used. ETL tools also automate this process so that human users will not have to request data manually. Moreover, the automated process is way more consistent.
Enterprise data warehouse:
A centralised data warehouse will be able to store all of an organization’s data and also integrate a related data from other sources, this is an indispensible part of any data management plan. It also keeps data accessible, and associates a lot of kinds of customer data for a complete view.
Enterprise monitoring:
These are tools, which provide a layer of security and quality assurance by monitoring some critical environments, with problem diagnosing, whenever they arise, and also to quickly notify the team behind analytics.
Business intelligence and reporting, Analytics:
These are tools that turn processed data into insights, that are tailored to extract roles along with users. Data must go to the right people and in the right format for it to be useful.
Analytics:
And in analytics highly specific metrics are combined like customer acquisition data, product life cycle, and tracking details, with intuitive user friendly interfaces. They often integrate with some non-analytics tools to ensure the best possible user experience.
So, it is important to not think of the above technologies as simply isolated elements but instead consider them as a part of a team. Which must work together as an organized unit.
To learn more about Data Analyst with Advanced excel course – Enrol Now. To learn more about Data Analyst with R Course – Enrol Now. To learn more about Big Data Course – Enrol Now.
To learn more about Machine Learning Using Python and Spark – Enrol Now. To learn more about Data Analyst with SAS Course – Enrol Now. To learn more about Data Analyst with Apache Spark Course – Enrol Now. To learn more about Data Analyst with Market Risk Analytics and Modelling Course – Enrol Now.
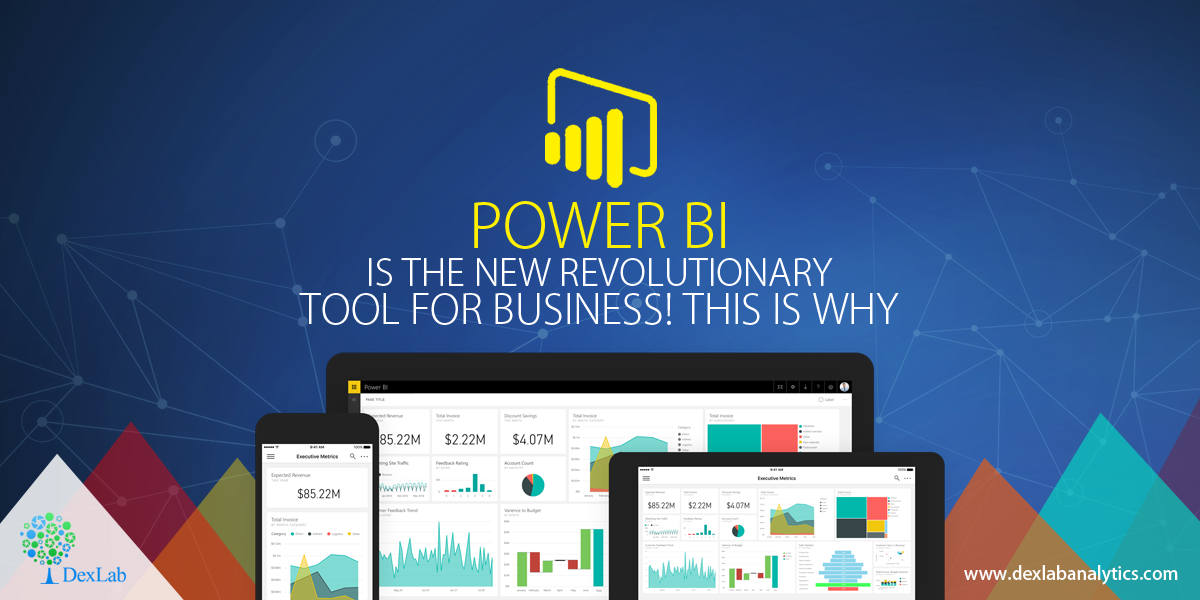
Microsoft launched its Power BI tool quite some time ago now, and the way things seem to advance is pretty amazing to say the least. This is a great Business Intelligence and analytics tool and it seems it is only a matter of time before the Power BI becomes the tool of choice for Business Intelligence and analytical works in almost all of the foresighted corporations.
This is a powerful BI tool now available in the hands of enterprises, who are looking to extract data from multiple disparate sources in order to derive meaningful insights from it. The tool offers unprecedented interactive visualization opportunities along with true self-servicing analytical capacities.
With all of these it helps the whole look of the same data to appear from varying angles and also allows the reports and dashboards to be made by anybody within the organization without assistance from IT administrators and developers.
The international analytics and BI market is to reach the mark of USD 16.9 Billion in 2016 says Gartner!
Power BI is leading the way in cloud business analytics and intelligence. It offers the services, which can directly be harnessed from the cloud, and it is a huge advantage when it comes to how BI can be utilized. The desktop version of power BI is also available and is known as the Power BI desktop.
The entire range of ordinary tasks can be performed with this Power BI like – data discovery, data preparation, designing of the interactive dashboards. Microsoft also went a step ahead by putting up the embedded version of Power BI in its highly revered Azure cloud platform.
The company already has a pretty good presence in the analytics environment with its popular products like SSAS – SQL Server Analysis Service. However, it did not have any strong presence in the BI delivery system and OLAP segment i.e. Online Analytical Processing.
Excel for a long time has been Microsoft’s attempt at being a presentation layer for its data analysis tools. However, Excel has a lot of disadvantages like limited memory, integrity issues with data which are the main reasons why it is often not very appealing to the corporate clients who want something more malleable for business analytics.
However, a really powerful BI tool is what takes Excel to a great new level; it helps to offer a whole new experience to working with tools like Power Query for data extraction and its transformation. The Power Pivot tool which, is deployed for data analysis and modelling and lastly, the Power View which, is used to map the data and visualize it distinctly in unprecedented ways. With Power Bi one can put all of these tools into a consolidated manner and will make it easier to work without having to depend on to MS Office solely.
In closing thoughts, thus, it is safe to say that Power Bi is putting the right use of power in the right hands of the customers. so, a power BI training can be a good decision for one’s career at this point, for those who consider themselves as a forward-thinking IT professional.