Big data training Archives - Page 7 of 8 - DexLab Analytics | Big Data Hadoop SAS R Analytics Predictive Modeling & Excel VBA

Big Data Analytics and its Impact on Manufacturing Sector

Big Data Analytics and its Impact on Manufacturing Sector

It is no new news that the Big Data and software analytics have had a huge impact on the modern industries. There are several industry disruptors that have surfaced in the past few years and totally changed the lives of all connected humans. Like Google, Tesla and Uber! These are the companies that have used the long list of benefits presented to us by Big Data to expand and infiltrate newer markets, they have helped themselves improve customer relations and enhance their supply chains in multiple segments of market.

As per the latest IDC Research projects the sale of Big Data and analytics services will rise to USD 187 billion in 2019. This will be a huge leap from the USD 122 billion which was recorded in 2015. A major industry that stands to benefit greatly from this expansion which is the manufacturing industry, with the industry revenue projections ranging to USD 39 billion by 2019.

The industry of manufacturing has come a long way from the age of craft industries. But back then, the manufacturing process involved a slow and tedious production processes which only yielded limited amounts of products.

The effects of Big Data Analytics on the Manufacturing sector:

 Automated processes along with mechanization have resulted in a generation of large piles of data, which is, much more than what most manufacturing enterprises know what to do with them.

But such data can yield beneficial insights for the manufacturing units to improve their operations and increase their productivity. Here are a few notable ones:


The effects of Big Data Analytics on the Manufacturing sector:

Image Source: mckinsey.com

Savings in cost:

Big data analytics can really help transform the manufacturing process and revolutionize the way they are carried out. The obtained information can be used to reduce the cost of production and packaging during manufacturing. Moreover, companies which implement data analytics can also reduce the cost of transport, packaging along with warehousing. This is in turn can help inventory costs and return i huge savings.

Improvement in safety and quality:

A lot of manufacturing companies are now making use of computerised sensors during the production to sift through low quality products while on the assembly line. With the right software analytics enterprises can use the data generated from such sensors to improve the quality and safety of the products instead of simply throwing away the low quality products after the production.

Improvement in safety and quality:

Image Source: blogs-images.forbes.com

Tightening up the workforce efficiency:

They can also use this data to improve management and employee efficiency. Big data analytics can be used to study the error rates on the production floor and use that information to analyse specific regions where employees are good when they perform under pressure.

Moreover, data analytics may help to speed up the production process n the production floor. S will be especially useful for large firms, which work with large volumes of data.

Better collaboration:

A great advantage of having an IT based data collection and analysis infrastructure is improved information movement within the manufacturing organization. The synergy of flow of information within the management and engineering departments as well as in the quality control sector and between the machine operators and other departments of the company helps them work more efficiently.

The manufacturing industry is much more complex than any other industry, which have implemented the big data analytics. Companies must effectively time the implementation of this software so that there are no losses. And should also pay attention as to from where they can mine the data and the right analytics tools to use for producing feasible and actionable results.


Interested in a career in Data Analyst?

To learn more about Data Analyst with Advanced excel course – Enrol Now.
To learn more about Data Analyst with R Course – Enrol Now.
To learn more about Big Data Course – Enrol Now.

To learn more about Machine Learning Using Python and Spark – Enrol Now.
To learn more about Data Analyst with SAS Course – Enrol Now.
To learn more about Data Analyst with Apache Spark Course – Enrol Now.
To learn more about Data Analyst with Market Risk Analytics and Modelling Course – Enrol Now.
Governance is Planning To Drive Compliance With GDPR

Governance is Planning To Drive Compliance With GDPR

The companies’ data governance program is usually linked to the implementation of the General Data Regulation Program. And throughout time several articles have been written about to link the two initiatives but till none was so clearly distinct as the recent one on LinkedIn by Dennis Slattery. He made an analogy of a wedding between Governance and Privacy, which is very fitting but also highlights the fact that, a long term marriage with optimum success is based on the foundations that strengthen it with mutual efforts.

We can also take a similar message from the famous quote by Henry Ford – coming together is just the beginning, keeping together is actual progress, and working together is success.

Data analytics should tie its hands with privacy policies for a successful approach towards good business.

So, how can we make this marriage successful?

The GDPR regulation is quite clear on what it states, about things that must be done in order to protect the Data Citizen’s Rights. However, the bigger question most companies are facing is how to comply with regulations and/or go beyond the bare minimum and let GDPR work for them.

Majority of such discussions around the topic of how to implement GDPR today are focussed on one of two approaches – either top down or bottoms up. But we would argue otherwise, as these two approaches are not mutually exclusive and that a successful implementation of the GDPR must be based on a combination of these complementary approaches.

For the top down approach, the team for GDPR will reach out to the businesses to get a clear understanding of all business (data) processes, which involve either one or another. And for each of these processes like for third party credit checks, data analytics, address verification, and much more there are several attributes which must be clarified. Like for instance:

  1. Have they acquired consent for the particular process?
  2. What is the business purpose for the collection?
  3. Who is the controller?
  4. Who is the processor?
  5. Who is responsible as the Data protection officer?
  6. What is the period for retention of data?
  7. What type of data is collected?
  8. Along with several other information

However, it must be noted that this is not a one-time effort, once all the processes related to the personal data have been identified and classified they will still be needed to be maintained as the organization grows and evolves with development in its infrastructure over time.

The bottom up approach is a little more technical in nature. The businesses that have already established metadata management tools can then use these technologies to identify personally the identifiable information (PII) and then try and classify these data elements and assign the relevant attributes for GDPR. This approach shall quickly hit a bottleneck as the same data can be utilized for several business purposes and thus, cannot be classified for GDPR.

With successful implementation of the GDPR we will be able to marry both the approaches well.

Big Data Hadoop training from DexLab Analytics from Dexlab Analytics


Interested in a career in Data Analyst?

To learn more about Machine Learning Using Python and Spark – click here.
To learn more about Data Analyst with Advanced excel course – click here.
To learn more about Data Analyst with SAS Course – click here.
To learn more about Data Analyst with R Course – click here.
To learn more about Big Data Course – click here.

Big Data Analytics Is Helping To Curb Cancer For More Than 40 Years Now

The times now are such that we can name at least one of our friends, relatives or peers who have fought the dreadful battle with cancer. But luckily for us there are several people who along with their loved ones have not only fought this battle with courage but have triumphed to achieve sweet survival. But such glorious accomplishments would not have occurred if it were 40 years ago.

 
Big Data Analytics Is Helping To Curb Cancer For More Than 40 Years Now


As per the reports, adults who were diagnosed with cancer back in 1975 only had a lowly 50/50 chance of survival after five years of being diagnosed. But today the relative five year after rate of survival across all types of cancer is as close as 70 percent. And for better, the cancer survival rate during the same time frame for child cancer patients within five years of diagnosis has improved from the previously existing 62 percent to 81 percent, which is a steep rise. Continue reading “Big Data Analytics Is Helping To Curb Cancer For More Than 40 Years Now”

The Best Analytics Tools for Business And How to Make The Most of Them

The Best Analytics Tools for Business And How to Make The Most of Them

All companies are awash with useable data about their customers, prospects and internal business operations as well as suppliers and partners. But most of them are also ill-equipped with the requisite understanding to leverage this streaming flood of data and cannot convert it to actionable insights to increase their revenue by growing their revenue thus, increasing their efficiency. Business intelligence tools are technology that allows businesses to transform their data into actions for generating better business.

The Business Intelligence and analytics industry has been around for decades now and is considered by most analytics personnel as a mature industry. But this BI market is never static with constant evolution and innovation to prepare for meeting the ever expanding needs of businesses of all sizes and from a diverse range of industries. So, it is imperative that people gather an understanding of the different Business Analytics tools for better operation of their companies.

2

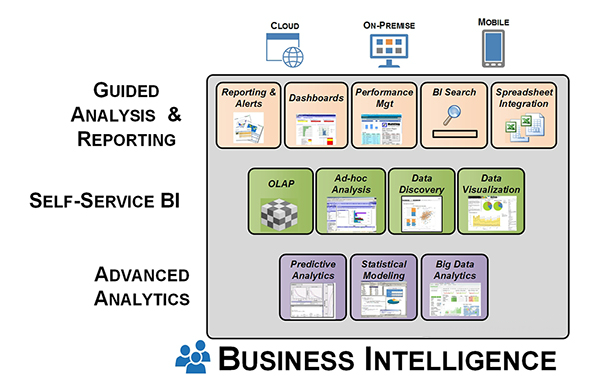
Business Intelligence tools can be categorised in three different groups:

  • Guided analysis and reporting
  • Self-service Business Intelligence and Analysis
  • Advanced Analytics

The first category of guided analysis and reporting includes Business Intelligence tools of traditional styles that have long been used for years to perform recurrent data analyses of specified data groups. This system of data analysis was only used for predefined static reporting several years ago, but today it is possible for data analysts to select, compare, visualize and analyse data using various tools and features.

Tool styles in this category include the following:

  • Reports
  • Scorecards and dashboards
  • Spreadsheet integration
  • BI Search
  • Corporate Performance Management

The second category of BI tools which falls under the category of self-service BI and analysis includes the tools BI users utilize to make ad hoc analysis of data. Such analytical practices may be a one-time analysis or building of a recurring analytical system that may with shared by others.

Usually the users of such Bi tools have a dual role to play – consumer of information and producer of analytical systems. They usually share or publish their BI application which they build with the self-service BI tool. The users of such tools will always have the term analyst in their job title. Staff members of the management department may also make use of such tools when they need to perform similar tasks as that of a business analyst, for their peers even if their job title does not imply that.

The Business Intelligence tools include in this category includes the following:

  • Ad hoc analyses and reporting
  • OLAP cubes i.e. online analytical processing
  • Data visualization
  • Data discovery

The third category of advanced analytics includes the tools that a data scientist uses to build predictive and prescriptive models of analysis. These are tools for predictive modelling, statistical modelling and data mining along with rigorous use of big data analytics software. In these cases data analyst spend a huge chunk of their time performing tasks like data ingestion, cleansing and integration.

To understand the full spectrum of different Business Intelligence tool classes here is a visual explanation:

dexlab

Who should invest in BI tools?

For a long time now investment and use of BI tools has been growing gradually regardless of the economic conditions. And it has especially accelerated in the recent times as companies crave for data for better growth and more organized operations. While data analytics tools were mainly associated with large enterprises due to their cost, complexity and demand of high skilled personnel, but those factors have now been grossly transformed as more and more SMBs (small and medium sized businesses) now being significant customers of BI tools and software.

Now that you have a good understanding of the different tool categories and how they should be deployed, the next step for you is to understand your  company specific needs and make the best use of these tools that are optimized for so.


Interested in a career in Data Analyst?

To learn more about Data Analyst with Advanced excel course – Enrol Now.
To learn more about Data Analyst with R Course – Enrol Now.
To learn more about Big Data Course – Enrol Now.

To learn more about Machine Learning Using Python and Spark – Enrol Now.
To learn more about Data Analyst with SAS Course – Enrol Now.
To learn more about Data Analyst with Apache Spark Course – Enrol Now.
To learn more about Data Analyst with Market Risk Analytics and Modelling Course – Enrol Now.
Big Data is the New Obsession of Small Business Owners

Big Data is the New Obsession of Small Business Owners

While this may seem somewhat counterintuitive, but instead of large organizations, it is actually small business owners and midsize companies who tend to be more inclined towards the applications of Big Data. They are also the first to adopt these latest technological innovations of which analytics is no exception – as these internet and data based insights are highly accessible and also affordable for SMBs.

As per the researchers in the fields of technology, the entry level capabilities in such fields like analytics has abruptly dropped which is why almost all types of industries from an array of sectors are engaging with them to enhance their competitiveness; and the wheels have already started to roll when it comes to increasing overall global competitiveness. Continue reading “Big Data is the New Obsession of Small Business Owners”

Credit Risk Managers Must use Big Data in These Three Ways

Credit risk managers must use Big Data in these three ways

While the developed nations are slowly recovering from the financial chaos of post depression, the credit risk managers are facing growing default rates as household debts are increasing with almost no relief in sight. As per the reports of the International Finance which stated at the end of 2015 that household debts have risen to by USD 7.7 trillion since the year 2007. It now stands at the heart stopping amount of a massive USD 44 trillion and the amount of debts increased in the emerging markets is of USD 6.2 trillion. The household loans of emerging economies calculating as per adult rose by 120 percent over the period and are now summed up to USD 3000.

To thrive in this market of increasing debts, credit risk managers must consider innovative methods to keep accuracy in check and decrease default rates. A good solution to this can be applying the data analytics to Big Data. Continue reading “Credit Risk Managers Must use Big Data in These Three Ways”

How Can Big Data Impact the Lives of Students?

According to figures released by IBM opine that no less than 2.5 quintillion bytes created on a daily basis. Also it is worthwhile to note that a whopping 90% of the total data in the world have been created only in last two years.

In simple terms data is just pieces of information. The highly prominent concept of our times owes its origins to large data amounts which are derived from all sorts of computing devices. This data is then stored, collated and combined with the sophisticated tools for analytics available today.

Big Data is helpful to a broad spectrum of people from marketers to researchers. It helps them to understand the world around them and take optimized action through insights. Students too stand to benefit from Big Data a great deal and in this post we look at two ways through which Big Data may affect the lives of students.

It Helps To Be More Effective

Teachers have always been an informed lot, using data in order to optimize the practices and methods, Big Data facilitates the creation of far more powerful ways through which teachers and students may connect. As the focus shifts towards personalized learning, teachers are in a position to utilize more data than ever before.

This may be achieved through monitoring of study materials and how they are used by students in order to deliver more targeted instruction. With Big Data teachers will be able to better understand the needs of students and adapt lessons effectively and swiftly and in the end make decisions about enhanced learning for students, driven on the basis of data.

2

There is a Huge Demand for Data Scientists

Data Science was dubbed as the sexiest job of this century by Harvard Business Review and with good reason. People are just beginning to explore the possibilities enabled by Big Data and the need of skilled people in the field will only continue to increase in the years to come. Data Scientists have the ability to mine through data to the benefit of their employers including but not restricted to governments, businesses and of course, the academia.

McKinsey Global Institute reported that by 2018 there will be a shortage of no less than 190,000 persons with skills in deep analytics in the United States of America alone. There is no shortage for opportunities in this field and there are numerous programs all over the world that smooth out the career transition to Big Data. Work arrangements that display flexibility, more than decent compensation packages and the opportunity to make a significant impact are the added bonuses that go along being a data scientist.

We may conclude by saying that though Big Data is still emerging it held by most experts to be the undeniable future not only for those pursuing studies in data science and making careers in the field but to all the people whose lives are changed for the better through Big Data.


Interested in a career in Data Analyst?

To learn more about Data Analyst with Advanced excel course – Enrol Now.
To learn more about Data Analyst with R Course – Enrol Now.
To learn more about Big Data Course – Enrol Now.

To learn more about Machine Learning Using Python and Spark – Enrol Now.
To learn more about Data Analyst with SAS Course – Enrol Now.
To learn more about Data Analyst with Apache Spark Course – Enrol Now.
To learn more about Data Analyst with Market Risk Analytics and Modelling Course – Enrol Now.
Sure shot Ways to Crack Big Data Interviews

Sure shot Ways to Crack Big Data Interviews

If you are a Big Data analyst looking for open position in the entry to mid level range of experience then you should prepare yourself with the following resources in your arsenal before you storm an interview with all guns blazing.

  • Adequate Expertise of Analytical tools like SAS for the processing of data

Make sure that you assign most of the time you have set aside for the preparation of your upcoming interview to brush up your knowledge regarding the tools of analytics that are relevant in your context. Ensure that you acquire proficiency in the analytics tool of your choice. For positions of junior levels the importance of expertise with a particular analytical tool like Hadoop, R or SAS cannot be overstressed. In such circumstances the focus centers around data preparation and processing. It is highly advisable that you review concepts related to the import and manipulation of data, the ability to read data even if it not standard say for example data whose input file types are multiple in number and mixed data formats. You also get to show off your skills at efficiently joining multiple datasets, selecting conditionally the observations or rows of data, how to go about heavy duty data processing of which SQL or macros are the most critical.

  • Make a Proper Review of End to End Business Process

This is most relevant towards candidates who have prior experience at working in the Big Data and Analytics industry. Prior experience inevitably gives rise to interviewers wanting to know more about the responsibilities that you shouldered and your role in the business process and how you fitted in the context of the broader picture. You should be able to convey to the interviewer that the data source is understood by you along with its processing and use.

  • A solid concept of the rudiments of statistics and algorithms

Again this tip is also for those with prior experience. Recruiters seek to know whether you are aware of issues likely to be faced by you while you confront problems regarding data and business. Even freshers are expected to know the fundamental concepts of statistics like rejection criteria, hypothesis testing outcomes, measures of model validation and the statistics related assumptions that a candidate must know about in order to implement algorithms of various sorts. In order to crack the interview you must be prepared with adequate knowledge of concepts related to statistics.

  • Prepare Yourself with At Least 2 Case Studies related to Business

The person on the other side of the interview table will undoubtedly try to make an assessment about your knowledge as far as business analytics is concerned and not solely to the proficiency you command in your tool of choice. Devote time to review projects on analytics you already have worked on if you have prior experience. Be prepared to elucidate on the business problem, the steps that were involved in the processing of data and the algorithm put into use in the creations of the models and reasons behind, and the way the results of the model was implemented. The interviewer might also ask about the challenges faced by you at any stage of the whole process, so keep in mind the issues faced by you in the past and their eventual resolution.

2

  • Make Sure that Your Communication Remains Effective

If you are unable to effectively communicate then no much diligent preparations you make, they will be of no use. You can try out mock interviews and answering questions that the recruiter might ask. Spare yourself of the trouble of framing effective answers at the moment when the question is asked during an interview. Though you perhaps will be unable to anticipate each and every question, nevertheless but prior preparation will result in better and more coherent answers.


Interested in a career in Data Analyst?

To learn more about Data Analyst with Advanced excel course – Enrol Now.
To learn more about Data Analyst with R Course – Enrol Now.
To learn more about Big Data Course – Enrol Now.

To learn more about Machine Learning Using Python and Spark – Enrol Now.
To learn more about Data Analyst with SAS Course – Enrol Now.
To learn more about Data Analyst with Apache Spark Course – Enrol Now.
To learn more about Data Analyst with Market Risk Analytics and Modelling Course – Enrol Now.

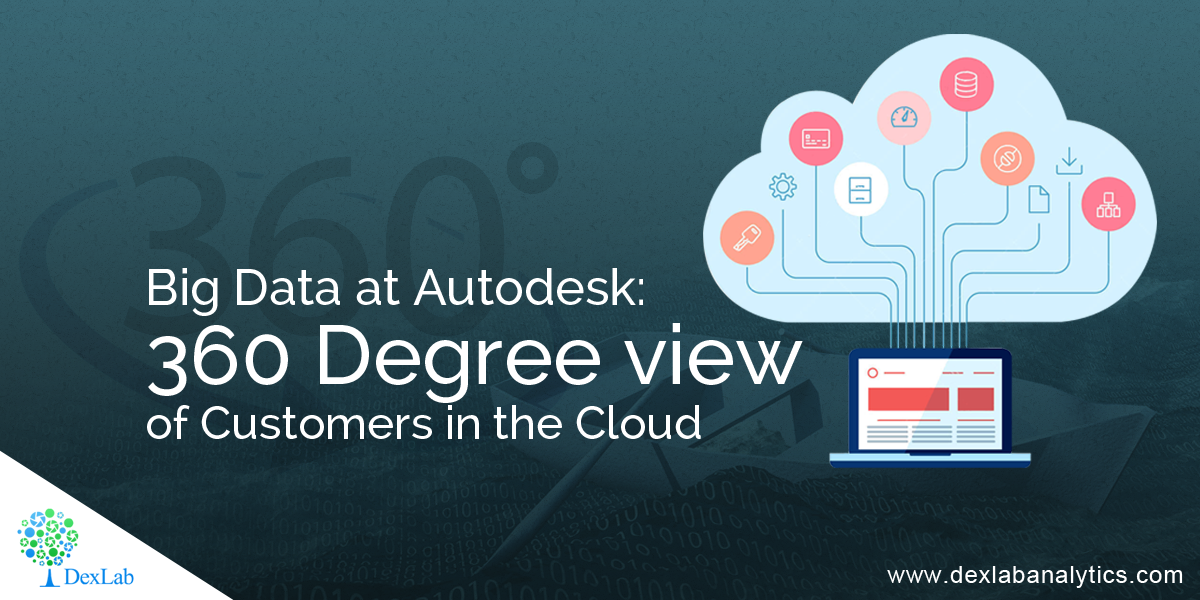
Big Data at Autodesk: 360 Degree view of Customers in the Cloud

The last few years have seen a huge paradigm shift for many software vendors. The move away from a product-based model towards software-as-a-service (SAAS) in the cloud has brought huge changes. The main advantage of moving from a product based model to software-as-a-service is that the companies will be able to identify the service usage of how and why a product is being used. Earlier software companies used to run a survey or focus groups of customer feedback to identify the how and why a product is being used. This customer feedback survey has various limitations on identifying the product usage or where the product improvement has to be made.

Here’s All You Need to Know about Quantum Computing and Its Future

Autodesk was one of the frontrunners in the field, having been experimenting with the cloud based SAAS as far back as 2001 when it is acquired the BUZZSAW file sharing and synchronization service. Since then Microsoft, Adobe and many others moving into a subscription based, on-demand service and Autodesk has done the same with its core computer aided design products.

Software-as-a-service is a software licensing and delivery model in which software is licensed on a subscription basis and is centrally hosted. It is sometimes referred to as on-demand software. On-premise software is the exact opposite where the delivery of product is inside the particular organizations infrastructure.

Understanding how customers use a product is critical to giving them what they want. In a SAAS environment where everything is happening online and in the cloud, companies can gain a far more accurate picture  

2


The idea of moving to cloud based subscription model gives the business to understand more about the product usage of customers. This gives them the edge to serve better to the customers. The shift in the industry shall not be ignored. Big Data is really being used now to understand how and where to improve the product.


The Indian IT industry is focusing mainly on Cloud, Analytics, Mobile and Social segment to further drive growth. This Software-as-a-service delivery model can certainly give the edge to do data analysis on where and how the product is used.


There are number of reasons why Software-as-a-service is beneficial to organizations:


  • No additional hardware costs, you can buy the processing power or hardware as per the requirement. Do not have to go for high end configuration as there is no requirement. Need based subscription.
  • Usage is scalable. You can scale whenever you require.
  • Applications can be customised.
  • Accessible from any location, rather than being restricted to installations on individual computers an application can be accessed from anywhere with an internet enabled device.


The adoption of cloud based delivery model is accelerating mainly because of the analytical capability it gives the business to understand the customers. Analytics rocks!.


For state of the art big data training in Pune, look no further than DexLab Analytics. It is a renowned institute that excels in Big data hadoop certification in Pune. For more information, visit their official site.


Interested in a career in Data Analyst?

To learn more about Machine Learning Using Python and Spark – click here.
To learn more about Data Analyst with Advanced excel course – click here.
To learn more about Data Analyst with SAS Course – click here.
To learn more about Data Analyst with R Course – click here.
To learn more about Big Data Course – click here.

Call us to know more