Big data training in Gurgaon Archives - Page 2 of 7 - DexLab Analytics | Big Data Hadoop SAS R Analytics Predictive Modeling & Excel VBA

How Google Is Fighting Floods in India with AI

How Google Is Fighting Floods in India with AI

Of late, the search engine giant, Google made a slew of announcements tailor-made for India focusing on new-age technologies, including Artificial Intelligence and Machine Learning. They are to improve response time to natural disasters, such as flood along with address healthcare challenges.

At their recently conducted annual flagship conference Google For India 2018, the search engine giant also revealed the company is eager to use crisis response and SOS alerts to predict natural disasters. Speaking to the context, Rajan Anandan, VP, India and SEA Sales and Operations at Google stated that technology does come to rescue during extraordinary conditions.

2

He further added, “India has gone online to rally behind the victims of the Kerala and Karnataka floods. Our Crisis Response team turned on SOS alerts on Google Search in English and Malayalam, and activated Person Finder to help people search for family and friends. Locations of flood relief resources like shelters are being shared on Google Maps. Outside of the tech support, Google.org and Googlers are contributing over $1 million to support relief and recovery efforts. And others are also donating towards the Kerala flood relief on Tez.”

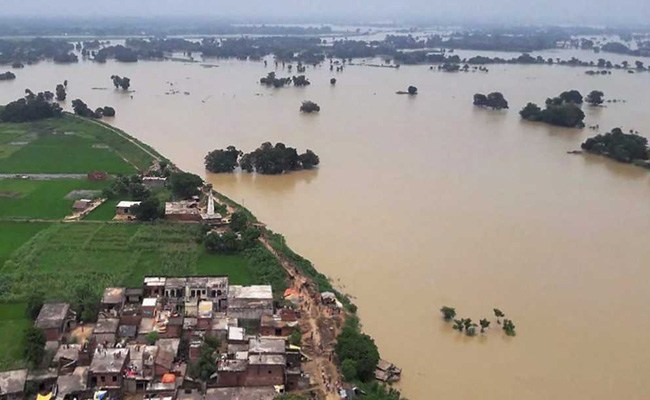
Floods are ravaging; especially in countries India, Bangladesh and China. It’s for them that Google considered it’s high time to devise something to prevent disasters happening in these countries. Thus, the team started seeking ways to implement AI for flood prediction. The recent Kerala flood was an eye-opener. Hundreds have lost their lives and thousands are still living in makeshift relief camps. The numbers say more than 7.8 lakh people are said to be living in these camps across Kerala.

To offer help, Goggle has initiated a steady stream of measures to assist the state. It has activated SOS alerts on Google search, which hooked all the response numbers and emergency resources in languages, English and Malayalam.

Talking about the technology launch, Google Technical Project Manager (TensorFlow) Anitha Vijayakumar was found saying, “We have been doing AI research to forecast and reduce the impact of floods… Floods are the most common disaster on the planet, and with adequate warning, we can greatly reduce the impact of floods. The current modelling systems are only physics-based, and the data is not detailed enough, while Google is using a system that combines physics modelling plus AI learning, and combines that with elevation and satellite map data.”

In addition, “We also activated Person Finder in English and Malayalam, to help people search and track family and friends – on last count, there were 22,000 records in person finder. We also extended this information on Google Maps to aid the rescue efforts,” said Rajan Anandan, Vice President of Google (South East Asia and India).

He further added that Google Tez’s (the notable payment) donation drive has so far raised USD 1.1 million towards Kerala Chief Minister Relief Fund. Also, Googlers and Google.org has donated USD 1 Million for recovery schemes and relief measures.

Now, that you are reading this blog, it means you are interested in the broad scopes of artificial intelligence and power it brings with it. Get enroll in Big Data Hadoop training in Gurgaon; DexLab Analytics offer state of the art Big Data Hadoop certification courses that’ll take you a step closer to fulfilling your dreams.


Interested in a career in Data Analyst?

To learn more about Data Analyst with Advanced excel course – Enrol Now.
To learn more about Data Analyst with R Course – Enrol Now.
To learn more about Big Data Course – Enrol Now.

To learn more about Machine Learning Using Python and Spark – Enrol Now.
To learn more about Data Analyst with SAS Course – Enrol Now.
To learn more about Data Analyst with Apache Spark Course – Enrol Now.
To learn more about Data Analyst with Market Risk Analytics and Modelling Course – Enrol Now.

DexLab Analytics’ AUGUST OFFER: Everything You Need to Know Of

DexLab Analytics’ AUGUST OFFER: Everything You Need to Know Of

We are happy to announce that we’re rolling some good news your way – DexLab Analytics is all set to launch exhaustive modules in Deep Learning with AI starting with Artificial Neural Networks using Python, MS Excel, Dashboards, VBA Macros, Tableau BI, Visualization and Python Spark for Big Data from September 1, 2018. The course modules are on in-demand skills and they are taking the world quite by a storm.

DexLab Analytics’ AUGUST OFFER

Big data, data science and artificial intelligence are buzz words these days. More and more people are coming forward and showing keen interest on these nuanced notions that solves real-world problems. This is why we didn’t want to fall behind. We understand the importance of data in this digitized world, and accordingly have chalked out our intensive industry-ready courses.

Deep Learning and AI starting with Artificial Neural Networks using Python course module is a 30-hour long training program that gives exposure to MLP, CNN, RNN, LSTM, Theano, TensorFlow and Keras. It includes more than 8 projects out of which a couple of focuses on development of models in to Image and Text recognition. MS Excel, Dashboards and VBA Macros certification is curated by the expert consultants after combining industry expertise with academician’s knowledge. The course duration is in total of 24 hours and is conducted by seasoned professionals with more than 8 years of industry experience specific to this budding field of science.

DexLab Analytics’ August Offer is On Machine Learning & AI

DexLab Analytics’ August Offer is On Machine Learning & AI

Next, we have30-hour hands-on classroom training on Tableau BI & Visualization certification, which teaches young minds how graphical representation of data unlocks company future trends and take quicker decisions. Tableau is one of the fastest evolving BI and data visualization tool. With that in mind, we offer a learning path to all you students by framing a structured approach coupled with easy learning methodology and course curriculum.  

DexLab Analytics Offers MS Excel, Dashboards and VBA Macros Certification!

DexLab Analytics Offers MS Excel, Dashboards and VBA Macros Certification!

Lastly, our Big Data with PySpark certification is another gem in the learner’s cap: the Spark Python API (PySpark) exposes users to the Spark Programming model with Python. Apache Spark is an open source and is touted as a significant big data framework for pivoting your tasks in a cluster. The main objective of this course is to teach budding programmers how to write python code using map-reduce programming model. The 40-hours hands-on classroom training will talk about Big Data, overview of Hadoop, Python, Apache Spark, Kafka, PySpark and Machine Learning.

Now, first 12 students who happen to register for each course on or before 30th August, 2018 will get alluring discount offer on the total course fee. Interesting, isn’t it? So, what are you waiting for? Go, grab all the details about AUGUST OFFER: to register, call us at +91 9315 725 902 / +91 124 450 2444 or hit the link below – www.dexlabanalytics.com/contact


Interested in a career in Data Analyst?

To learn more about Data Analyst with Advanced excel course – Enrol Now.
To learn more about Data Analyst with R Course – Enrol Now.
To learn more about Big Data Course – Enrol Now.

To learn more about Machine Learning Using Python and Spark – Enrol Now.
To learn more about Data Analyst with SAS Course – Enrol Now.
To learn more about Data Analyst with Apache Spark Course – Enrol Now.
To learn more about Data Analyst with Market Risk Analytics and Modelling Course – Enrol Now.

6 Indian Union Ministries That Are Using Artificial Intelligence

6 Indian Union Ministries That Are Using Artificial Intelligence

It’s no brainer; artificial intelligence has seeped deep into our lives and it has even caught the attention of Indian government. Indian government initiatives are proof of that. The NDA-led BJP government is an admirer of new technology and has given enough importance to AI by setting up an AI Task Force to arm India for the Industrial Revolution 4.0.

In fact, if you follow through a series of events or speeches, you’ll find how frequently our Prime Minister, Narendra Modi projects India and his government to be technologically-driven. In this blog, we’ll share how our top 6 Union Ministries are using Artificial Intelligence on a wider scale for better economy and powerful country presence:

Ministry of Defense

AI Task Force of the Ministry of Defense led by Tata Sons Chairman N Chandrasekaran filed its final report to Defense Minister Nirmala Sitharaman about employing AI for military superiority. The report includes recommendations regarding making India AI-empowered, both in terms of offensive and defensive needs, across naval, aviation, cyber, land, nuclear and biological warfare verticals.

NITI Aayog (the former Planning Commission)

The National Institution for Transforming India recently identified 5 sectors, namely ealthcare, agriculture, education, smart cities and infrastructure, smart mobility and transportation where profound importance will given towards AI implementation to serve societal needs.

Ministry of Information and Broadcasting

Recently, BECIL (Broadcast Engineering Consultants India Limited), functioning under the Ministry of Information and Broadcasting unveiled a tender showing the present government is more likely to take public opinion and media seriously. The government has chalked out a proposal for a respective “technology platform”, which would tap into public emotions by analyzing social media blogs, accounts, posts and even emails to promote nationalism and negate any media bickering by India’s adversaries.

Ministry of Railways

Indian Railways has been in a line of fire for its food catering services. Say thanks to Artificial Intelligence – AI is transforming the way the food is prepared. Not only is it revamping the entire food menu in trains but also promoting a greener environment by going bio-degradable and delivering food in environment-friendly containers.

Ministry of Home Affairs

First of its kind, Intelligence Traffic Management System is going to be installed by the Delhi Police, under the supervision of Home Ministry. This initiative will initiate smart traffic signals, with the help of AI and their first phase is going to be completed by April 2019.

Ministry of External Affairs

With intent to enhance the flow of information between countries, the Ministry of External Affairs had recently conducted a confidential meeting including global AI stalwarts to discuss how to drag attention of Indian Diaspora.

A quick bite: Niti Aayog, under the guidance of CEO Amitabh Kant has been a key stimulator of numerous digital campaigns across the country, including Aadhaar, encompassing biometric programme and India Chain Project.

Now, all you data enthusiasts chart your career in the right direction with DexLab Analyticsbig data hadoop certification in Noida!! DexLab Analytics being a noted big data hadoop institute in Noida offers nothing but the best.


The blog has been sourced from – analyticsindiamag.com/7-indian-union-ministries-who-have-embraced-artificial-intelligence-big-time


Interested in a career in Data Analyst?

To learn more about Data Analyst with Advanced excel course – Enrol Now.
To learn more about Data Analyst with R Course – Enrol Now.
To learn more about Big Data Course – Enrol Now.

To learn more about Machine Learning Using Python and Spark – Enrol Now.
To learn more about Data Analyst with SAS Course – Enrol Now.
To learn more about Data Analyst with Apache Spark Course – Enrol Now.
To learn more about Data Analyst with Market Risk Analytics and Modelling Course – Enrol Now.

How Big Data Analytics Power Profits for the Hospitality Industry

How Big Data Analytics Power Profits for the Hospitality Industry

The hospitality industry is highly dependent on customer satisfaction. And the analysis of big data can help this industry predict customer behavior by understanding their needs and expectations. This in turn enables the hotels and restaurants to provide personalized customer service and retain loyal customers.

Hospitality service provider Airbnb is making the most of the new ‘’mobile first’’ approach where responsive designs are created for the smallest screens. This mode allows customers to engage in Airbnb business through phones. Although big data and its analysis is a large part of the success for this industry, many companies are yet to fully understand the gains associated with big data.

Here are some ways how big data enables the hospitality industry to drive profits:

Take better control of business:

Effectively analyzing big data drastically changes how the business runs. The hotel industry is a data rich sector with massive volumes of web, audio and video content. However, many hotels don’t use their data to its full potential. For instance, hoteliers collect loyalty information but few exploit the data for making business decisions. Through analytical data exploitation, hotels can deepen their understanding of the behavior, needs and expectations of guests and develop better loyalty programs.

Customer segmentation and Targeting:

Hotels must use customer data to provide better customer service as that is essential for ensuring that customers return to avail their services again. Analyzing this data is crucial to segment customers based on booking and travel trends, preferences, chance of responding to promotions, etc. Targeting clients with wrong offers can hinder business growth. Data analysis allows them to retain their best repeat clients by good incentives and promotions. It also allows them to build separate deals for customers who don’t visit them often with the hopes of converting them to loyal customers.

Set best prices for rooms:

Big data analytics is very important for setting competitive hotel prices so that it attracts more guests. Apart from setting the best price for rooms, hospitality-driven businesses can optimize the budget for utilities through analysis of weather data and energy rates.

On-time delivery:

As big data tools become more and more advanced, it shall enable better collection of data from traffic, temperature, weather, route and other sources. This will improve food delivery by providing better estimates of time taken to deliver. Moreover, it shall help restaurants understand how all the aforementioned sources affect the quality of food. Thus, it helps to plan the transportation beforehand and optimizes the utilization of resources.

Menu enhancement:

Using the customer data on food preferences, restaurants can build a customer profile that contains their favorite food and drinks. From the data gathered through feedback forms and online surveys, they can identify the most popular items in their menu and determine whether their menu needs to be improvised or completely reengineered.

Hence, new sources of data and emerging technologies like IoT (Internet of Things) and AI (Artificial Intelligence) enable the hospitality industry to understand the current trends in the market and boost the overall profit of the enterprise.

Companies who are embracing the power of big data are reaping huge profits, and students who are enrolling for big data Hadoop courses are earning big bucks! So, unlock your career with a big data Hadoop certification in Gurgaon. And follow DexLab Analytics for the latest big data related blogs and information.

References:

www.smartdatacollective.com/hospitality-industry-emergence-big-data

www.hiddenbrains.com/blog/big-data-analytics-driving-restaurant-industry-towards-profitable-growth.html

insidebigdata.com/2018/08/03/three-industries-profiting-big-data


Interested in a career in Data Analyst?

To learn more about Data Analyst with Advanced excel course – Enrol Now.
To learn more about Data Analyst with R Course – Enrol Now.
To learn more about Big Data Course – Enrol Now.

To learn more about Machine Learning Using Python and Spark – Enrol Now.
To learn more about Data Analyst with SAS Course – Enrol Now.
To learn more about Data Analyst with Apache Spark Course – Enrol Now.
To learn more about Data Analyst with Market Risk Analytics and Modelling Course – Enrol Now.

Tapping Into Big Data for Better Talent Acquisition

Tapping Into Big Data for Better Talent Acquisition

There are many variables that need to be considered while making hiring decisions. Most importantly, there’s need to fill skill gap. Other factors are candidate behavior and financial aspects of hiring, like cost for training new employees. Big data and analytics help form valuable insights into the job market. Consider the example of IBM acquiring the services of consulting firm Kenexa. It was used to access data of 40 million workers in order to find the personality trait most suitable for a sales job. All kinds of information starting from the workers’ job applications to managerial level was analyzed and it was determined that ’persistence’ is the most valued trait.

Here are some important ways big data helps firms attract promising candidates:

Automate HR Affairs

Talent Acquisition encompasses a wide variety of tasks and when HR teams work in tandem with AI then many day-to-day tasks gets simplified. It helps with tasks like filtering and tracking application status of candidates, getting new hires onboard and making future decisions about employees by analyzing data of previous employees. Data enabled systems saves a lot of time and makes tedious tasks much easier.

Predictive Analytics for Better Hiring Decisions

Hiring professionals need 360 degree information about a particular situation in order to make the best decision possible. They need to analyze everything starting from the human capital requirement in the organization to the economics. Big data enables them to form a clear idea about the skill gaps in the company’s workforce, analyze current trends in the market, follow the financial KPI’s and demographic traits associated with hiring, set the hiring quota and identify the skills and talents to look for in new hires.

Discard ‘’Eleventh Hour’’ Hiring Method

The urgency to fill skill gaps often pressurizes HR professionals to make quick hires, which can be impulsive and not the best. With the help of predictive analytics, these last minute situations can be completely avoided. It allows HR teams to form long-term hiring strategies that align with company goals and also enables them to make timely hires. Using the power of big data, you can be aware of the future needs of your company and job market trends. Hence, it helps eliminate panic situations where you make a hire only to realize later that he/she doesn’t fit the bill.

Social Media for Insights

Big data helps firms attract the right candidates that fit a role. The hard data available on the social media platforms of promising candidates and their search behavior online give organizations crucial information that help them make right decisions. Talent Bin is one of the many employment websites that use information from social media to form insights.

Targeted Job Ads

With the help of analytics, companies can create target groups and rope them in by showing relevant ads. For example, if there’s a financial service provider who enjoys a large talent network interested in marketing on LinkedIn, then they can take this opportunity to post marketing-specific job advertisements. Many potential candidates might find these posts engaging and the company will find the right fit for the job.

Wrapping up, we can say that big data has opened up fresh avenues to make better hires. The influence of big data in every aspect of the modern corporate sector is truly astounding. The smartest candidates are enrolling for big data courses to build skills that sell the most in today’s world of work. For expert-guided big data Hadoop training in Gurgaon, visit DexLab Analytics.


Reference: insidebigdata.com/2018/07/20/big-data-talent-acquisition-effective-synergy-make-better-hires


Interested in a career in Data Analyst?

To learn more about Data Analyst with Advanced excel course – Enrol Now.
To learn more about Data Analyst with R Course – Enrol Now.
To learn more about Big Data Course – Enrol Now.

To learn more about Machine Learning Using Python and Spark – Enrol Now.
To learn more about Data Analyst with SAS Course – Enrol Now.
To learn more about Data Analyst with Apache Spark Course – Enrol Now.
To learn more about Data Analyst with Market Risk Analytics and Modelling Course – Enrol Now.

Top 5 Up-And-Coming Big Data Trends for 2018

Top 5 Up-And-Coming Big Data Trends for 2018

The big data market is constantly growing and evolving. It is predicted that by 2020 there will be over 400,000 big data jobs in the US alone, but only around 300,000 skilled professionals in the field. The constant evolution of the big data industry makes it quite difficult to predict trends. However, below are some of the trends that are likely to take shape in 2018.

Open source frameworks:

Open source frameworks like Hadoop and Spark are dominating the big data realm for quite some time now and this trend will continue in 2018. The use of Hadoop is increasing by 32.9% every year- according to Forrester forecast reports. Experts say that 2018 will see an increase in the usage of Hadoop and Spark frameworks for better data processing by organizations. As per TDWI Best Practices report, 60% of enterprises aim to have Hadoop clusters functioning in production by end of 2018.

As Hadoop frameworks are becoming more popular, companies are looking for professionals skilled in Hadoop and similar techs so that they can draw valuable insights from real-time data. Owing to these reasons, more and more candidates interested to make a career in this field are going for big data Hadoop training.

Visualization Models:

A survey was conducted with 2800 BI experts in 2017 where they highlighted the importance of data discovery and data visualization. Data discovery isn’t just about understanding, analyzing and discovering patterns in the data, but also about presenting the analysis in a manner that easily conveys the core business insights. Humans find it simpler to process visual patterns. Hence, one of the significant trends of 2018 is development of compelling visualization models for processing big data.

2

Streaming success:

Every organization is looking to master streaming analytics- a process where data sets are analyzed while they are still in the path of creation. This removes the problem of having to replicate datasets and provides insights that are up-to-the-second. Some of the limitations of streaming analytics are restricted sizes of datasets and having to deal with delays. However, organizations are working to overcome these limitations by end of 2018.

Dark data challenge

Dark data refers to any kind of data that is yet to be utilized and mainly includes non-digital data recording formats such as paper files, historical records, etc. the volume of data that we generate everyday may be increasing, but most of these data records are in analog form or un-digitized form and aren’t exploited through analytics. However, 2018 will see this dark data enter cloud. Enterprises are coming up with big data solutions that enable the transfer of data from dark environments like mainframes into Hadoop.

Enhanced efficiency of AI and ML:

Artificial intelligence and machine learning technologies are rapidly developing and businesses are gaining from this growth through use cases like fraud detection, pattern recognition, real-time ads and voice recognition. In 2018, machine learning algorithms will go beyond traditional rule-based algorithms. They will become speedier and more precise and enterprises will use these to make more accurate predictions.

These are some of the top big data trends predicted by industry experts. However, owing to the constantly evolving nature of big data, we should brace ourselves for a few surprises too!

Big data is shoving the tech space towards a smarter future and an increasing number of organizations are making big data their top priority. Take advantage of this data-driven age and enroll for big data Hadoop courses in Gurgaon. At DexLab Analytics, industry-experts patiently teach students all the theoretical fundamentals and give them hands-on training. Their guidance ensures that students become aptly skilled to step into the world of work. Interested students can now avail flat 10% discount on big data courses by enrolling for DexLab’s new admission drive #BigDataIngestion.


Reference: https://www.analyticsinsight.net/emerging-big-data-trends-2018


Interested in a career in Data Analyst?

To learn more about Data Analyst with Advanced excel course – Enrol Now.
To learn more about Data Analyst with R Course – Enrol Now.
To learn more about Big Data Course – Enrol Now.

To learn more about Machine Learning Using Python and Spark – Enrol Now.
To learn more about Data Analyst with SAS Course – Enrol Now.
To learn more about Data Analyst with Apache Spark Course – Enrol Now.
To learn more about Data Analyst with Market Risk Analytics and Modelling Course – Enrol Now.

Step-by-step Guide for Implementation of Hierarchical Clustering in R

Step-by-step Guide for Implementation of Hierarchical Clustering in R

Hierarchical clustering is a method of clustering that is used for classifying groups in a dataset. It doesn’t require prior specification of the number of clusters that needs to be generated. This cluster analysis method involves a set of algorithms that build dendograms, which are tree-like structures used to demonstrate the arrangement of clusters created by hierarchical clustering.

It is important to find the optimal number of clusters for representing the data. If the number of clusters chosen is too large or too small, then the precision in partitioning the data into clusters is low.

NbClust

The R package NbClust has been developed to help with this. It offers good clustering schemes to the user and provides 30 indices for determining the number of clusters.

Through NbClust, any combination of validation indices and clustering methods can be requested in a single function call. This enables the user to simultaneously evaluate several clustering schemes while varying the number of clusters.

One such index used for getting optimum number of clusters is Hubert Index.

2

Performing Hierarchical Clustering in R

In this blog, we shall be performing hierarchical clustering using the dataset for milk. The flexclust package is used to extract this dataset.

The milk dataset contains observations and parameters as shown below:

As seen in the dataset, milk obtained from various animal sources and their respective proportions of water, protein, fat, lactose and ash have been mentioned.

For making calculations easier, we scale down original values into a standard normalized form. For that, we use processes like centering and scaling. The variable may be scaled in the following ways:

Subtract mean from each value (centering) and then divide it by standard deviation or divide it by its mean deviation about mean (scaling)

Divide each value in the variable by maximum value of the variable

After scaling the variables we get the following matrix

The next step is to calculate the Euclidean distance between different data points and store the result in a variable.

Hierarchical average linkage method is used for performing clustering of different animal sources. The formula used for that is shown below.

We obtain 25 clusters from the dataset.

To draw the dendogram we use the plot command and we obtain the figure given below.


The Nbclust library is used to get the optimum number of clusters for partitioning the data. The maximum and minimum number of clusters that is needed is stored in a variable. The nbClust method finds out the optimum number of clusters according to different clustering indices and finally the Hubert Index decides the optimum value of the number of clusters.

The optimum cluster value is 3, as can be seen in the figure below.

Values corresponding to knee jerk visuals in the graph give the number of clusters needed.

The graph shows that the maximum votes from various clustering indices went to cluster 3. Hence, the data is partitioned into 3 clusters.

The graph is partitioned into 3 clusters as shown by the red lines.

Now, the points are portioned into 3 clusters as opposed to the 25 clusters we got initially.

Next, the clusters are assigned to the observations.

The clusters are assigned different colors for ease of visualization


That brings us to a close on the topic of Hierarchical clustering. In the upcoming blogs, we shall be discussing K-Means clustering. So, follow DexLab Analytics – a leading institute providing big data Hadoop training in Gurgaon. Enroll for their big data Hadoop courses and avail flat 10% discount. To more about this #SummerSpecial offer, visit our website.


Interested in a career in Data Analyst?

To learn more about Data Analyst with Advanced excel course – Enrol Now.
To learn more about Data Analyst with R Course – Enrol Now.
To learn more about Big Data Course – Enrol Now.

To learn more about Machine Learning Using Python and Spark – Enrol Now.
To learn more about Data Analyst with SAS Course – Enrol Now.
To learn more about Data Analyst with Apache Spark Course – Enrol Now.
To learn more about Data Analyst with Market Risk Analytics and Modelling Course – Enrol Now.

Study: Demand for Data Scientists is Sky-Rocketing; India Leads the Show

Study: Demand for Data Scientists is Sky-Rocketing; India Leads the Show

Last year, India witnessed a surging demand for data scientists by more than 400% – as medium to large-scale companies are increasingly putting their faith on data science capabilities to build and develop next generation products that will be well integrated, highly personalized and extremely dynamic.

Companies in the Limelight

At the same time, India contributed to almost 10% of open job openings for data scientists worldwide, making India the next data science hub after the US. This striking revelation comes at a time when Indian IT sector job creation has hit a slow mode, thus flourishing data science job creation is found providing a silver lining. According to the report, Microsoft, JPMorgan, Deloitte, Accenture, EY, Flipkart, Adobe, AIG, Wipro and Vodafone are some of the top of the line companies which hired the highest number of data scientists this year. Besides data scientists, they also advertised openings for analytics managers, analytics consultants and data analysts among others.

City Stats

After blue chip companies, talking about Indian cities which accounts for the most number of data scientists – we found that Bengaluru leads the show with highest number of data analytics and science related jobs accounting for almost 27% of the total share. In fact, the statistics has further increased from the last year’s 25%, followed by Delhi NCR and Mumbai. Even, owing to an increase in the number of start-ups, 14% of job openings were posted from Tier-II cities.

Notable Sectors

A large chunk of data science jobs originated from the banking and financial sector – 41% of job generation was from banking sector. Other industries that followed the suit are Energy & Utilities and Pharmaceutical and Healthcare; both of which have observed significant increase in job creation over the last year.

Get hands on training on data science from DexLab Analytics, the promising big data hadoop institute in Delhi.

2

Talent Supply Index (TSI) – Insights

Another study – Talent Supply Index (TSI) by Belong suggested that the demand in jobs is a result of data science being employed in some areas or the other across industries with burgeoning online presence, evident in the form of targeted advertising, product recommendation and demand forecasts. Interestingly, businesses sit on a massive pile of information collected over years in forms of partners, customers and internal data. Analyzing such massive volumes of data is the key.

Shedding further light on the matter, Rishabh Kaul, Co-Founder, Belong shared, “If the TSI 2017 data proved that we are in a candidate-driven market, the 2018 numbers should be a wakeup call for talent acquisition to adopt data-driven and a candidate-first approach to attract the best talent. If digital transformation is forcing businesses to adapt and innovate, it’s imperative for talent acquisition to reinvent itself too.”

Significantly, skill-based recruitment is garnering a lot of attention of the recruiters, instead of technology and tool-based training. The demand for Python skill is the highest scoring 39% of all posted data science and analytical jobs. In the second position is R skill with 25%.

Last Notes

The analytics job landscape in India is changing drastically. Companies are constantly seeking worthy candidates who are well-versed in particular fields of study, such as data science, big data, artificial intelligence, predictive analytics and machine learning. In this regard, this year, DexLab Analytics launches its ultimate admission drive for prospective students – #BigDataIngestion. Get amazing discounts on Big Data Hadoop training in Gurgaon and promote an intensive data culture among the student fraternity.

For more information – go to their official website now.


Interested in a career in Data Analyst?

To learn more about Data Analyst with Advanced excel course – Enrol Now.
To learn more about Data Analyst with R Course – Enrol Now.
To learn more about Big Data Course – Enrol Now.

To learn more about Machine Learning Using Python and Spark – Enrol Now.
To learn more about Data Analyst with SAS Course – Enrol Now.
To learn more about Data Analyst with Apache Spark Course – Enrol Now.
To learn more about Data Analyst with Market Risk Analytics and Modelling Course – Enrol Now.

Analytics of Things is Transforming the Way Businesses Run

Analytics of Things is Transforming the Way Businesses Run

As Internet of Things (IoT) invades every aspect of our lives, big data analytics is likely to be utilized for many more things other than solving business problems. This growing popularity of big data analytics, which is altering the way businesses run, has given birth to a new term- ‘ Analytics of Things’.

Much before big data was identified as the most valuable asset for businesses, enterprises had expressed need for a system that could handle an ‘information explosion’. In 2006, an open source distributed storage and processing system was developed. This system called Hadoop spread across commodity hardware and encouraged the nurturing of many more open source projects that would target different aspects of data and analytics.

Growth of Hadoop:

The primary objective with which Hadoop was developed was storing large volumes of data in a cost effective manner. Enterprises were clueless how to handle their ever increasing volumes of data. So, the first requirement was to dump all that data in a data lake and figure out the use cases gradually. Initially, there used to be a standard set of open source tools for managing data and the data architecture lacked variety.

Prior to adopting big data, companies managed their reporting systems through data warehouses and different types of data management tools. The telecom and banking industry were among the first to step into big data. Over time, some of them completely shifted their reporting work to Hadoop.

2

Evolution of big data architecture:

Big data tools have witnessed drastic evolution. This encouraged enterprises to employ a new range of use cases on big data using the power of real-time processing hubs. This includes fraud detection, supply chain optimization and digital marketing automation among other things. Since Hadoop’s birth in 2006, big data has developed a lot. Some of these developments include intelligent automation and real-time analytics.

To keep up with the demands for better big data architecture, real-time analytics was incorporated in Hadoop and its speed was also improved. Different cloud vendors developed Platform as a Service (PaaS) component and this development was a strong driving force behind big data architectures becoming more diverse.

As companies further explored ways to extract more meaning from their data, it led to the emergence of two major trends: Analytics as a service (AaaS) and data monetization.

AaaS platforms provided a lot of domain experience and hence gave generic PaaS platforms a lot more context. This development made big data architecture more compact.

Another important development came with data monetization. Some sectors, like healthcare and governance, depend heavily on data collected through a range of remote IoT devices. To make these processes speedier and reduce network load, localized processing was needed and this led to the emergence of ‘edge analytics’. Now, there is good sync between edge and centralized platforms, which in turn enhances the processes of data exchange and analysis.

The above mentioned developments show how much big data has evolved and that currently a high level of fine-tuning is possible in its architecture.

Often enterprises struggle with successful implementation of big data. The first step is to define your big data strategy. Instead of going for full blown implementation, undertake shorter implementation cycles.

It is highly likely that our future will become completely driven by big data and ground-breaking innovations like automated analysts and intelligent chatbots. Don’t be left behind. Enroll for big data Hadoop certification courses and take full advantage of the power big data holds in today’s world of work. The big data Hadoop training in Gurgaon ensures that every student becomes proficient enough to face real challenges in the industry. Enroll now and get flat 10% discount on all big data certification courses.


Reference: www.livemint.com/AI/bRwVnGBm6hH78SoUIccomL/Big-Data-Analytics-of-Things-upend-the-way-biz-gets-done.html


Interested in a career in Data Analyst?

To learn more about Data Analyst with Advanced excel course – Enrol Now.
To learn more about Data Analyst with R Course – Enrol Now.
To learn more about Big Data Course – Enrol Now.

To learn more about Machine Learning Using Python and Spark – Enrol Now.
To learn more about Data Analyst with SAS Course – Enrol Now.
To learn more about Data Analyst with Apache Spark Course – Enrol Now.
To learn more about Data Analyst with Market Risk Analytics and Modelling Course – Enrol Now.

Call us to know more