Big Data institute in noida Archives - DexLab Analytics | Big Data Hadoop SAS R Analytics Predictive Modeling & Excel VBA

Get Introduced to Big Data Analytic Techniques and Fly High

Big data is the big word, NOW. Data sets are becoming more and more large and complex, making it extremely troublesome to coordinate activities using on-hand database management tools.
Get-Introduced-to-Big-Data-Analytic-Techniques-and-Fly-High
The flourishing growth in IT industry has triggered numerous complimentary conditions. One of the conditions is the emergence of Big Data. This two-word seven-letter catch phrase deals with a humongous amount of data, which is of prime importance in the eyes of the company in question. And the resultant effect leads to another branch of science, which is Data Analytics.

What is A/B Testing?

A/B Testing is a powerful assessment tool to determine which version of an app or a webpage helps an individual or his business meet future goals effectively and positively. The decision is not abrupt; it is taken after carefully comparing various versions to reveal out the best of the lot.

Also read: Big Data Analytics and its Impact on Manufacturing Sector

A/B Testing forms an integral part in web development and big data industry. It ensures that the alterations happening on a webpage or any page component are data-driven and not opinion-based.

What do you mean by Association Rule Learning

This comprises of a set of techniques to find out interesting relationships, i.e. ‘association rules’ amidst variables in massive databases. The methods include an assortment of algorithms to initiate and test possible rules.

Also read: What Sets Apart Data Science from Big Data and Data Analytics

The following flowchart, a market basket analysis is being focused. Here, a retailer ascertains which products are high in demand and eventually use this data for successful marketing.

How to understand Classification Tree Analysis?

Statistical Classification is implemented to:

  • Classify organisms into groups
  • Automatically allocate documents to categories
  • Create profiles of students who enrol for online courses
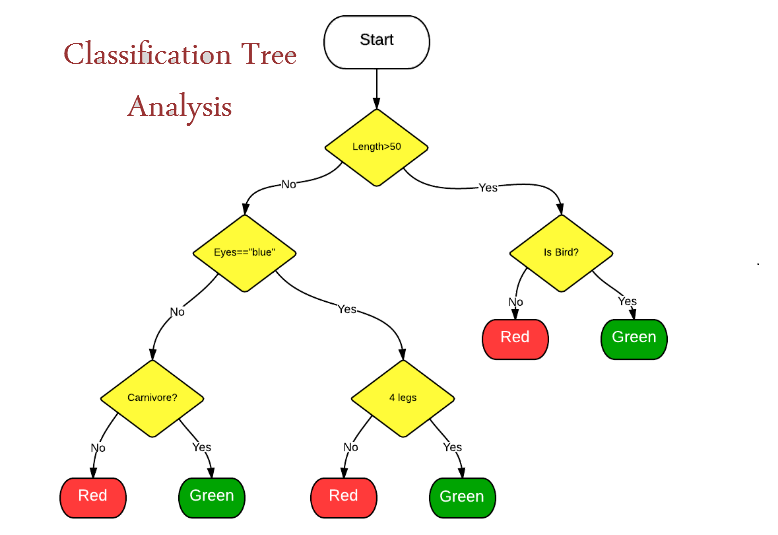
It is a method of recognizing categories, in which the new observation falls into. It needs a training set of appropriately identified observations, aka historical data.

Why should you take a sneak peek into the world of Data Fusion and Data Integration?

Well, this is a complex multi-level process involving correlation, association, combination of information and data from one and many sources, to attain a superior position, determine estimates and finish timely assessments of projects. By combining data from multiple sensors, data integration and fusion helps in improving overall accuracy and direct more specific inferences, which would have otherwise been impossible from a single sensor alone. 

Also read: How To Stop Big Data Projects From Failing?

Let’s talk about Data Mining

Identify patterns and strike relationships, with Data Mining. It is nothing but the collective data extraction techniques to be performed on a large chunk of data. Some of the common data mining parameters are Association, Classification, Clustering, Sequence Analysis and Forecasting.

Generally, applications involve mining customer data to deduce segments and understand market basket analyses. It helps understanding the purchase behaviour of customers.
Neural Networks – Resembling biological neural networks

Non-linear predictive models are mostly used for pattern recognition and optimization. Some of the applications ask for supervised learning, whereas some invites unsupervised learning.

To know more about Big Data certification, why don’t you check our extensive Machine Learning Certification courses in Gurgaon! We, at DexLab Analytics have all sorts of courses suiting your professional work skill.


Interested in a career in Data Analyst?

To learn more about Machine Learning Using Python and Spark – click here.
To learn more about Data Analyst with Advanced excel course – click here.
To learn more about Data Analyst with SAS Course – click here.
To learn more about Data Analyst with R Course – click here.
To learn more about Big Data Course – click here.
The Best Analytics Tools for Business And How to Make The Most of Them

The Best Analytics Tools for Business And How to Make The Most of Them

All companies are awash with useable data about their customers, prospects and internal business operations as well as suppliers and partners. But most of them are also ill-equipped with the requisite understanding to leverage this streaming flood of data and cannot convert it to actionable insights to increase their revenue by growing their revenue thus, increasing their efficiency. Business intelligence tools are technology that allows businesses to transform their data into actions for generating better business.

The Business Intelligence and analytics industry has been around for decades now and is considered by most analytics personnel as a mature industry. But this BI market is never static with constant evolution and innovation to prepare for meeting the ever expanding needs of businesses of all sizes and from a diverse range of industries. So, it is imperative that people gather an understanding of the different Business Analytics tools for better operation of their companies.

2

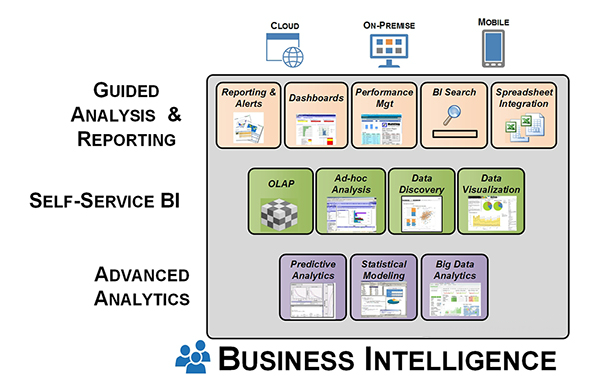
Business Intelligence tools can be categorised in three different groups:

  • Guided analysis and reporting
  • Self-service Business Intelligence and Analysis
  • Advanced Analytics

The first category of guided analysis and reporting includes Business Intelligence tools of traditional styles that have long been used for years to perform recurrent data analyses of specified data groups. This system of data analysis was only used for predefined static reporting several years ago, but today it is possible for data analysts to select, compare, visualize and analyse data using various tools and features.

Tool styles in this category include the following:

  • Reports
  • Scorecards and dashboards
  • Spreadsheet integration
  • BI Search
  • Corporate Performance Management

The second category of BI tools which falls under the category of self-service BI and analysis includes the tools BI users utilize to make ad hoc analysis of data. Such analytical practices may be a one-time analysis or building of a recurring analytical system that may with shared by others.

Usually the users of such Bi tools have a dual role to play – consumer of information and producer of analytical systems. They usually share or publish their BI application which they build with the self-service BI tool. The users of such tools will always have the term analyst in their job title. Staff members of the management department may also make use of such tools when they need to perform similar tasks as that of a business analyst, for their peers even if their job title does not imply that.

The Business Intelligence tools include in this category includes the following:

  • Ad hoc analyses and reporting
  • OLAP cubes i.e. online analytical processing
  • Data visualization
  • Data discovery

The third category of advanced analytics includes the tools that a data scientist uses to build predictive and prescriptive models of analysis. These are tools for predictive modelling, statistical modelling and data mining along with rigorous use of big data analytics software. In these cases data analyst spend a huge chunk of their time performing tasks like data ingestion, cleansing and integration.

To understand the full spectrum of different Business Intelligence tool classes here is a visual explanation:

dexlab

Who should invest in BI tools?

For a long time now investment and use of BI tools has been growing gradually regardless of the economic conditions. And it has especially accelerated in the recent times as companies crave for data for better growth and more organized operations. While data analytics tools were mainly associated with large enterprises due to their cost, complexity and demand of high skilled personnel, but those factors have now been grossly transformed as more and more SMBs (small and medium sized businesses) now being significant customers of BI tools and software.

Now that you have a good understanding of the different tool categories and how they should be deployed, the next step for you is to understand your  company specific needs and make the best use of these tools that are optimized for so.


Interested in a career in Data Analyst?

To learn more about Data Analyst with Advanced excel course – Enrol Now.
To learn more about Data Analyst with R Course – Enrol Now.
To learn more about Big Data Course – Enrol Now.

To learn more about Machine Learning Using Python and Spark – Enrol Now.
To learn more about Data Analyst with SAS Course – Enrol Now.
To learn more about Data Analyst with Apache Spark Course – Enrol Now.
To learn more about Data Analyst with Market Risk Analytics and Modelling Course – Enrol Now.

Call us to know more