Big Data Hadoop courses Archives - Page 3 of 10 - DexLab Analytics | Big Data Hadoop SAS R Analytics Predictive Modeling & Excel VBA

For a Seamless, Real-Time Integration and Access across Multiple Data Siloes, Big Data Fabric Is the Solution

For a Seamless, Real-Time Integration and Access across Multiple Data Siloes, Big Data Fabric Is the Solution

Grappling with diverse data?

No worries, data fabrics for big data is right here.

The very notion of a fabric joining computing resources and offering centralized access to a set of networks has been doing rounds since the conceptualization of grid computing as early as 1990s. However, a data fabric is a relatively new concept based on the same underlying principle, but it’s associated with data instead of a system.

As data have become increasingly diversified, the importance of data fabrics too spiked up. Now, integrating such vast pools of data is quite a problem, as data collected across various channels and operations is often withhold in discrete silos. The responsibility lies within the enterprise to bring together transactional data stores, data lakes, warehouses, unstructured data sources, social media storage, machine logs, application storage and cloud storage for management and control.  

The Change That Big Data Brings In

The escalating use of unstructured data resulted in significant issues with proper data management. While the accuracy and usability quotient remained more or less the same, the ability to control them has been reduced because of increasing velocity, variety, volume and access requirements of data. To counter the pressing challenge, companies have come with a number of solutions but the need for a centralized data access system prevails – on top of that big data adds concerns regarding data discovery and security that needs to be addressed only through a particular single access mechanism.

To taste success with big data, the enterprises need to seek access to data from a plethora of systems in real time in perfectly digestible formats – also connecting devices, including smartphones and tablets enhances storage related issues. Today, big data storage is abundantly available in Apache Spark, Hadoop and NoSQL databases that are developed with exclusive management demands.

2

The Popularity of Data Fabrics

Huge data and analytics vendors are the biggest providers of big data fabric solutions. They help offer access to all kinds of data and conjoin them into a single consolidated system. This consolidated system – big data fabric – should tackle diverse data stores, nab security issues, offer consistent management through unified APIs and software access, provide auditability, flexibility and be upgradeable and process smooth data ingestion, curation and integration.

With the rise of machine learning and artificial intelligence, the requirements of data stores increase as they form the fundamentals of model training and operations. Therefore, enterprises are always seeking a single platform and a single point for data access, they tend to reduce the intricacies of the system and ensure easy storage of data. Not only that, data scientists no longer need to focus on the complexities of data access, rather they can give their entire attention to problem-solving and decision-making.

To better understand how data fabrics provide a single platform and a single point for data access across myriad siloed systems, you need a top of the line big data certification today. Visit DexLab Analytics for recognized and well-curated big data hadoop courses in Gurgaon.

DexLab Analytics Presents #BigDataIngestion

DexLab Analytics Presents #BigDataIngestion

 
Referenes: https://tdwi.org/articles/2018/06/20/ta-all-data-fabrics-for-big-data.aspx
 

Interested in a career in Data Analyst?

To learn more about Data Analyst with Advanced excel course – Enrol Now.
To learn more about Data Analyst with R Course – Enrol Now.
To learn more about Big Data Course – Enrol Now.

To learn more about Machine Learning Using Python and Spark – Enrol Now.
To learn more about Data Analyst with SAS Course – Enrol Now.
To learn more about Data Analyst with Apache Spark Course – Enrol Now.
To learn more about Data Analyst with Market Risk Analytics and Modelling Course – Enrol Now.

Hierarchical Clustering: Foundational Concepts and Example of Agglomerative Clustering

Hierarchical Clustering: Foundational Concepts and Example of Agglomerative Clustering

Clustering is the process of organizing objects into groups called clusters. The members of a cluster are ‘’similar’’ between them and ‘’dissimilar’’ to members of other groups.

In the previous blog, we have discussed basic concepts of clustering and given an overview of the various methods of clustering. In this blog, we will take up Hierarchical Clustering in greater details.

Hierarchical Clustering:

Hierarchical Clustering is a method of cluster analysis that develops a hierarchy (ladder) of clusters. The two main techniques used for hierarchical clustering are Agglomerative and Divisive.

Agglomerative Clustering:

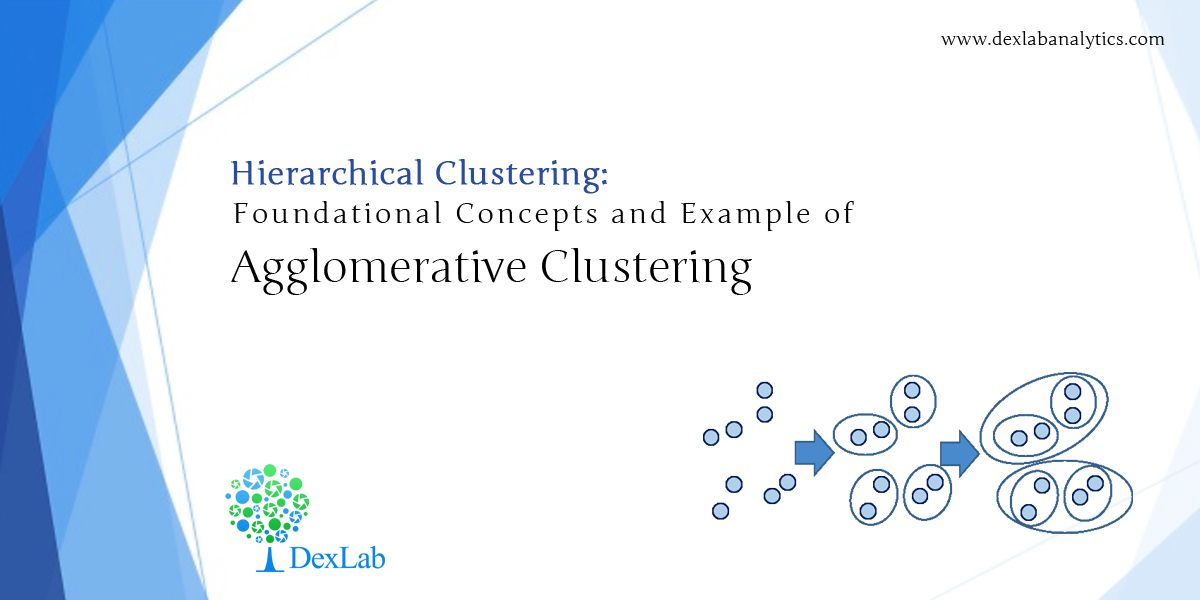
In the beginning of the analysis, each data point is treated as a singleton cluster. Then, clusters are combined until all points have been merged into a single remaining cluster. This method of clustering wherein a ‘’bottom up’’ approach is followed and clusters are merged as one moves up the hierarchy is called Agglomerative clustering.

Linkage types:

The clustering is done with the help of linkage types. A particular linkage type is used to get the distance between points and then assign it to various clusters. There are three linkage types used in Hierarchical clustering- single linkage, complete linkage and average linkage.

Single linkage hierarchical clustering: In this linkage type, two clusters whose two closest members have the shortest distance (or two clusters with the smallest minimum pairwise distance) are merged in each step.

Complete linkage hierarchical clustering: In this type, two clusters whose merger has the smallest diameter (two clusters having the smallest maximum pairwise distance) are merged in each step.

Average linkage hierarchical clustering: In this type, two clusters whose merger has the smallest average distance between data points (or two clusters with the smallest average pairwise distance), are merged in each step.

Single linkage looks at the minimum distance between points, complete linkage looks at the maximum distance between points while average linkage looks at the average distance between points.

Now, let’s look at an example of Agglomerative clustering.

The first step in clustering is computing the distance between every pair of data points that we want to cluster. So, we form a distance matrix. It should be noted that a distance matrix is symmetrical (distance between x and y is the same as the distance between y and x) and has zeros in its diagonal (every point is at a distance zero from itself). The table below shows a distance matrix- only lower triangle is shown an as the upper one can be filled with reflection.

Next, we begin clustering. The smallest distance is between 3 and 5 and they get merged first into the cluster ‘35’.

After this, we replace the entries 3 and 5 by ‘35’ and form a new distance matrix. Here, we are employing complete linkage clustering. The distance between ‘35’ and a data point is the maximum of the distance between the specific data point and 3 or the specific data point and 5. This is followed for every data point. For example, D(1,3)=3 and D(1,5) =11, so as per complete linkage clustering rules we take D(1,’35’)=11. The new distance matrix is shown below.

Again, the items with the smallest distance get clustered. This will be 2 and 4. Following this process for 6 steps, everything gets clustered. This has been summarized in the diagram below. In this plot, y axis represents the distance between data points at the time of clustering and this is known as cluster height.

Complete Linkage

If single linkage clustering was used for the same distance matrix, then we would get a single linkage dendogram as shown below. Here, we start with cluster ‘35’. But the distance between ‘35’ and each data point is the minimum of D(x,3) and D(x,5). Therefore, D(1,’35’)=3.

Single Linkage

Agglomerative hierarchical clustering finds many applications in marketing. It is used to group customers together on the basis of product preference and liking. It effectively determines variations in consumer preferences and helps improving marketing strategies.

In the next blog, we will explain Divisive clustering and other important methods of clustering, like Ward’s Method. So, stay tuned and follow Dexlab Analytics. We are a leading big data Hadoop training institute in Gurgaon. Enroll for our expert-guided certification courses on big data Hadoop and avail flat 10% discount!

DexLab Analytics Presents #BigDataIngestion

DexLab Analytics Presents #BigDataIngestion


Check back for the blog A Comprehensive Guide on Clustering and Its Different Methods


Interested in a career in Data Analyst?

To learn more about Data Analyst with Advanced excel course – Enrol Now.
To learn more about Data Analyst with R Course – Enrol Now.
To learn more about Big Data Course – Enrol Now.

To learn more about Machine Learning Using Python and Spark – Enrol Now.
To learn more about Data Analyst with SAS Course – Enrol Now.
To learn more about Data Analyst with Apache Spark Course – Enrol Now.
To learn more about Data Analyst with Market Risk Analytics and Modelling Course – Enrol Now.
Fintech Companies: How They Are Revolutionizing the Banking Industry?

Fintech Companies: How They Are Revolutionizing the Banking Industry?

The world of technology is expanding rapidly. And so is the finance. Fintech is the new buzzword; and its extensive use of cutting edge algorithms, big data solutions and AI is transforming the traditional banking sector.

Nevertheless, there exist many obstacles, which fintech companies need to deal with before creating an entirely complementary system that covers the gap between both.

Ezbob and LaaS

Innovation takes time to settle, but with little effort, banks can strike gold than ever. New transparency laws and digital standards are being introduced and if banks are quicker in embracing this new technology, they can ring off success very easily. Not every fintech is determined to cause discomfort to banks, in fact a lot of fintech startups offer incredible services to attract new customers.

One of them is ezbob, a robust platform in partnership with multiple major banking institutions that streamlines an old process with cutting edge technology. This platform develops a smooth, automatic lending process for bank’s customers by sorting data accumulated from more than 25 sources in real time. Currently, it’s leading Lending-as-a-Service (LaaS) industry, which is deemed to be the future of banking sector.

LaaS is one of the key transforming agents that have brought in a new trend in the banking sector. It reflects how everyone can benefit, including customers and partners, when efficiency is improved. Real time decisions are crucial; it helps bankers turn attention to the bigger picture, while technology takes care of other factors.

2

The Art of Regulations

Conversely, fintech startups should be wary of regulations. Notwithstanding the fact that technology is fast decentralizing the whole framework and disrupting institutional banking sector, fintech companies should focus on regulation and be patient with all the innovations taking place around. Banks need time to accept the potentials of fintech’s innovation but once they do, they would gain much more from adopting these technologies.

The aftermath of 2008 financial crisis have made it relatively easier for fintech startups to remain compliant and be more accountable. One of the latest regulations passed is about e-invoicing, which require organizations should send digital invoices through a common system. This measure is expected to save billions of dollars on account of businesses and governments, as well.

Some of the other reforms that have been passed recently are mainly PSD2, which has systematized mobile and internet payments, and AMLD, which is an abbreviation of Anti Money Laundering Directive. The later hurts those who don’t want to be accountable for their income, or involved in terrorism activities.

Conclusion

As closing thoughts, we all can see the financial sector has been the largest consumers of big data technology. According to Gartner, 64% of financial service companies have used big data in 2013. And the figures are still rising.

To be the unicorn among the horses, it’s high time to imbibe big data hadoop skills. This new-age skill is going to take you a long way, provided you get certified from a reputable institute. In Delhi-Gurgaon region, we’ve DexLab Analytics. It offers state-of-the-art hadoop training in Gurgaon. For more information, drop by their site now.

DexLab Analytics Presents #BigDataIngestion

A Special Alert: DexLab Analytics is offering #SummerSpecial 10% off on in-demand courses of big data hadoop, data science, machine learning and business analytics. Enroll now for #BigDataIngstion: the new on-going admission drive!

 
The blog has been sourced from – http://dataconomy.com/2017/10/rise-fintechpreneur-matters
 

Interested in a career in Data Analyst?

To learn more about Data Analyst with Advanced excel course – Enrol Now.
To learn more about Data Analyst with R Course – Enrol Now.
To learn more about Big Data Course – Enrol Now.

To learn more about Machine Learning Using Python and Spark – Enrol Now.
To learn more about Data Analyst with SAS Course – Enrol Now.
To learn more about Data Analyst with Apache Spark Course – Enrol Now.
To learn more about Data Analyst with Market Risk Analytics and Modelling Course – Enrol Now.

Secrets behind the Success of AI Implanted Analytics Processes

Secrets behind the Success of AI Implanted Analytics Processes

Big data combined with machine learning results in a powerful tool. Businesses are using this combination more and more, with many believing that the age of AI has already begun. Machine learning embedded in analytics processes opens new gateways to success, but companies must be careful about how they use this power. Organizations use this powerful platform in various domains, such as fraud detection, boosting cybersecurity and carrying out personalized marketing campaigns.

Machine learning isn’t a technology that simply speeds up the process of solving existing problems, it holds the potential to provide solutions that weren’t even thought of before; boost innovation and identify problem areas that went unnoticed.  To utilize this potent tech the best possible way, companies need to be aware of AI’s strengths as well as limitations. Businesses need to adopt renewed ways of harnessing the power of AI and analytics. Here are the top 4 ways to make the most out of AI and big data.

Context is the key:

Sifting through available information, machine learning can provide insights that are compelling and trustworthy. But, it lacks the ability to judge which results are valuable. For example, taking up a query from a garment store owner, it will provide suggestions based on previous sales and demographic information. However, the store owner might see that some of these suggestions are redundant or impractical. Moreover, humans need to program AI so that it takes into account variables and selects relevant data sets to analyze. Hence, context is the key. Business owners need to present the proper context, based on which AI will provide recommendations.

Broaden your realm of queries:

Machine learning can offer a perfect answer to your query. But, it can do much more. It might stun you by providing appropriate solutions to queries you didn’t even ask. For example, if you are trying to convince a customer to take a particular loan, then machine learning can crunch huge data sets and provide a solution. But is drawing more loans your real goal? Or is the bigger goal increasing revenues? If this is your actual goal, then AI might provide amazing solutions, like opening a new branch, which you probably didn’t even think about. In order to elicit such responses, you must broaden the realm of queries so that it covers different responses.

Have faith in the process:

AI can often figure things out that it wasn’t trained to understand and we might never comprehend how that happened. This is one of the wonders of AI. For example, Google’s neural network was shown YouTube videos for a few days and it learnt to identify cats, something it wasn’t taught.

Such unprecedented outcomes might be welcome for Google, but most businesses want to trust AI, and for that they seek to know how techs arrive at solutions. The insights provided by machine learning are amazing but businesses can act on them only if they trust the tech. It takes time to trust machines, just like it is with humans. In the beginning we might feel the need to verify outputs, but as the algorithms give good results repeatedly, trust comes naturally.

2

Act sensibly:

Machine learning is a powerful tool that can backfire too. An example of that is the recent misuse of Facebook’s data by Cambridge Analytica, which couldn’t be explained by Facebook authorities too. Companies need to be aware of the consequences of using such an advanced technology. They need to be mindful of how employees use results generated by analytics tools and how third parties handle data that has been shared. All employees don’t need to know that AI is used for inner business processes.

Artificial Intelligence can fuel growth and efficiency for companies, but it takes people to make the best use of it. And how can you take advantage of this data-dominated business world? Enroll for big data Hadoop certification in Gurgaon. As DexLab Analytic’s #BigDataIngestion campaign is ongoing, interested students can enjoy flat 10% discount on big data Hadoop training and data science certifications.

Enjoy 10% Discount, As DexLab Analytics Launches #BigDataIngestion
DexLab Analytics Presents #BigDataIngestion

References: https://www.infoworld.com/article/3272886/artificial-intelligence/big-data-ai-context-trust-and-other-key-secrets-to-success.html


Interested in a career in Data Analyst?

To learn more about Data Analyst with Advanced excel course – Enrol Now.
To learn more about Data Analyst with R Course – Enrol Now.
To learn more about Big Data Course – Enrol Now.

To learn more about Machine Learning Using Python and Spark – Enrol Now.
To learn more about Data Analyst with SAS Course – Enrol Now.
To learn more about Data Analyst with Apache Spark Course – Enrol Now.
To learn more about Data Analyst with Market Risk Analytics and Modelling Course – Enrol Now.

7-Step Framework to Ensure Big Data Quality

7-Step Framework to Ensure Big Data Quality

Ensuring data quality is of paramount importance in today’s data-driven business world because poor quality can render all kinds of data completely useless. Moreover, this data is unreliable and lead to faulty business strategies if analyzed. Data quality is the key to making trustworthy business decisions.

Companies lacking correct data-quality framework are likely to encounter a crisis situation. According to certain reports, big companies are incurring losses of around $9 million/year due to poor data quality. Back in 2013, US Postal Service spent around $1.5 billion in processing mails that were undelivered due to bad data quality.

2

While the sources of poor quality data can be many, including data entry, data processing and stale data, data in motion is the most vulnerable. The moment data enters the systems of an organization it starts to move. There’s a lot of uncertainty about how to monitor moving data, and the existing processes are fragmented and ad-hoc. Data environments are becoming more and more complex, and the volume, variety and speed of big data can be quite overwhelming.

Here, we have listed some essential steps to ensure that your data is consistently of good quality.

  • Discover: Systems carrying critical information need to be identified first. For this, source and target system owners must jointly work to discover existing data issues, set quality standards and fix measurement metrics. So, this step ensures that the company has established yardsticks against which data quality of various systems will be measured. However, this isn’t a onetime process, rather it a continuous process that needs to evolve with time.
  • Define: it is crucial to clearly define the pain points and potential risks associated with poor data quality. Often, some of these definitions might be relevant to only one particular organization, whereas many times these are associated with regulations of the industry/sector the company belongs to.
  • Assessment: Existing data needs to be assessed against different dimensions, such as accuracy, completeness and consistency of key attributes; timeliness of data, etc. Depending upon the data, qualitative or quantitative assessment might be performed. Existing data policies and their adherence to industry guidelines need to be reviewed.
  • Measurement Scale: It is important to develop a data measurement scale that can assign numerical values to different attributes. It is better to express definitions using arithmetic values, such as percentages. For example: Instead of categorizing data as good data and bad data, it can be classified as- acceptable data has >95% accuracy.
  • Design: Robust management processes need to be designed to address risks identified in the previous steps. The data-quality analysis rules need to apply to all the processes. This is especially important for large data sets, where entire data sets need to be analyzed instead of samples, and in such cases the designed solutions must run on Hadoop.
  • Deploy: Set up appropriate controls, with priority given to the most risky data systems. People executing the controls are as important as the technologies behind them.
  • Monitor: Once the controls are set up, data quality standards determined in ‘discovery’ phase need to be monitored closely. An automated system is the best for continuous monitoring as it saves both time and money.

Thus, achieving high-quality data requires an all-inclusive platform that continuously monitors data and flags and stops bad data before they can harm business processes. Hadoop is the popular choice for data quality management across the entire enterprise.

Enjoy 10% Discount, As DexLab Analytics Launches #BigDataIngestion
DexLab Analytics Presents #BigDataIngestion


If you are looking for big data Hadoop certification in Gurgaon, visit Dexlab Analytics. We are offering flat 10% discount on our big data Hadoop training courses in Gurgaon. Interested students all over India must visit our website for more details. Our professional guidance will prove highly beneficial for all those wanting to build a career in the field of big data analytics.


Interested in a career in Data Analyst?

To learn more about Data Analyst with Advanced excel course – Enrol Now.
To learn more about Data Analyst with R Course – Enrol Now.
To learn more about Big Data Course – Enrol Now.

To learn more about Machine Learning Using Python and Spark – Enrol Now.
To learn more about Data Analyst with SAS Course – Enrol Now.
To learn more about Data Analyst with Apache Spark Course – Enrol Now.
To learn more about Data Analyst with Market Risk Analytics and Modelling Course – Enrol Now.

How Big Data Is Influencing HR Analytics for Employees and Employers, Both

How Big Data Is Influencing HR Analytics for Employees and Employers, Both

HR analytics powered by big data is aiding talent management and hiring decisions. A Deloitte 2015 report says 35% of companies surveyed revealed that they were actively developing suave data analytics strategies for HR. Moreover, big data analytics isn’t leaving us anytime soon; it’s here to stay for good.

Now, with that coming, employers are of course in an inapt position: whether to use HR analytics or not? And even if they do use the data, how are they going to do that without violating any HR policies/laws or upsetting the employees?

2

Health Data

While most of the employers are concerned about healthcare and wellness programs for their employees, a whole lot of other employees have started employing HR analytics for evaluation of the program’s effectiveness and addressing the gaps in healthcare coverage with an aim to improve overall program performance.

Today, data is the lifeblood of IT services. Adequate pools of employee data in conjunction with company data are aiding discoveries of the best benefit package for employees where they get best but affordable care. However, in the process, the employers need to be very careful and sensitive to employee privacy at the same time. During data analysis, the process should appear as if the entire organization is involved in it, instead of focusing on a single employee or sub-groups.

Predictive Performance Analytics

For talent management, HR analytics is a saving grace. Especially, owing to its predictive performance. Because of that, more and more employers are deploying this powerful skill to determine future hiring needs and structure a strong powerhouse of talent.

Rightfully so, predictive performance analytics use internal employee data to calculate potential employee turnover, but unfortunately, in some absurd cases, the same data can also be used to influence decisions regarding firing and promotion – and that becomes a problem.

Cutting edge machine learning algorithms dictate whether an event is going to happen or not, instead of what employees are doing or saying. Though it comes with its own advantages, its better when people frame decisions based on data. Because, people are unpredictable and so are the influencing factors.

Burn away irrelevant information

Sometimes, it may happen that employers instead of focusing on the meaningful things end up scrutinizing all the wrong things. For example, HR analytics show that employees living close to the office, geographically, are less likely to leave the office premise early. But, based on this, can we pass off top talent just because they reside a little farther from the office? We can’t, right?!

Hence, the bottom line is, whenever it comes to analyzing data, analysts should always look for the bigger picture rather giving stress on minute features – such as which employee is taking more number of leaves, and so on. Stay ahead of the curve by making the most productive decisions for employees as well as business, as a whole.

In the end, the power of data matters. HR analytics help guide the best decisions, but it’s us who are going to make them. We shouldn’t forget that. Use big data analytics responsibly to prevent any kind of mistrust or legal issues from the side of employees, and deploy them in coordination with employee feedback to come at the best conclusions ever. 

Those who are inclined towards big data hadoop certification, we’ve some droolworthy news for you! DexLab Analytics, a prominent data science learning platform has launched a new admission drive: #BigDataIngestion on in-demand skills: data science and big data with exclusive 10% discounts for all students. This summer, unfurl your career’s wings of success with DexLab Analytics!


Get the details here : www.dexlabanalytics.com/events/dexlab-analytics-presents-bigdataingestion


Reference:

The article has been sourced from https://www.entrepreneur.com/article/271753


Interested in a career in Data Analyst?

To learn more about Data Analyst with Advanced excel course – Enrol Now.
To learn more about Data Analyst with R Course – Enrol Now.
To learn more about Big Data Course – Enrol Now.

To learn more about Machine Learning Using Python and Spark – Enrol Now.
To learn more about Data Analyst with SAS Course – Enrol Now.
To learn more about Data Analyst with Apache Spark Course – Enrol Now.
To learn more about Data Analyst with Market Risk Analytics and Modelling Course – Enrol Now.

Enjoy 10% Discount, As DexLab Analytics Launches #BigDataIngestion

Enjoy 10% Discount, As DexLab Analytics Launches #BigDataIngestion

This summer, DexLab Analytics, a pioneering analytics training institute in Delhi is back in action with a whole new admission drive for prospective students: #BigDataIngestion with exclusive discount deals on offer. With an aim to promote an intensive data culture, we have launched Summer Industrial Training on Big Data Hadoop/Data Science. An exclusive 10% discount is on offer for all interested candidates. And, the main focus of the admission drive is on Hadoop, Data Science, Machine Learning and Business Analytics certification.

Data analytics is deemed to be the sexiest job of the 21st century; it’s comes as no surprise that young aspirants are more than eager to grasp the in-demand skills. Especially for them and others, DexLab Analytics emerges as a saving grace. Our state of the art certification training is completely in sync with the vision of providing top-of-the-line quality analytics coaching through fine approaches and student-friendly curriculum.

2

That being said, #BigDataIngestion is one of its kinds; while Hadoop and Data Science modules are targeted towards B. Tech and B.E students, Data Science and Business Analytics modules are exclusively oriented for Eco, Statistics and Mathematics students. The comprehensive certification courses help students embark on a wishful journey across various big data domains and architectures, triggering high-end IT jobs, but to avail the high-flying discount offer, the students need to present a valid ID card, while enrolling for the courses.

We are glad to announce that already the institute has gathered a good reputation through its cutting edge, open-to-all demo sessions. The demo sessions has helped countless prospective students in understanding the quality of courses and the way they are being imparted. Now, the new offer announced by the team is like an icing on the cake – 10% discount on in-demand big data courses sounds too alluring! And the admission procedure is also as easy as pie; you can either drop by the institute in person, or else can opt for online registration.

In this context, the spokesperson of DexLab Analytics stated, “We are glad to play an active role in the process of development and condoning of data analytics skills amongst the data-friendly students’ community of the country. We go beyond traditional classroom training and provide hands-on industrial training that will enable you to approach your career with confidence”. He further added, “We’ve always been more than overwhelmed to contribute towards the betterment of skilled human resources of the nation, and #BigDataIngestion is no different. It’s a summer industrial training program to equip students with formidable data skills for a brighter future ahead.”

For more information or to register online, click here: DexLab Analytics Presents #BigDataIngestion

#BigDataIngestion: DexLab Analytics Offers Exclusive 10% Discount for Students This Summer

Interested in a career in Data Analyst?

To learn more about Data Analyst with Advanced excel course – Enrol Now.
To learn more about Data Analyst with R Course – Enrol Now.
To learn more about Big Data Course – Enrol Now.

To learn more about Machine Learning Using Python and Spark – Enrol Now.
To learn more about Data Analyst with SAS Course – Enrol Now.
To learn more about Data Analyst with Apache Spark Course – Enrol Now.
To learn more about Data Analyst with Market Risk Analytics and Modelling Course – Enrol Now.

A Comprehensive Guide on Clustering and Its Different Methods

A Comprehensive Guide on Clustering and Its Different Methods

Clustering is used to make sense of large volumes of data, structured or unstructured, by dividing the data into groups. The members of a group are ‘’similar’’ between them and ‘’dissimilar’’ to objects in other groups. The similarity is based on characteristics such as equal distances from a point or people who read the same genre of book. These groups with similar members are called clusters. The various methods of clustering, which we shall be discussing subsequently, help break up data into logical groupings before analyzing the data more deeply.

If a CEO of a company presents a broad question like- ‘’ Help me understand our customers better so that we can improve marketing strategies’’, then the first thing analysts need to do is use clustering methods to the classify customers. Clustering has plenty of application in our daily lives. Some of the domains where clustering is used are:

  • Marketing: Used to group customers having similar interests or showing identical behavior from large databases of customer data, which contain information on their past buying activities and properties.
  • Libraries: Used to organize books.
  • Biology: Used to classify flora and fauna based on their features.
  • Medical science: Used for the classification of various diseases.
  • City-planning: identifying and grouping houses based on house type, value and geographical location.
  • Earthquake studies: clustering existing earthquake epicenters to locate dangerous zones.

Clustering can be performed by various methods, as shown in the diagram below:

Fig 1

The two major techniques used to perform clustering are:

  • Hierarchical Clustering: Hierarchical clustering seeks to develop a hierarchy of clusters. The two main techniques used for hierarchical clustering are:
  1. Agglomerative: This is a ‘’bottom up’’ approach where first each observation is assigned a cluster of its own, then pairs of clusters are merged as one moves up the hierarchy. The process terminates when only a single cluster is left.
  2. Divisive: This is a ‘’top down’’ approach wherein all observations start in one cluster, and splits are performed recursively as one moves down the hierarchy. The process terminates when each observation has been assigned a separate cluster.

Fig 2: Agglomerative clustering follows a bottom-up approach while divisive clustering follows a top-down approach.

  • Partitional Clustering: In partitional clustering a set of observations is divided into non-overlapping subsets, such that each observation is in exactly one subset. The main partitional clustering method is K-Means Clustering.

The most popular metric used for forming clusters or deciding the closeness of clusters is distance. There are various distance measures. All observations are measured using one particular distance measure and the observation having the minimum distance from a cluster is assigned to it. The different distance measures are:

  • Euclidean Distance: This is the most common distance measure of all. It is given by the formula:

Distance((x, y), (a, b)) = √(x – a)² + (y – b)²

For example, the Euclidean distance between points (2, -1) and (-2, 2) is found to be

Distance((2, -1), (-2, 2)) 

  • Manhattan Distance:

This gives the distance between two points measured along axes at right angles. In a plane with p1 at (x1, y1) and p2 at (x2, y2), Manhattan distance is |x1 – x2| + |y1 – y2|.

  • Hamming Distance:

Hamming distance between two vectors is the number of bits we must change to convert one into the other. For example, to find the distance between vectors 01101010 and 11011011, we observe that they differ in 4 places. So, the Hamming distance d(01101010, 11011011) = 4

  • Minkowski Distance:

The Minkowski distance between two variables X and Y is defined as

The case where p = 1 is equivalent to the Manhattan distance and the case where p = 2 is equivalent to the Euclidean distance.

These distance measures are used to measure the closeness of clusters in hierarchical clustering.

In the next blogs, we will discuss the different methods of clustering in more details, so make sure you follow DexLab Analytics– we provide the best big data Hadoop certification in Gurgaon. Do check our data analyst courses in Gurgaon.


Interested in a career in Data Analyst?

To learn more about Data Analyst with Advanced excel course – Enrol Now.
To learn more about Data Analyst with R Course – Enrol Now.
To learn more about Big Data Course – Enrol Now.

To learn more about Machine Learning Using Python and Spark – Enrol Now.
To learn more about Data Analyst with SAS Course – Enrol Now.
To learn more about Data Analyst with Apache Spark Course – Enrol Now.
To learn more about Data Analyst with Market Risk Analytics and Modelling Course – Enrol Now.

Big Data Could Solve Drug Overdose Mini Epidemic

Big Data Could Solve Drug Overdose Mini Epidemic

Big data has become an essential part of our everyday living. It’s altering the very ways we collect and process data.

Typically, big data in identifying at-risk groups also shows signs of considerable growth; the reasons being easy availability of data and superior computational power.

The issue of overprescribing of opioids is serious, and over 63000 people has died in the United States last year from drug overdose, out of which more than 75% of deaths occurred due to opioids. Topping that, there are over 2million people in the US alone, diagnosed with opioid use disorder.

But of course, thanks to Big Data: it can help physicians take informed decisions about prescribing opioid to patients by understanding their true characteristics, what makes them vulnerable towards chronic opioid-use disorder. A team from the University of Colorado accentuates how this methodology helps hospitals ascertain which patients incline towards chronic opioid therapy after discharge.

For big data training in Gurgaon, choose DexLab Analytics.

Big Data offers helps

The researchers at Denver Health Medical Center developed a prediction model based on their electronic medical records to identify which hospitalized patients ran the risk of progressing towards chronic opioid use after are discharged from the hospital. The electronic data in the record aids the team in identifying the number of variables linked to the advancement to COT (Chronic Opioid Therapy); for example, a patient’s history of substance abuse is exposed.

As good news, the model was successful in predicting COT in 79% of patients and no COT in 78% of patients. No wonder, the team claims that their work is a trailblazer for curbing COT risk, and scores better than software like Opioid Risk Tool (ORT), which according to them is not suitable for hospital setting.

Therefore, the prediction model is to be incorporated into electronic health record and activated when a healthcare specialist orders opioid medication. It would help the physician decipher the patient’s risk for developing COT and alter ongoing prescribing practices.

“Our goal is to manage pain in hospitalized patients, but also to better utilize effective non-opioid medications for pain control,” the researchers stated. “Ultimately, we hope to reduce the morbidity and mortality associated with long-term opioid use.”

As parting thoughts, the team thinks it would be relatively cheaper to implement this model and of great support for the doctors are always on the go. What’s more, there are no extra requirements on the part of physicians, as data is already available in the system. However, the team needs to test the cutting edge system a number of times in other health care platforms to determine if it works for a diverse range of patient populations.

On that note, we would like to say DexLab Analytics offers SAS certification for predictive modeling. We understand how important the concept of predictive analytics has become, and accordingly we have curated our course itinerary.


The blog has first appeared on – https://dzone.com/articles/using-big-data-to-reduce-drug-overdoses


Interested in a career in Data Analyst?

To learn more about Data Analyst with Advanced excel course – Enrol Now.
To learn more about Data Analyst with R Course – Enrol Now.
To learn more about Big Data Course – Enrol Now.

To learn more about Machine Learning Using Python and Spark – Enrol Now.
To learn more about Data Analyst with SAS Course – Enrol Now.
To learn more about Data Analyst with Apache Spark Course – Enrol Now.
To learn more about Data Analyst with Market Risk Analytics and Modelling Course – Enrol Now.
Call us to know more