Big data hadoop certification in noida Archives - Page 7 of 8 - DexLab Analytics | Big Data Hadoop SAS R Analytics Predictive Modeling & Excel VBA

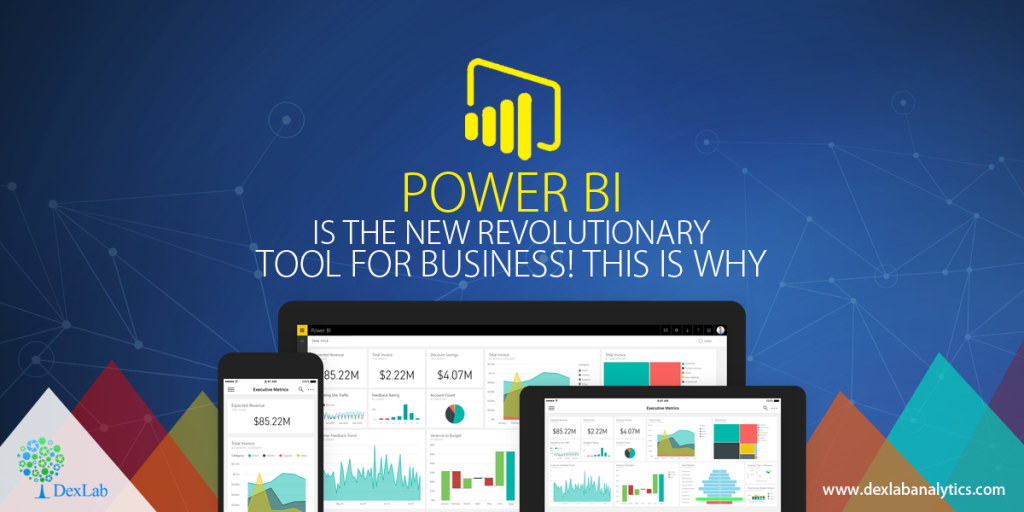
Power BI is The New Revolutionary Tool For Business! This is Why

Power BI is The New Revolutionary Tool For Business! This is Why

Microsoft launched its Power BI tool quite some time ago now, and the way things seem to advance is pretty amazing to say the least. This is a great Business Intelligence and analytics tool and it seems it is only a matter of time before the Power BI becomes the tool of choice for Business Intelligence and analytical works in almost all of the foresighted corporations.

This is a powerful BI tool now available in the hands of enterprises, who are looking to extract data from multiple disparate sources in order to derive meaningful insights from it. The tool offers unprecedented interactive visualization opportunities along with true self-servicing analytical capacities.

With all of these it helps the whole look of the same data to appear from varying angles and also allows the reports and dashboards to be made by anybody within the organization without assistance from IT administrators and developers.

The international analytics and BI market is to reach the mark of  USD 16.9 Billion in 2016 says Gartner!

Are you keen on acquiring a Big Data certification then check out DexLab Analytic’s Machine Learning courses in Delhi now!

Power BI is leading the way in cloud business analytics and intelligence. It offers the services, which can directly be harnessed from the cloud, and it is a huge advantage when it comes to how BI can be utilized. The desktop version of power BI is also available and is known as the Power BI desktop.

The entire range of ordinary tasks can be performed with this Power BI like – data discovery, data preparation, designing of the interactive dashboards. Microsoft also went a step ahead by putting up the embedded version of Power BI in its highly revered Azure cloud platform.

The company already has a pretty good presence in the analytics environment with its popular products like SSAS – SQL Server Analysis Service. However, it did not have any strong presence in the BI delivery system and OLAP segment i.e. Online Analytical Processing.

Excel for a long time has been Microsoft’s attempt at being a presentation layer for its data analysis tools. However, Excel has a lot of disadvantages like limited memory, integrity issues with data which are the main reasons why it is often not very appealing to the corporate clients who want something more malleable for business analytics.

You can give your career a powerful boost with Big Data training from the leading Big Data training institute in Delhi NCR.

Data Science Machine Learning Certification

However, a really powerful BI tool is what takes Excel to a great new level; it helps to offer a whole new experience to working with tools like Power Query for data extraction and its transformation. The Power Pivot tool which, is deployed for data analysis and modelling and lastly, the Power View which, is used to map the data and visualize it distinctly in unprecedented ways. With Power Bi one can put all of these tools into a consolidated manner and will make it easier to work without having to depend on to MS Office solely.

In closing thoughts, thus, it is safe to say that Power Bi is putting the right use of power in the right hands of the customers. so, a power BI training can be a good decision for one’s career at this point, for those who consider themselves as a forward-thinking IT professional.  


.
Tax department leans on Big Data analytics to mark out multiple PAN holders

To plug tax loopholes, the income tax (IT) department will use Big Data analytics to track tax evaders by collecting financial information about them, such as – common address, mobile number and e-mail to establish relationships between their multiple PANs. The department with support from various private firms will analyse the voluminous big data available post-demonetisation for checking transactional relationships between PAN holders.

 Tax department leans on Big Data analytics to mark out multiple PAN holders

  • The Managed Service Provider (MSP), which the IT department plans to hire, will design and operate analytical solutions that will in turn help in collating data, matching it and identifying relationships as well as clustering of the PAN and non-PAN data, an official said.
  • The analytical solutions would help the department gather data from banks, post offices and other sources for linking of information and identification of duplicate details. It will also identify records with errors or other defects for resubmission.

Continue reading “Tax department leans on Big Data analytics to mark out multiple PAN holders”

Improve Your Business Intelligence Strategy In Just Six Steps!

When Moore’s Law meets with modern day Business Intelligence, what happens? Disruption and then wider adoption!

Improve Your Business Intelligence Strategy In Just Six Steps!

With costs of implementing BI tools lowering, more and more enterprises are keen on jumping on-board the homebrewed variety of custom BI solution to help drive their business. The result of these efforts is that these days several organizations are pursuing data driven intelligent decision-making, at a cost, which is almost fractional compared to yesteryear’s Business Intelligence budgets.

A proper Big Data certification allows individuals to make the best of available smart BI solutions available out there!

But the question remains, as to are all these companies actually making better decisions?

Surely, most enterprises are now reaping the benefits of having a larger range of BI solutions available to them. Nevertheless, there is still a bigger room for error in the picture, which many firms tend to ignore.

If done right, BI solutions can deliver an ROI of USD 10.66 for the cost of every dollar spent on implementing them. But, as per a survey conducted by Gartner, the results are not so glorious for most firms. More than 70 percent of all BI implementations do not stand up to meet the business goals that were anticipated of them.

Due to the evolution and lowering BI solution prices, the demand for data analytics certification courses have grown by several manifolds.

Is there a secret formula to BI solution driven success? Well, starting with asking the right questions is always a good place to begin:

Here are six steps that can tip the balance in your favour:

Private-Blog-Network-Footprints

 Which data sources to use?

Do you know what the lifeblood is for BI? Why, data of course, data is what Business Intelligence strives upon. All firms do have a rudimentary strategy to collect and analyze data, however, they tend to overlook the data sources. The key here to note is – truly reliable data sources are the main difference between the success and failure of your Business Intelligence efforts.

These data sources do exist; all you have to do is choose right. In addition, the best thing about them is a lot of them are almost free of charge. Using the good ones will transform the way you look at your market, the business pipeline and the way you perceive your audience.

Are you warehousing your precious data right?

These are your firm’s single source data repositories. Warehouses store all the data you collect from various sources, and provide the same for when needed, on prompt for reporting and analysis. However, self-service BI tools can be a bit of hit-or-miss at times, where consistently handling data is a worry.

The key is to discover a data warehouse solution, which can efficiently store, curate and retrieve data for analysis on prompt.

Are your analytics solutions good enough?

Companies that are looking to use their own Business Intelligence infrastructures must identify the analytics architecture that best suits their necessities. However, unwieldy datasets in combination with a lack of processing maturity can dull the effort even before one decides to start!

How does your BI solution integrate with the existing platforms?

For incorporating enterprise-scale Business Intelligence solutions, it is necessary to have it work effortlessly with the different other information formats, processes and systems, which have already been established previously in the internal work pipeline.

So, the key here is to ask the question – will the necessary integration cost more in terms of resources and effort that you can afford?

Use reporting mechanisms that are both powerful as well as easy to understand:

The most persistent challenge in BI is to wrangle data, majority of users cannot understand any of it beyond a simplified visualization. Decision-makers may be fooled with the help of powerful visualization tools. However, the truth is that making it pretty alone will not get the job done right.

So, forget pretty, and ask the all important question of whether the reporting mechanism is useful in interpreting otherwise unintelligible data or not.

Has better compliance enabled through your Bi solutions?

If your BI solutions, directly impinges on relevant regulations (and so it will, when the time comes). Then the solutions should aid the compliance and not hinder it. A good BI solution should provide a means to trace and audit data and its sources wherever, needed.

In conclusion: the success of your efforts will ultimately depend on the data.

The field of data science is evolving in expertise. And even professionals involved in the field tend to vary in their capabilities and opinions about the same. So, the important thing is to consider the importance of data in your company, and that one has all the appropriate responses to the posed questions above.

You can learn to ask the right questions with comprehensive tableau BI training courses. For more information on tableau course details feel free to contact the experts at DexLab Analytics.


Interested in a career in Data Analyst?

To learn more about Machine Learning Using Python and Spark – click here.
To learn more about Data Analyst with Advanced excel course – click here.
To learn more about Data Analyst with SAS Course – click here.
To learn more about Data Analyst with R Course – click here.
To learn more about Big Data Course – click here.

What Does The Market Look Like for Hadoop in 2018 – 2022?

What Does The Market Look Like for Hadoop in 2018 – 2022?

It will be a simple understatement to say that Hadoop took the Big Data market up by storm this past years from 2012-2016. This time-period in the history of data witnessed a wave of mergers, acquisitions and high valuation rounds of finances. It will not be a simple exaggeration to state that today Hadoop is the only cost sensible and scalable open-source alternative option against the other commercially available Big Data Management tools and packages.

Recently it has not only emerged as the de-facto for all industry standard business intelligence (BI), and has become an integral part of almost all commercially available Big Data solutions.

Until 2015, it had become quite clear that Hadoop did fail to deliver in terms of revenues. From 2012 to 2015, the growth and development of Hadoop systems have been financed by venture capitalists mostly. It also made some funds through acquisition money and R&D project budgets.

But it is no doubt that Hadoop talent is sparse and also does not come in cheap. Hadoop smarts a steep learning curve that most cannot manage to climb. Yet, still more and more enterprises are finding themselves be attracted towards the gravitational pull of this massive open-source system, of Hadoop. It is mostly due to the functionality that it offers. Several interesting trends have emerged in the Hadoop market within the last 2 years like:

  • The transformation from batch processing to online processing
  • The emergence of MapReduce alternatives like Spark, DataTorrent and Storm
  • Increasing dissatisfaction among the people with the gap between SQL-on-Hadoop and the present provisions
  • Hadoop’s case will further see a spur with the emergence of IoT
  • In-house development and deployment of Hadoop
  • Niche enterprises are focussing on enhancing Hadoop features and its functionality like visualization features, governance, ease of use, and its way to ease up to the market.

While still having a few obvious setbacks, it is of no doubt that, Hadoop is here to stay for the long haul. Moreover, there is rapid growth to be expected in the near future.

Hadoop+the+Next+Big+Thing+in+India_2

Image Source: aws.amazon.com

As per market, forecasts the Hadoop market is expected to grow at CAGR (compounded annual growth rate) of 58% thereby surpassing USD 16 billion by 2020.

The major players in the Hadoop industry are as follows: Teradata Corporation, Rainstor, Cloudera, Inc. and Hortonworks Inc., Fujitsu Ltd., Hitachi Data Systems, Datameer, Inc., Cisco Systems, Inc., Hewlett-Packard, Zettaset, Inc., IBM, Dell, Inc., Amazon Web Services, Datastax, Inc., MapR Technologies, Inc., etc.

Several opportunities are emerging for Hadoop market with the changing global environment where Big Data is affecting the IT businesses in the following two ways:

  1. The need to accommodate this exponentially increasing amount of data (storage, analysis, processing)
  2. Increasingly cost-prohibitive models for pricing that are being imposed by the established IT vendors

010516Yelamaneni1

Image Source: tdwi.org

The forecast for Hadoop market for the years 2017-2022 can be summarised as follows:

  1. Hadoop market segment as per geographical factors: EMEA, America and Asia/Pacific
  2. As per software and hardware services: commercially supported software for Hadoop, Hadoop appliances and hardware, Hadoop services (integration, consulting, middleware, and support), outsourcing and training
  3. By verticals
  4. By tiers of data (quantity of data managed by organizations)
  5. As per application: advanced/predictive analysis, ETL/data integration, Data mining/visualization. Social media and click stream analysis. Data warehouse offloading; IoT (internet of things) and mobile devices. Active archives along with cyber security log analysis.

010516Yelamaneni2

Image Source: tdwi.org

This chain link graph shows that each component in an industry is closely linked to data analytics and management and plays an equally important role in generating business opportunities and better revenue streams.

Enjoy 10% Discount, As DexLab Analytics Launches #BigDataIngestion
DexLab Analytics Presents #BigDataIngestion

Contact Us Through Our Various Social Media Channels Or Mail To Know More About Availing This Offer!


THIS OFFER IS FOR COLLEGE STUDENTS ONLY!


Interested in a career in Data Analyst?

To learn more about Machine Learning Using Python and Spark – click here.
To learn more about Data Analyst with Advanced excel course – click here.
To learn more about Data Analyst with SAS Course – click here.
To learn more about Data Analyst with R Course – click here.
To learn more about Big Data Course – click here.

Black Money in India Can be Traced With Ease by Applying Big Data Analytics

The economy took a hit with the recent demonetization of the INR 500 and 1000 currency notes. The jury of economists around the world are still debating whether the move was good or not, but it has definitely caused a huge inconvenience for the public. Moreover, exchanging such a large amount of old currency notes is nothing shy of a mammoth Herculean task, as almost 85 percent of the economy is in the form of high denomination currency.

Black Money in India Can be Traced With Ease by Applying Big Data Analytics
                Black Money in India Can be Traced With Ease by Applying Big Data Analytics


These measures have been taken by the government to curb the flow of Black Money in India and get rid of corruption from its roots. While there is still a mixed reaction from the common people about this move about it being good or bad, technological experts have a different viewpoint about preventing the flow of Black Money in the country.  They say that with use modern technologies like Big Data Analytics it will be possible to trace Black Money painlessly and with much ease.

Continue reading “Black Money in India Can be Traced With Ease by Applying Big Data Analytics”

Big Data is the New Obsession of Small Business Owners

Big Data is the New Obsession of Small Business Owners

While this may seem somewhat counterintuitive, but instead of large organizations, it is actually small business owners and midsize companies who tend to be more inclined towards the applications of Big Data. They are also the first to adopt these latest technological innovations of which analytics is no exception – as these internet and data based insights are highly accessible and also affordable for SMBs.

As per the researchers in the fields of technology, the entry level capabilities in such fields like analytics has abruptly dropped which is why almost all types of industries from an array of sectors are engaging with them to enhance their competitiveness; and the wheels have already started to roll when it comes to increasing overall global competitiveness. Continue reading “Big Data is the New Obsession of Small Business Owners”

Big Data Hacks: 5 Amazing Free Data Sources

Big data hacks: 5 amazing free data sources

With the data explosion revealing a continuum of numbers and facts and figures across the web and across businesses, it is of no doubt that data is omnipresent. But as the saying goes, sometimes it is hard to see the forest due to all the trees.  A big myth among several companies is that they need to hire data analysts to look for their own data for analysis and to reap the benefits from Big Data analytics. But you must realize that this is far from the truth.

There are more than hundreds in fact even thousands of free data sets available for analysis and use for those who are smart enough to know where to look for them. Here is a list of 5 most popular free data set sources that are widely used globally. There are several more out there for those who are keen enough to look for them.

2

  • Data.gov: in compliance to the promise made by the US government last year all the government data is available for free on the internet in this site. The site is a useful source of information on everything starting from numbers in association to crime to climate change and much more.
  • Socrata: another great place to get scoop on the latest government related data along with some useful visualization tools that come built into the web portal.
  • org another place to access government data for free. One can get access to government data from the US, Canada, EU, CKAN and more.
  • World Health Organization data portal: a place to access all the statistics of hunger, health and disease of the world can be accessed here.
  • FaceBook Graph: FaceBook over the past few years has tightened their security and privacy settings. But there are still some amounts of data open to eyes without any privacy. And FaceBook provides information and access to all this data with their Graph API. While users may not be happy to share them with the world, they probably have not yet figured out how to hide them.

A bonus free data source that could also be fun to explore.

Face.com: get face recognition data with this fascinating tool and analyze possibilities like the creator.

These days a lot of forward thinking companies are trying to data driven, but they may not have ample resources to get their own data right away. So, it may be a good idea to begin with these publicly available free data sources. The best tip for data scientists is to learn to ask the right questions to get the right answers.

For more updates on big data hadoop training, follow DexLab Analytics. They are a premier big data training institution offering intensive career courses.


Interested in a career in Data Analyst?

To learn more about Data Analyst with Advanced excel course – Enrol Now.
To learn more about Data Analyst with R Course – Enrol Now.
To learn more about Big Data Course – Enrol Now.

To learn more about Machine Learning Using Python and Spark – Enrol Now.
To learn more about Data Analyst with SAS Course – Enrol Now.
To learn more about Data Analyst with Apache Spark Course – Enrol Now.
To learn more about Data Analyst with Market Risk Analytics and Modelling Course – Enrol Now.

Infographic: How Big Data Analytics Can Help To Boost Company Sales?

Infographic: How Big Data Analytics Can Help To Boost Company Sales?

Following a massive explosion in the world of data has made the slow paced statisticians into the most in-demand people in the job market right now. But why are all companies whether big or small out for data analysts and scientists?

Companies are collecting data from all possible sources, through PCs, smart phones, RFID sensors, gaming devices and even automotive sensors. However, just the volume of data is not the main factor that needs to be tackled efficiently, because that is not the only factor that is changing the business environment, but there is the velocity as well as variety of data as well which is increasing at light speed and must be managed with efficacy.

Why data is the new frontier to boost your sales figures?

Earlier the sales personnel were the only people from whom the customers gathered data about the products but today there are various sources from where customers can gather data so people are no longer that heavily reliant on the availability of data.

Continue reading “Infographic: How Big Data Analytics Can Help To Boost Company Sales?”

How Data Scientists Take Their Coffee Every Morning

How Data Scientists Have Their Coffee

To a data scientist we are all sources of data, from the very moment we wake up in the morning to visit our local Starbucks (or any other local café) to get our morning coffee and swipe the screen of our tablets/iPads or smart phones to go through the big headlines for the day. With these few apparently simple regular exercises we are actually giving the data scientists more data which in-turn allows them to offer tailor-made news articles about things that interest us, and also prepares our favorite coffee blend ready for us to pick up every morning at the café.

The world of data science came to exist due to the growing need of drawing valuable information from data that is being collected every other day around the world. But is data science? Why is it necessary? A certified data scientist can be best described as a breed of experts who have in-depth knowledge in statistics, mathematics and computer science and use these skills to gather valuable insights form data. They often require innovative new solutions to address the various data problems.

Data Science: Is It the Right Answer? – @Dexlabanalytics.

As per estimates from the various job portals it is expected that around 3 million job positions are needed to be fulfilled by 2018 with individuals who have in-depth knowledge and expertise in the field of data analytics and can handle big data. Those who have already boarded the data analytics train are finding exciting new career prospects in this field with fast-paced growth opportunities. So, more and more individuals are looking to enhance their employability by acquiring a data science certification from a reputable institution. Age old programs are now being fast replaced by new comers in the field of data mining with software like R, SAS etc. Although SAS has been around in the world of data science for almost 40 years now, but it took time for it to really make a big splash in the industry. However, it is slowly emerging to be one the most in-demand programming languages these days.What a data science certification covers?

Tracing Success in the New Age of Data Science – @Dexlabanalytics.

This course covers the topics that enable students to implement advanced analytics to big data. Usually a student after completion of this course acquires an understanding of model deployment, machine language, automation and analytical modeling. Moreover, a well-equipped course in data science helps students to fine-tune their communication skills as well.

Keep Pace with Automation: Emerging Data Science Jobs in India – @Dexlabanalytics.

Things a data scientist must know:

All data scientists must have good mathematical skills in topics like: linear algebra, multivariable calculus, Python and linear algebra. For those with strong backgrounds in linear algebra and multivariable calculus it will be easy to understand all probability, machine learning and statistics in no time, which is a requisite for the job.

More and more data-hungry professionals are seeking excellent Data Science training in Delhi. If you are one of them, kindly drop by DexLab Analytics: we are a pioneering Data Science training institute. Peruse through our course details for better future.


Interested in a career in Data Analyst?

To learn more about Data Analyst with Advanced excel course – Enrol Now.
To learn more about Data Analyst with R Course – Enrol Now.
To learn more about Big Data Course – Enrol Now.

To learn more about Machine Learning Using Python and Spark – Enrol Now.
To learn more about Data Analyst with SAS Course – Enrol Now.
To learn more about Data Analyst with Apache Spark Course – Enrol Now.
To learn more about Data Analyst with Market Risk Analytics and Modelling Course – Enrol Now.

Call us to know more