Big data courses Archives - Page 8 of 8 - DexLab Analytics | Big Data Hadoop SAS R Analytics Predictive Modeling & Excel VBA

Credit Risk Managers Must use Big Data in These Three Ways

Credit risk managers must use Big Data in these three ways

While the developed nations are slowly recovering from the financial chaos of post depression, the credit risk managers are facing growing default rates as household debts are increasing with almost no relief in sight. As per the reports of the International Finance which stated at the end of 2015 that household debts have risen to by USD 7.7 trillion since the year 2007. It now stands at the heart stopping amount of a massive USD 44 trillion and the amount of debts increased in the emerging markets is of USD 6.2 trillion. The household loans of emerging economies calculating as per adult rose by 120 percent over the period and are now summed up to USD 3000.

To thrive in this market of increasing debts, credit risk managers must consider innovative methods to keep accuracy in check and decrease default rates. A good solution to this can be applying the data analytics to Big Data. Continue reading “Credit Risk Managers Must use Big Data in These Three Ways”

The Worst Techniques To Build A Predictive Model

While some of these techniques may be a little out of date and most of them have evolved over time greatly, for the past 10 years rendering most of these tools completely different and much more efficient to use. But here are few bad techniques in predictive modelling that are still widely in use in the industry:


Predictive Model


1. Using traditional decision trees: usually too large decision trees are usually really complex to handle and almost impossible to analyze for even the most knowledgeable data scientist. They are also prone to over-fitting which is why they are best avoided. Instead we recommend that you combine multiple small decision trees into one than using a single large decision tree to avoid unnecessary complexity.

Continue reading “The Worst Techniques To Build A Predictive Model”

How Can Big Data Impact the Lives of Students?

According to figures released by IBM opine that no less than 2.5 quintillion bytes created on a daily basis. Also it is worthwhile to note that a whopping 90% of the total data in the world have been created only in last two years.

In simple terms data is just pieces of information. The highly prominent concept of our times owes its origins to large data amounts which are derived from all sorts of computing devices. This data is then stored, collated and combined with the sophisticated tools for analytics available today.

Big Data is helpful to a broad spectrum of people from marketers to researchers. It helps them to understand the world around them and take optimized action through insights. Students too stand to benefit from Big Data a great deal and in this post we look at two ways through which Big Data may affect the lives of students.

It Helps To Be More Effective

Teachers have always been an informed lot, using data in order to optimize the practices and methods, Big Data facilitates the creation of far more powerful ways through which teachers and students may connect. As the focus shifts towards personalized learning, teachers are in a position to utilize more data than ever before.

This may be achieved through monitoring of study materials and how they are used by students in order to deliver more targeted instruction. With Big Data teachers will be able to better understand the needs of students and adapt lessons effectively and swiftly and in the end make decisions about enhanced learning for students, driven on the basis of data.

2

There is a Huge Demand for Data Scientists

Data Science was dubbed as the sexiest job of this century by Harvard Business Review and with good reason. People are just beginning to explore the possibilities enabled by Big Data and the need of skilled people in the field will only continue to increase in the years to come. Data Scientists have the ability to mine through data to the benefit of their employers including but not restricted to governments, businesses and of course, the academia.

McKinsey Global Institute reported that by 2018 there will be a shortage of no less than 190,000 persons with skills in deep analytics in the United States of America alone. There is no shortage for opportunities in this field and there are numerous programs all over the world that smooth out the career transition to Big Data. Work arrangements that display flexibility, more than decent compensation packages and the opportunity to make a significant impact are the added bonuses that go along being a data scientist.

We may conclude by saying that though Big Data is still emerging it held by most experts to be the undeniable future not only for those pursuing studies in data science and making careers in the field but to all the people whose lives are changed for the better through Big Data.


Interested in a career in Data Analyst?

To learn more about Data Analyst with Advanced excel course – Enrol Now.
To learn more about Data Analyst with R Course – Enrol Now.
To learn more about Big Data Course – Enrol Now.

To learn more about Machine Learning Using Python and Spark – Enrol Now.
To learn more about Data Analyst with SAS Course – Enrol Now.
To learn more about Data Analyst with Apache Spark Course – Enrol Now.
To learn more about Data Analyst with Market Risk Analytics and Modelling Course – Enrol Now.

Big Data Strikes The Healthcare Industry With Carolinas Healthcare

big data courses in gurgaon
A representative from the administrative section of Carolinas Healthcare recently revealed that they are huge fans of Big Data and are extensively harnessing this convenient technology to leverage the quality of facilities they offer their patients.

2

Carolinas healthcare is a Charlotte – based firm which is extensively using this new form of data analysis technology at their very own data warehouse to evenly distribute its population of medical treatment seekers. This is helping them make the right choice in finding the most unique cases for their patient base. They are now able to take into consideration various segments that were ignored initially due to the systemic lack in the infrastructure of data management. Now they are counting segments like,environmental and geographical conditions in relation to diseases and are dividing them into segments for better efficiency in determining trends and patterns.

They hope to draw useful conclusions from such studies and to be able to make predictions so that they can minimize readmissions, inappropriate use of emergency aids and take care of the hospitalization procedures.Dr. Michael Dulin M.D. spoke on their latest venture by saying, “It is our firm belief at CHS that to deliver the best hospitalization and healthcare facilities to our patients, we need to make appropriate use of the huge amounts of data that is generated in the healthcare industry”. He is the chief clinical officer at the firm, Dickson Advanced Analytics Group which goes by the name DA2. The unit which was launched back in 2012 and is in its budding years currently. But already comprises of 130 experts who are all working together to make better use healthcare data which is a mountainous amount to begin with. It is of no doubt that Big Data is being of good use to the healthcare industry and there are glorious future prospects for experts concerned with this field, globally.

Dr. Michael further added, that “Taking into considerations the data on genomics, environmental poisons, lab results, demographics, physician’s notes and other data generated based on patients will provide them with the much needed insight required to tighten and personalize the world of health care.

Deep Learning and AI using Python

Current statistics suggest that the data generated in the healthcare world every two years is almost doubling every two years. This is the same for CHS. Thus, it is evident that CHS and other healthcare organizations will require using advanced data mining tools and use statistical methods to cope and thrive in the market.


Interested in a career in Data Analyst?

To learn more about Data Analyst with Advanced excel course – Enrol Now.
To learn more about Data Analyst with R Course – Enrol Now.
To learn more about Big Data Course – Enrol Now.

To learn more about Machine Learning Using Python and Spark – Enrol Now.
To learn more about Data Analyst with SAS Course – Enrol Now.
To learn more about Data Analyst with Apache Spark Course – Enrol Now.
To learn more about Data Analyst with Market Risk Analytics and Modelling Course – Enrol Now.

Delimiters And Delimited Data in SAS

In this blog post we will delve into the world of delimiters as found in the SAS system of data analysis tools. Delimiters are an essential part of SAS without whose guidance SAS would be in some blind inspite of all the data that surrounds it as the data supplied to it either internally or as an external file.


sas courses

What are Delimiters?

Delimiters are essentially symbols to SAS that lets SAS know that the data is separate. They distinguish one set or category of data from others. This should give you an idea about how essential a part of data analytics, a delimiter plays.

How are the Delimiters Symbolized?

SAS accepts the following symbols and key strokes as delimiters:

  •  ,
  •  :
  • Tab
  •  ~
  • &
  •  –

How to Import Delimited Data?

This command imports data infile

Data claim_data;

infile datalines dlm = “,”;

Input sex $ name $ claim_amount ; datalines;

Male,Mahesh,15000

Male,Naveen,10000

Female,Neeta,18000

Male,Amit,7500

Female,Geeta,12000

;

run;

data claim_data ;

Infile E:\Project FT\SAS\Course Material\Class 1\Claim Data comma.txt’ dlm = “,”;

Input sex $ name $ claim_amount ;

Run;

What are the Functions of Delimiters?

An INFILE option, the DSD or delimiter-sensitive data serves varied functions. They are as follows:

  • The default delimiters are changed to wanted ones from the default blank.
  • In case a row contains two delimiters, SAS interprets that there is an instance of a case of missing value.
  •  Delimiters also strip the quotes within which character values are placed.

So the command would boil down to:

data claim_data ;

Infile E:\Project FT\SAS\Course Material\Class 1\Claim Data comma.txt’ dsd;

Input sex $ name $ claim_amount ;

Run

How to Read Data from an External CSV file?

Our next task is to read data from external CSV files. In order to do so we have to input the following:

proc import datafile = “E:\Project FT\SAS\Course Material\Class 1\exam_results.csv”

dbms = csv replace out = class_10_result; Getnames = yes; run;

In a Nutshell

What are Format, Informat and DSD?

  • Informat : This command instructs SAS how exactly to going about reading the data.
  • Format : This instructs SAS about the exact way in which to show the details.
  • DSD : This defines how data is separated by a delimiter.

Sure shot Ways to Crack Big Data Interviews

Sure shot Ways to Crack Big Data Interviews

If you are a Big Data analyst looking for open position in the entry to mid level range of experience then you should prepare yourself with the following resources in your arsenal before you storm an interview with all guns blazing.

  • Adequate Expertise of Analytical tools like SAS for the processing of data

Make sure that you assign most of the time you have set aside for the preparation of your upcoming interview to brush up your knowledge regarding the tools of analytics that are relevant in your context. Ensure that you acquire proficiency in the analytics tool of your choice. For positions of junior levels the importance of expertise with a particular analytical tool like Hadoop, R or SAS cannot be overstressed. In such circumstances the focus centers around data preparation and processing. It is highly advisable that you review concepts related to the import and manipulation of data, the ability to read data even if it not standard say for example data whose input file types are multiple in number and mixed data formats. You also get to show off your skills at efficiently joining multiple datasets, selecting conditionally the observations or rows of data, how to go about heavy duty data processing of which SQL or macros are the most critical.

  • Make a Proper Review of End to End Business Process

This is most relevant towards candidates who have prior experience at working in the Big Data and Analytics industry. Prior experience inevitably gives rise to interviewers wanting to know more about the responsibilities that you shouldered and your role in the business process and how you fitted in the context of the broader picture. You should be able to convey to the interviewer that the data source is understood by you along with its processing and use.

  • A solid concept of the rudiments of statistics and algorithms

Again this tip is also for those with prior experience. Recruiters seek to know whether you are aware of issues likely to be faced by you while you confront problems regarding data and business. Even freshers are expected to know the fundamental concepts of statistics like rejection criteria, hypothesis testing outcomes, measures of model validation and the statistics related assumptions that a candidate must know about in order to implement algorithms of various sorts. In order to crack the interview you must be prepared with adequate knowledge of concepts related to statistics.

  • Prepare Yourself with At Least 2 Case Studies related to Business

The person on the other side of the interview table will undoubtedly try to make an assessment about your knowledge as far as business analytics is concerned and not solely to the proficiency you command in your tool of choice. Devote time to review projects on analytics you already have worked on if you have prior experience. Be prepared to elucidate on the business problem, the steps that were involved in the processing of data and the algorithm put into use in the creations of the models and reasons behind, and the way the results of the model was implemented. The interviewer might also ask about the challenges faced by you at any stage of the whole process, so keep in mind the issues faced by you in the past and their eventual resolution.

2

  • Make Sure that Your Communication Remains Effective

If you are unable to effectively communicate then no much diligent preparations you make, they will be of no use. You can try out mock interviews and answering questions that the recruiter might ask. Spare yourself of the trouble of framing effective answers at the moment when the question is asked during an interview. Though you perhaps will be unable to anticipate each and every question, nevertheless but prior preparation will result in better and more coherent answers.


Interested in a career in Data Analyst?

To learn more about Data Analyst with Advanced excel course – Enrol Now.
To learn more about Data Analyst with R Course – Enrol Now.
To learn more about Big Data Course – Enrol Now.

To learn more about Machine Learning Using Python and Spark – Enrol Now.
To learn more about Data Analyst with SAS Course – Enrol Now.
To learn more about Data Analyst with Apache Spark Course – Enrol Now.
To learn more about Data Analyst with Market Risk Analytics and Modelling Course – Enrol Now.

Big Data at Autodesk: 360 Degree view of Customers in the Cloud

The last few years have seen a huge paradigm shift for many software vendors. The move away from a product-based model towards software-as-a-service (SAAS) in the cloud has brought huge changes. The main advantage of moving from a product based model to software-as-a-service is that the companies will be able to identify the service usage of how and why a product is being used. Earlier software companies used to run a survey or focus groups of customer feedback to identify the how and why a product is being used. This customer feedback survey has various limitations on identifying the product usage or where the product improvement has to be made.

Here’s All You Need to Know about Quantum Computing and Its Future

Autodesk was one of the frontrunners in the field, having been experimenting with the cloud based SAAS as far back as 2001 when it is acquired the BUZZSAW file sharing and synchronization service. Since then Microsoft, Adobe and many others moving into a subscription based, on-demand service and Autodesk has done the same with its core computer aided design products.

Software-as-a-service is a software licensing and delivery model in which software is licensed on a subscription basis and is centrally hosted. It is sometimes referred to as on-demand software. On-premise software is the exact opposite where the delivery of product is inside the particular organizations infrastructure.

Understanding how customers use a product is critical to giving them what they want. In a SAAS environment where everything is happening online and in the cloud, companies can gain a far more accurate picture  

2


The idea of moving to cloud based subscription model gives the business to understand more about the product usage of customers. This gives them the edge to serve better to the customers. The shift in the industry shall not be ignored. Big Data is really being used now to understand how and where to improve the product.


The Indian IT industry is focusing mainly on Cloud, Analytics, Mobile and Social segment to further drive growth. This Software-as-a-service delivery model can certainly give the edge to do data analysis on where and how the product is used.


There are number of reasons why Software-as-a-service is beneficial to organizations:


  • No additional hardware costs, you can buy the processing power or hardware as per the requirement. Do not have to go for high end configuration as there is no requirement. Need based subscription.
  • Usage is scalable. You can scale whenever you require.
  • Applications can be customised.
  • Accessible from any location, rather than being restricted to installations on individual computers an application can be accessed from anywhere with an internet enabled device.


The adoption of cloud based delivery model is accelerating mainly because of the analytical capability it gives the business to understand the customers. Analytics rocks!.


For state of the art big data training in Pune, look no further than DexLab Analytics. It is a renowned institute that excels in Big data hadoop certification in Pune. For more information, visit their official site.


Interested in a career in Data Analyst?

To learn more about Machine Learning Using Python and Spark – click here.
To learn more about Data Analyst with Advanced excel course – click here.
To learn more about Data Analyst with SAS Course – click here.
To learn more about Data Analyst with R Course – click here.
To learn more about Big Data Course – click here.

Tips to Make Sense of All The Big Data Around Us, You Can Make a Difference

Tips To Make Sense Of All The Big Data Around Us, You Can Make A Difference

We are all in the midst of the onslaught of information overload in many ways. We create it, transfer it and heartily participate in it. To get a grasp of the actual reality faced by businesses of all sizes, one needs to understand the exact scenario. According to IDC1, “The big data and analytics market will reach $125 billion worldwide in 2015” Further, IDC predicts, “Clearly IoT (Internet of Things) analytics will be hot, with a five-year CAGR of 30%.”

big-data-analytics

Data is created from all the posts made every second globally on social media, the humongous chatter, digital photo sharing, video uploads, online transactions, all the cell phone signals etc. – are all forms of data being generated leading to a massive information overload across servers and of course the cloud platforms.

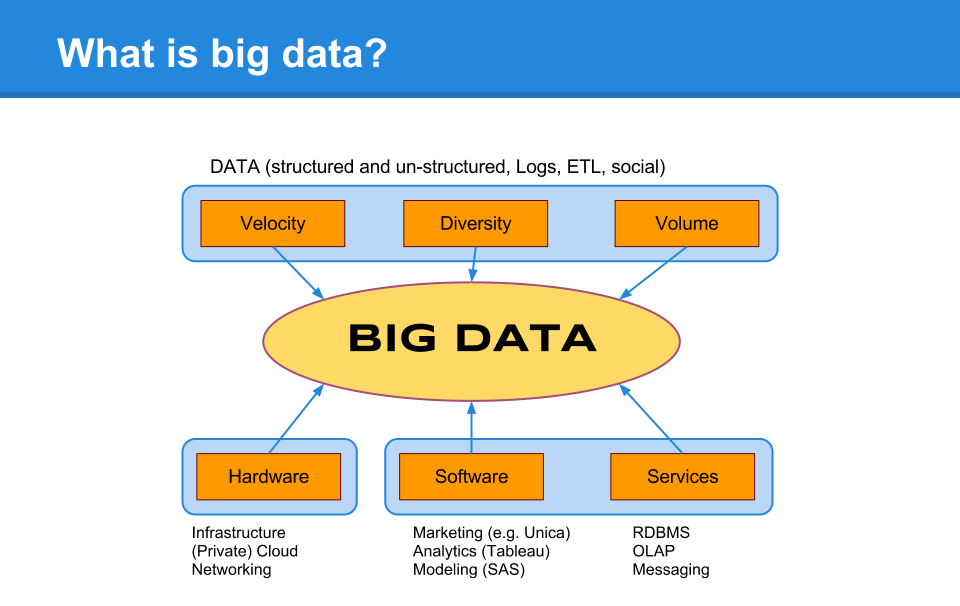
All this digitization has led to a severe business challenge – so much big data, but how to make sense of all this? How does one use it for any kind of business related decision or direction? The following are some tips to help business make some sense from all this data right within their ambit.

1-Break it down

Big data remains big, unless methods are employed to break it into tiny usable groups of information. Eliminating, cross-referencing and grouping are the first steps to sort out various disparate data bytes.

2-Deduplication

There will always be the challenge of similar data springing up and being stored. Deduplication works as a primary point of ensuring that there is a reduction in the same data coming up for analysis.

3-Technology and its role

The role of specific technology cannot be ignored, when it comes to ensuring that all this big data is streamlined, stored safely and processed using the latest available techniques.

Big Data Landscape

4-Do not discard anything

Even the smallest and seemingly insignificant amount of information may be relevant and hold key insights.

5-Best practices for data analysis

The ecosystem revolving around the actual analysis of the big data needs to evolve into a more standardized format to be used across flexible structures leading to quicker outputs, better results and arriving at useful insights.

6-Having the right talent

This is one of the most important aspects, when it comes to actually making sense of all the data lying around across organizations. This is where trained and certified big data analysts appear.

DexLab Analytics Presents #BigDataIngestion

A Special Alert: DexLab Analytics is offering #SummerSpecial 10% off on in-demand courses of big data hadoop, data science, machine learning and business analytics. Enroll now for #BigDataIngstion: the new on-going admission drive!

Interested in a career in Data Analyst?

To learn more about Data Analyst with Advanced excel course – Enrol Now.
To learn more about Data Analyst with R Course – Enrol Now.
To learn more about Big Data Course – Enrol Now.

To learn more about Machine Learning Using Python and Spark – Enrol Now.
To learn more about Data Analyst with SAS Course – Enrol Now.
To learn more about Data Analyst with Apache Spark Course – Enrol Now.
To learn more about Data Analyst with Market Risk Analytics and Modelling Course – Enrol Now.

Call us to know more