Big data courses Archives - Page 7 of 8 - DexLab Analytics | Big Data Hadoop SAS R Analytics Predictive Modeling & Excel VBA

Tax department leans on Big Data analytics to mark out multiple PAN holders

To plug tax loopholes, the income tax (IT) department will use Big Data analytics to track tax evaders by collecting financial information about them, such as – common address, mobile number and e-mail to establish relationships between their multiple PANs. The department with support from various private firms will analyse the voluminous big data available post-demonetisation for checking transactional relationships between PAN holders.

 Tax department leans on Big Data analytics to mark out multiple PAN holders

  • The Managed Service Provider (MSP), which the IT department plans to hire, will design and operate analytical solutions that will in turn help in collating data, matching it and identifying relationships as well as clustering of the PAN and non-PAN data, an official said.
  • The analytical solutions would help the department gather data from banks, post offices and other sources for linking of information and identification of duplicate details. It will also identify records with errors or other defects for resubmission.

Continue reading “Tax department leans on Big Data analytics to mark out multiple PAN holders”

Improve Your Business Intelligence Strategy In Just Six Steps!

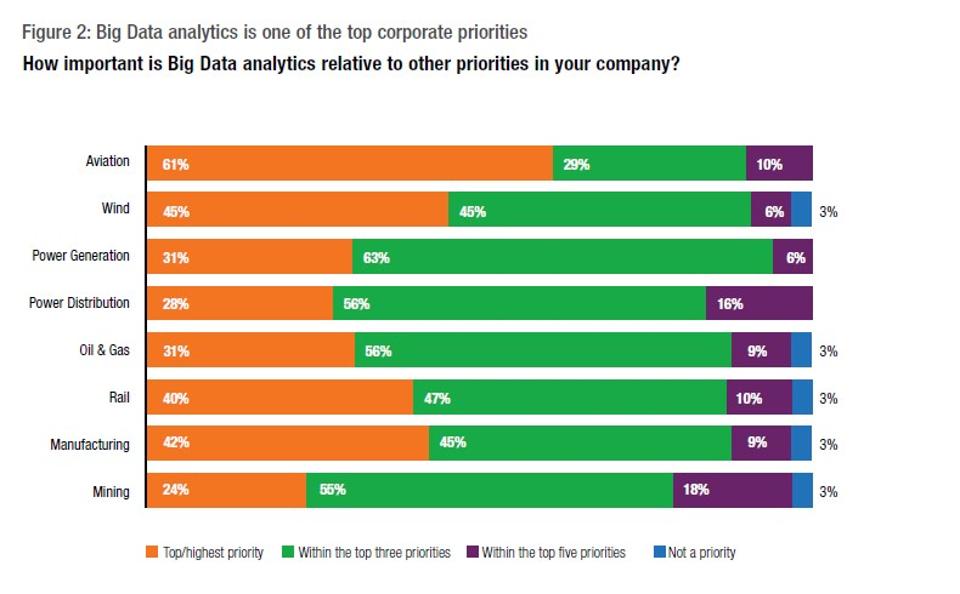
When Moore’s Law meets with modern day Business Intelligence, what happens? Disruption and then wider adoption!

Improve Your Business Intelligence Strategy In Just Six Steps!

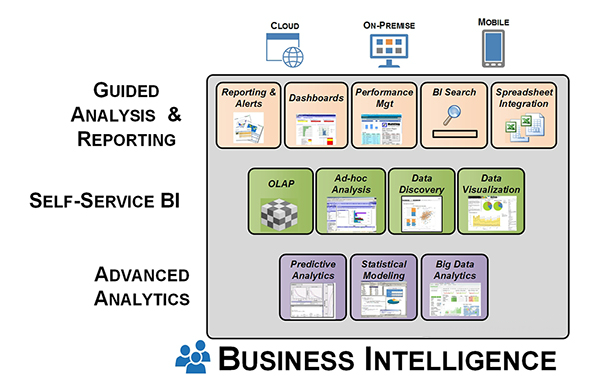
With costs of implementing BI tools lowering, more and more enterprises are keen on jumping on-board the homebrewed variety of custom BI solution to help drive their business. The result of these efforts is that these days several organizations are pursuing data driven intelligent decision-making, at a cost, which is almost fractional compared to yesteryear’s Business Intelligence budgets.

A proper Big Data certification allows individuals to make the best of available smart BI solutions available out there!

But the question remains, as to are all these companies actually making better decisions?

Surely, most enterprises are now reaping the benefits of having a larger range of BI solutions available to them. Nevertheless, there is still a bigger room for error in the picture, which many firms tend to ignore.

If done right, BI solutions can deliver an ROI of USD 10.66 for the cost of every dollar spent on implementing them. But, as per a survey conducted by Gartner, the results are not so glorious for most firms. More than 70 percent of all BI implementations do not stand up to meet the business goals that were anticipated of them.

Due to the evolution and lowering BI solution prices, the demand for data analytics certification courses have grown by several manifolds.

Is there a secret formula to BI solution driven success? Well, starting with asking the right questions is always a good place to begin:

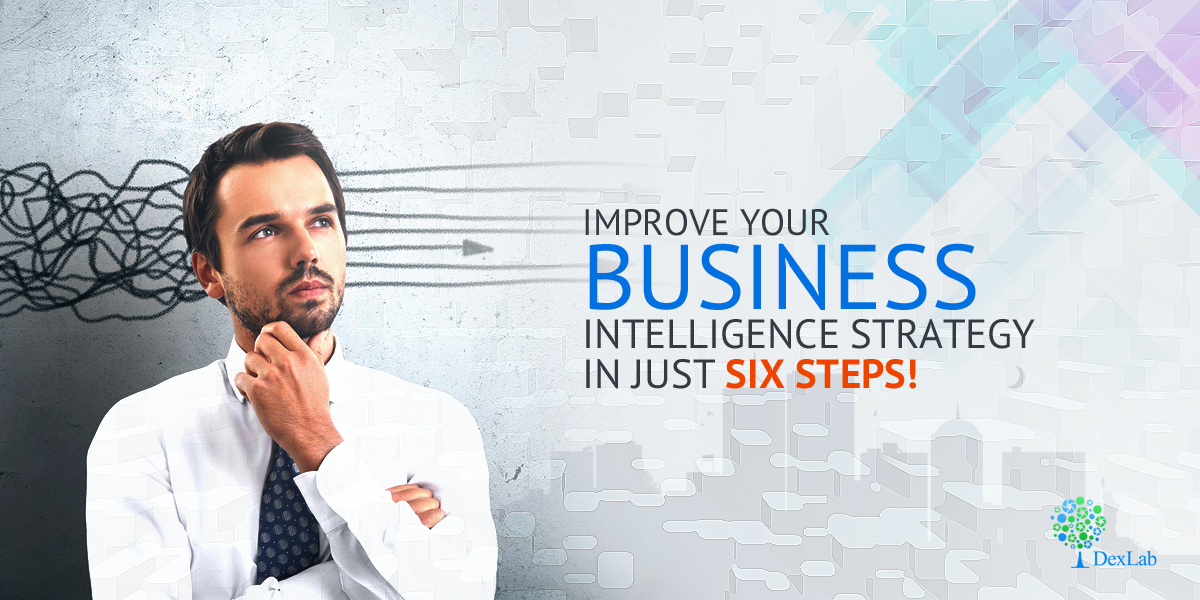
Here are six steps that can tip the balance in your favour:

Private-Blog-Network-Footprints

 Which data sources to use?

Do you know what the lifeblood is for BI? Why, data of course, data is what Business Intelligence strives upon. All firms do have a rudimentary strategy to collect and analyze data, however, they tend to overlook the data sources. The key here to note is – truly reliable data sources are the main difference between the success and failure of your Business Intelligence efforts.

These data sources do exist; all you have to do is choose right. In addition, the best thing about them is a lot of them are almost free of charge. Using the good ones will transform the way you look at your market, the business pipeline and the way you perceive your audience.

Are you warehousing your precious data right?

These are your firm’s single source data repositories. Warehouses store all the data you collect from various sources, and provide the same for when needed, on prompt for reporting and analysis. However, self-service BI tools can be a bit of hit-or-miss at times, where consistently handling data is a worry.

The key is to discover a data warehouse solution, which can efficiently store, curate and retrieve data for analysis on prompt.

Are your analytics solutions good enough?

Companies that are looking to use their own Business Intelligence infrastructures must identify the analytics architecture that best suits their necessities. However, unwieldy datasets in combination with a lack of processing maturity can dull the effort even before one decides to start!

How does your BI solution integrate with the existing platforms?

For incorporating enterprise-scale Business Intelligence solutions, it is necessary to have it work effortlessly with the different other information formats, processes and systems, which have already been established previously in the internal work pipeline.

So, the key here is to ask the question – will the necessary integration cost more in terms of resources and effort that you can afford?

Use reporting mechanisms that are both powerful as well as easy to understand:

The most persistent challenge in BI is to wrangle data, majority of users cannot understand any of it beyond a simplified visualization. Decision-makers may be fooled with the help of powerful visualization tools. However, the truth is that making it pretty alone will not get the job done right.

So, forget pretty, and ask the all important question of whether the reporting mechanism is useful in interpreting otherwise unintelligible data or not.

Has better compliance enabled through your Bi solutions?

If your BI solutions, directly impinges on relevant regulations (and so it will, when the time comes). Then the solutions should aid the compliance and not hinder it. A good BI solution should provide a means to trace and audit data and its sources wherever, needed.

In conclusion: the success of your efforts will ultimately depend on the data.

The field of data science is evolving in expertise. And even professionals involved in the field tend to vary in their capabilities and opinions about the same. So, the important thing is to consider the importance of data in your company, and that one has all the appropriate responses to the posed questions above.

You can learn to ask the right questions with comprehensive tableau BI training courses. For more information on tableau course details feel free to contact the experts at DexLab Analytics.


Interested in a career in Data Analyst?

To learn more about Machine Learning Using Python and Spark – click here.
To learn more about Data Analyst with Advanced excel course – click here.
To learn more about Data Analyst with SAS Course – click here.
To learn more about Data Analyst with R Course – click here.
To learn more about Big Data Course – click here.

Five Major Big Data Trends That Will Shape AI this New Year

Many still believe that Big Data is a grossly misunderstood, mega trending buzzword in the tech field even today. However, there is still no denying of the fact that the recent development of AI and machine learning push is related on the synthesis and labelling of huge amounts of training data. A latest trend report by the advisory firm Ovum predicted that the Big Data market which currently is valued to be USD 1.7 billion, will further rise to be USD 9.4 billion by 2020.


Five Major Big Data Trends That Will Shape AI This New Year


Then what do the insiders in the data analytics market see it happening in the upcoming year ahead? We at DexLab Analytics, the premiere Big Data Hadoop institute in Delhi spoke to several leaders in this field to discover.


Here is what we found to be the five most important trends that will shape the future of machine learning, AI and data analytics in 2017 from the industry experts:


The predictions strongly emphasize the need for more talent and skilled personnel in this vast field of data analytics, thus, a growing demand for Big Data training and Big Data courses will be witnessed worldwide.

Continue reading “Five Major Big Data Trends That Will Shape AI this New Year”

Big Data Analytics and its Impact on Manufacturing Sector

Big Data Analytics and its Impact on Manufacturing Sector

It is no new news that the Big Data and software analytics have had a huge impact on the modern industries. There are several industry disruptors that have surfaced in the past few years and totally changed the lives of all connected humans. Like Google, Tesla and Uber! These are the companies that have used the long list of benefits presented to us by Big Data to expand and infiltrate newer markets, they have helped themselves improve customer relations and enhance their supply chains in multiple segments of market.

As per the latest IDC Research projects the sale of Big Data and analytics services will rise to USD 187 billion in 2019. This will be a huge leap from the USD 122 billion which was recorded in 2015. A major industry that stands to benefit greatly from this expansion which is the manufacturing industry, with the industry revenue projections ranging to USD 39 billion by 2019.

The industry of manufacturing has come a long way from the age of craft industries. But back then, the manufacturing process involved a slow and tedious production processes which only yielded limited amounts of products.

The effects of Big Data Analytics on the Manufacturing sector:

 Automated processes along with mechanization have resulted in a generation of large piles of data, which is, much more than what most manufacturing enterprises know what to do with them.

But such data can yield beneficial insights for the manufacturing units to improve their operations and increase their productivity. Here are a few notable ones:


The effects of Big Data Analytics on the Manufacturing sector:

Image Source: mckinsey.com

Savings in cost:

Big data analytics can really help transform the manufacturing process and revolutionize the way they are carried out. The obtained information can be used to reduce the cost of production and packaging during manufacturing. Moreover, companies which implement data analytics can also reduce the cost of transport, packaging along with warehousing. This is in turn can help inventory costs and return i huge savings.

Improvement in safety and quality:

A lot of manufacturing companies are now making use of computerised sensors during the production to sift through low quality products while on the assembly line. With the right software analytics enterprises can use the data generated from such sensors to improve the quality and safety of the products instead of simply throwing away the low quality products after the production.

Improvement in safety and quality:

Image Source: blogs-images.forbes.com

Tightening up the workforce efficiency:

They can also use this data to improve management and employee efficiency. Big data analytics can be used to study the error rates on the production floor and use that information to analyse specific regions where employees are good when they perform under pressure.

Moreover, data analytics may help to speed up the production process n the production floor. S will be especially useful for large firms, which work with large volumes of data.

Better collaboration:

A great advantage of having an IT based data collection and analysis infrastructure is improved information movement within the manufacturing organization. The synergy of flow of information within the management and engineering departments as well as in the quality control sector and between the machine operators and other departments of the company helps them work more efficiently.

The manufacturing industry is much more complex than any other industry, which have implemented the big data analytics. Companies must effectively time the implementation of this software so that there are no losses. And should also pay attention as to from where they can mine the data and the right analytics tools to use for producing feasible and actionable results.


Interested in a career in Data Analyst?

To learn more about Data Analyst with Advanced excel course – Enrol Now.
To learn more about Data Analyst with R Course – Enrol Now.
To learn more about Big Data Course – Enrol Now.

To learn more about Machine Learning Using Python and Spark – Enrol Now.
To learn more about Data Analyst with SAS Course – Enrol Now.
To learn more about Data Analyst with Apache Spark Course – Enrol Now.
To learn more about Data Analyst with Market Risk Analytics and Modelling Course – Enrol Now.

Governance is Planning To Drive Compliance With GDPR

Governance is Planning To Drive Compliance With GDPR

The companies’ data governance program is usually linked to the implementation of the General Data Regulation Program. And throughout time several articles have been written about to link the two initiatives but till none was so clearly distinct as the recent one on LinkedIn by Dennis Slattery. He made an analogy of a wedding between Governance and Privacy, which is very fitting but also highlights the fact that, a long term marriage with optimum success is based on the foundations that strengthen it with mutual efforts.

We can also take a similar message from the famous quote by Henry Ford – coming together is just the beginning, keeping together is actual progress, and working together is success.

Data analytics should tie its hands with privacy policies for a successful approach towards good business.

So, how can we make this marriage successful?

The GDPR regulation is quite clear on what it states, about things that must be done in order to protect the Data Citizen’s Rights. However, the bigger question most companies are facing is how to comply with regulations and/or go beyond the bare minimum and let GDPR work for them.

Majority of such discussions around the topic of how to implement GDPR today are focussed on one of two approaches – either top down or bottoms up. But we would argue otherwise, as these two approaches are not mutually exclusive and that a successful implementation of the GDPR must be based on a combination of these complementary approaches.

For the top down approach, the team for GDPR will reach out to the businesses to get a clear understanding of all business (data) processes, which involve either one or another. And for each of these processes like for third party credit checks, data analytics, address verification, and much more there are several attributes which must be clarified. Like for instance:

  1. Have they acquired consent for the particular process?
  2. What is the business purpose for the collection?
  3. Who is the controller?
  4. Who is the processor?
  5. Who is responsible as the Data protection officer?
  6. What is the period for retention of data?
  7. What type of data is collected?
  8. Along with several other information

However, it must be noted that this is not a one-time effort, once all the processes related to the personal data have been identified and classified they will still be needed to be maintained as the organization grows and evolves with development in its infrastructure over time.

The bottom up approach is a little more technical in nature. The businesses that have already established metadata management tools can then use these technologies to identify personally the identifiable information (PII) and then try and classify these data elements and assign the relevant attributes for GDPR. This approach shall quickly hit a bottleneck as the same data can be utilized for several business purposes and thus, cannot be classified for GDPR.

With successful implementation of the GDPR we will be able to marry both the approaches well.

Big Data Hadoop training from DexLab Analytics from Dexlab Analytics


Interested in a career in Data Analyst?

To learn more about Machine Learning Using Python and Spark – click here.
To learn more about Data Analyst with Advanced excel course – click here.
To learn more about Data Analyst with SAS Course – click here.
To learn more about Data Analyst with R Course – click here.
To learn more about Big Data Course – click here.

Why Getting a Big Data Certification Will Benefit Your Small Business

Do you know how much data is currently produced globally every year?


As per the reports published by IBM, the figures are 2.5 QB (Quintillion Bytes). The numeric representation of the same looks as: 2,500,000,000,000,000,000. And we thought that our mobile devices with 64GB memory space are capable of storing huge data.


Why Getting a Big Data Certification Will Benefit Your Small Business

Increasing reliance on Big Data

As technology is expanding at the speed next to light, more companies are planning to invest in Big Data platforms for getting the best out of it. Gartner Inc. had conducted a research recently among 437 global organisations across different industries and figured out that more than 75% of them are looking forward to the benefits they can derive from Big Data. The purpose for using Big Data varied to some instance across these organisations, however most of the companies were found to use data analytics for enhancing their customer service segments. Recently, security breach has hit the headline more often than global warming and that has been a factor of worry for many data driven companies. Thus, they are opting for Big Data tools in order to strengthen their online security. Continue reading “Why Getting a Big Data Certification Will Benefit Your Small Business”

High Demand for Data Scientist profiles in LinkedIn

High Demand for Data Scientist profiles in LinkedIn

Currently, Data Science experts are the most sought candidates in the world. According to a research report published by DJ Metrics, the number of ‘Data Scientist’ profiles in LinkedIn has nearly doubled over the last few years. At present, there are more than 11,400 data scientists on the professional networking website, out of which, 52% have added the particular job description (read Data Scientist) during the period between 2012 and 2015.

About the Research

DJ Metrics have taken into account 60,200 LinkedIn profiles of professional experts, while 27,700 records of Educational data and 254,000 records of skills sets were also used to conduct an analysis. Additionally, they have analysed the database of 6200 companies that have provided employment to the Data Scientists. The names of the Companies were collected by analysing the profiles of the Data professionals, since they have listed the names of their employers.

2

Great Career Opportunities

Great Career Opportunities

Researchers are forecasting that there will be a steady rise in the demand for trained Data Scientists, because of the increased adoption of Big Data and Business Intelligence by the leading global companies. High-end business organisations like Microsoft and Facebook are going through a continuous recruitment phase, as these companies had accelerated their hiring process by 151% and 39% respectively in 2014, as compared to what they had done in 2013.

According to the research report, about 65% of the total recruitments were carried out by the following industries:

  • Information Technology and Services, Internet and Computer Software Sector: 9%
  • Education: 3%
  • Banking and Finance: 2%
  • Marketing and Advertising: 2%

Big Data demands Bigger Skills

Big Data demands Bigger Skills

 DJ Metrics has analysed the database of 254,000 skills in order to figure out the growth in the number of skilful Data Science professionals. The results are significant, as apart from the general ‘power’ skills; namely, Data Analysis, Analytics and Data Mining, the top skills found among the vast number of profiles included R, Python, Machine Learning, MATLAB, JAVA, Statistics and SQL. Surprisingly, the Chief Data Scientists are found to have the least technical skills, as only 27% of the profiles had listed Python, while 26% listed R as their technical skill sets. On the other hand, 52% and 53% Junior Data Scientists have listed Python and R, respectively.

Top Recruiters

Top Recruiters

If you see the chart above, you will see that Microsoft and Facebook are the top recruiters over the given period. Surprisingly, Google has not made it to the top 10, although it has recruited quite a number of Data Science professionals. The reason may be that the Data Scientists at Google are called ‘Quantitative Analysts’, which is probably used by their employees while listing their designation on LinkedIn. Since, LinkedIn has researched about the general Data Scientists; they may not have detected the alternate titles.

Countries with highest Data Scientist population

Countries with highest Data Scientist population

Almost 55% of the total Data Scientists in the world are currently located in the United States of America (USA), which makes the top of the list. The second country with maximum numbers of Data Science professionals is United Kingdom (UK), while the third position is occupied by India.  

Are you interested in coveted data science online courses to upgrade your data science skill-set? Look no further than DexLab Analytics. They offer cutting edge Data Science training in Gurgaon for aspiring candidates.


Interested in a career in Data Analyst?

To learn more about Data Analyst with Advanced excel course – Enrol Now.
To learn more about Data Analyst with R Course – Enrol Now.
To learn more about Big Data Course – Enrol Now.

To learn more about Machine Learning Using Python and Spark – Enrol Now.
To learn more about Data Analyst with SAS Course – Enrol Now.
To learn more about Data Analyst with Apache Spark Course – Enrol Now.
To learn more about Data Analyst with Market Risk Analytics and Modelling Course – Enrol Now.

The Best Analytics Tools for Business And How to Make The Most of Them

The Best Analytics Tools for Business And How to Make The Most of Them

All companies are awash with useable data about their customers, prospects and internal business operations as well as suppliers and partners. But most of them are also ill-equipped with the requisite understanding to leverage this streaming flood of data and cannot convert it to actionable insights to increase their revenue by growing their revenue thus, increasing their efficiency. Business intelligence tools are technology that allows businesses to transform their data into actions for generating better business.

The Business Intelligence and analytics industry has been around for decades now and is considered by most analytics personnel as a mature industry. But this BI market is never static with constant evolution and innovation to prepare for meeting the ever expanding needs of businesses of all sizes and from a diverse range of industries. So, it is imperative that people gather an understanding of the different Business Analytics tools for better operation of their companies.

2

Business Intelligence tools can be categorised in three different groups:

  • Guided analysis and reporting
  • Self-service Business Intelligence and Analysis
  • Advanced Analytics

The first category of guided analysis and reporting includes Business Intelligence tools of traditional styles that have long been used for years to perform recurrent data analyses of specified data groups. This system of data analysis was only used for predefined static reporting several years ago, but today it is possible for data analysts to select, compare, visualize and analyse data using various tools and features.

Tool styles in this category include the following:

  • Reports
  • Scorecards and dashboards
  • Spreadsheet integration
  • BI Search
  • Corporate Performance Management

The second category of BI tools which falls under the category of self-service BI and analysis includes the tools BI users utilize to make ad hoc analysis of data. Such analytical practices may be a one-time analysis or building of a recurring analytical system that may with shared by others.

Usually the users of such Bi tools have a dual role to play – consumer of information and producer of analytical systems. They usually share or publish their BI application which they build with the self-service BI tool. The users of such tools will always have the term analyst in their job title. Staff members of the management department may also make use of such tools when they need to perform similar tasks as that of a business analyst, for their peers even if their job title does not imply that.

The Business Intelligence tools include in this category includes the following:

  • Ad hoc analyses and reporting
  • OLAP cubes i.e. online analytical processing
  • Data visualization
  • Data discovery

The third category of advanced analytics includes the tools that a data scientist uses to build predictive and prescriptive models of analysis. These are tools for predictive modelling, statistical modelling and data mining along with rigorous use of big data analytics software. In these cases data analyst spend a huge chunk of their time performing tasks like data ingestion, cleansing and integration.

To understand the full spectrum of different Business Intelligence tool classes here is a visual explanation:

dexlab

Who should invest in BI tools?

For a long time now investment and use of BI tools has been growing gradually regardless of the economic conditions. And it has especially accelerated in the recent times as companies crave for data for better growth and more organized operations. While data analytics tools were mainly associated with large enterprises due to their cost, complexity and demand of high skilled personnel, but those factors have now been grossly transformed as more and more SMBs (small and medium sized businesses) now being significant customers of BI tools and software.

Now that you have a good understanding of the different tool categories and how they should be deployed, the next step for you is to understand your  company specific needs and make the best use of these tools that are optimized for so.


Interested in a career in Data Analyst?

To learn more about Data Analyst with Advanced excel course – Enrol Now.
To learn more about Data Analyst with R Course – Enrol Now.
To learn more about Big Data Course – Enrol Now.

To learn more about Machine Learning Using Python and Spark – Enrol Now.
To learn more about Data Analyst with SAS Course – Enrol Now.
To learn more about Data Analyst with Apache Spark Course – Enrol Now.
To learn more about Data Analyst with Market Risk Analytics and Modelling Course – Enrol Now.

Big Data Hacks: 5 Amazing Free Data Sources

Big data hacks: 5 amazing free data sources

With the data explosion revealing a continuum of numbers and facts and figures across the web and across businesses, it is of no doubt that data is omnipresent. But as the saying goes, sometimes it is hard to see the forest due to all the trees.  A big myth among several companies is that they need to hire data analysts to look for their own data for analysis and to reap the benefits from Big Data analytics. But you must realize that this is far from the truth.

There are more than hundreds in fact even thousands of free data sets available for analysis and use for those who are smart enough to know where to look for them. Here is a list of 5 most popular free data set sources that are widely used globally. There are several more out there for those who are keen enough to look for them.

2

  • Data.gov: in compliance to the promise made by the US government last year all the government data is available for free on the internet in this site. The site is a useful source of information on everything starting from numbers in association to crime to climate change and much more.
  • Socrata: another great place to get scoop on the latest government related data along with some useful visualization tools that come built into the web portal.
  • org another place to access government data for free. One can get access to government data from the US, Canada, EU, CKAN and more.
  • World Health Organization data portal: a place to access all the statistics of hunger, health and disease of the world can be accessed here.
  • FaceBook Graph: FaceBook over the past few years has tightened their security and privacy settings. But there are still some amounts of data open to eyes without any privacy. And FaceBook provides information and access to all this data with their Graph API. While users may not be happy to share them with the world, they probably have not yet figured out how to hide them.

A bonus free data source that could also be fun to explore.

Face.com: get face recognition data with this fascinating tool and analyze possibilities like the creator.

These days a lot of forward thinking companies are trying to data driven, but they may not have ample resources to get their own data right away. So, it may be a good idea to begin with these publicly available free data sources. The best tip for data scientists is to learn to ask the right questions to get the right answers.

For more updates on big data hadoop training, follow DexLab Analytics. They are a premier big data training institution offering intensive career courses.


Interested in a career in Data Analyst?

To learn more about Data Analyst with Advanced excel course – Enrol Now.
To learn more about Data Analyst with R Course – Enrol Now.
To learn more about Big Data Course – Enrol Now.

To learn more about Machine Learning Using Python and Spark – Enrol Now.
To learn more about Data Analyst with SAS Course – Enrol Now.
To learn more about Data Analyst with Apache Spark Course – Enrol Now.
To learn more about Data Analyst with Market Risk Analytics and Modelling Course – Enrol Now.

Call us to know more