Big Data Analytics Archives - Page 2 of 2 - DexLab Analytics | Big Data Hadoop SAS R Analytics Predictive Modeling & Excel VBA

The Relationship between Big Data, Christmas and Santa

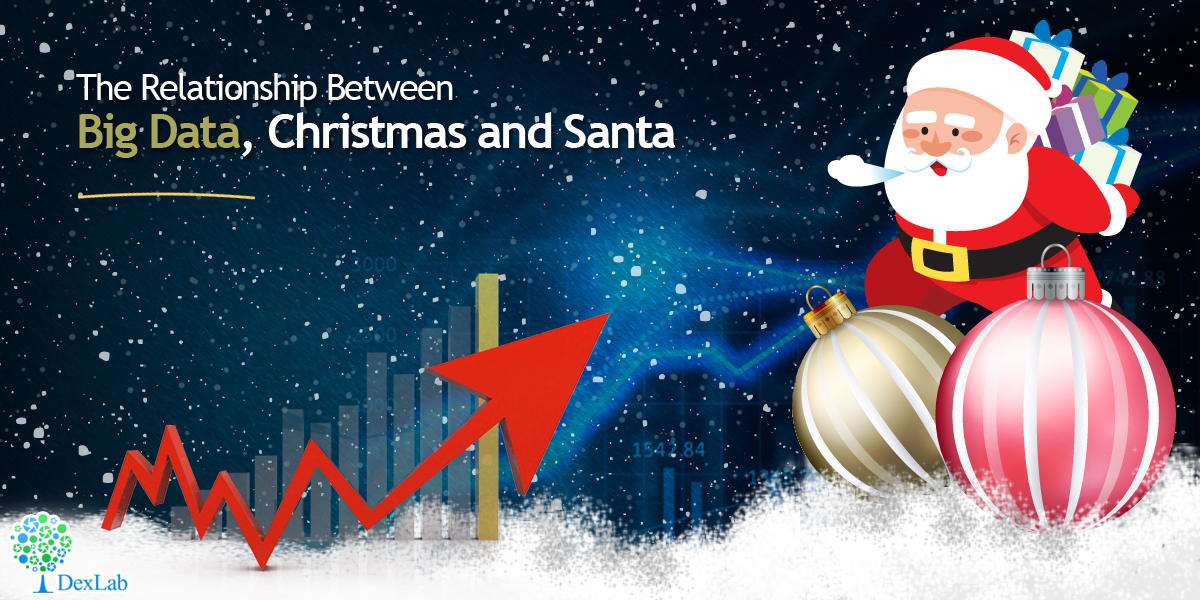
As a Big Data enthusiast, I look forward to data analytics playing a crucial role in the holiday season that is upon us. It is no exaggeration if we state that all sorts of people from CEOs to retailers to consumers will wile away the time crunching numbers this particular December.

The holiday season also is shopping for most consumers as, according to a report, no less than 25% of ecommerce transactions in the UK in last year i.e. 2014 were conducted in November and December. Companies face a transition from sales made from physical locations to those made online from desktops and laptops and mobile devices

The Relationship between Big Data, Christmas and Santa

  • Holiday Customers Lack in Loyalty

Loyalty takes the back seats as more and more buying choices are dictated by the capacity of the wallet. And when you have fifty vendors of repute to choose from while buying an item, the financial motive of savings prevails. Big Data lets businesses know the shopping days when their sales peaks.

All this highlights the need for personalization and how it makes them so much more likely to spend. In fact, according to studies personalization leads to 5 to 8 times increase on the return on investment in marketing and even improves sales by 10%. The report also stated that 56% of consumers made purchase decisions and the final purchase through computers. So, companies need to make the most of the data provided by companies like TIBC Spotfire and ShopperTrak.

  • Using Data in December

But the first question that comes to the mind about the use of Big Data during the period that shopaholics are at the peak of their activities, is why does it remain so underutilized. Tableau conducted a study that found that no less than 24% of all retailers based in the UK do not make effective use of data when the shopping season reaches its peak.

  • Use of Data by Consumers

Consumers also stand to gain when using it for the purposes of making purchase decisions. To cite a great example, we may consider the case of the WatsonTrend app. It analyzes data from ratings, comments, use of social media, reviews and other sources of data available on the net. The lists of the app are updated on a regular basis. The data and algorithms form the backbone of the app which may serve as real time shopping guides and even future trends may be predicted.

So, this Christmas shower you near and dear ones with gifts as enlightened consumers, Merry Christmas!

Delimiters And Delimited Data in SAS

In this blog post we will delve into the world of delimiters as found in the SAS system of data analysis tools. Delimiters are an essential part of SAS without whose guidance SAS would be in some blind inspite of all the data that surrounds it as the data supplied to it either internally or as an external file.


sas courses

What are Delimiters?

Delimiters are essentially symbols to SAS that lets SAS know that the data is separate. They distinguish one set or category of data from others. This should give you an idea about how essential a part of data analytics, a delimiter plays.

How are the Delimiters Symbolized?

SAS accepts the following symbols and key strokes as delimiters:

  •  ,
  •  :
  • Tab
  •  ~
  • &
  •  –

How to Import Delimited Data?

This command imports data infile

Data claim_data;

infile datalines dlm = “,”;

Input sex $ name $ claim_amount ; datalines;

Male,Mahesh,15000

Male,Naveen,10000

Female,Neeta,18000

Male,Amit,7500

Female,Geeta,12000

;

run;

data claim_data ;

Infile E:\Project FT\SAS\Course Material\Class 1\Claim Data comma.txt’ dlm = “,”;

Input sex $ name $ claim_amount ;

Run;

What are the Functions of Delimiters?

An INFILE option, the DSD or delimiter-sensitive data serves varied functions. They are as follows:

  • The default delimiters are changed to wanted ones from the default blank.
  • In case a row contains two delimiters, SAS interprets that there is an instance of a case of missing value.
  •  Delimiters also strip the quotes within which character values are placed.

So the command would boil down to:

data claim_data ;

Infile E:\Project FT\SAS\Course Material\Class 1\Claim Data comma.txt’ dsd;

Input sex $ name $ claim_amount ;

Run

How to Read Data from an External CSV file?

Our next task is to read data from external CSV files. In order to do so we have to input the following:

proc import datafile = “E:\Project FT\SAS\Course Material\Class 1\exam_results.csv”

dbms = csv replace out = class_10_result; Getnames = yes; run;

In a Nutshell

What are Format, Informat and DSD?

  • Informat : This command instructs SAS how exactly to going about reading the data.
  • Format : This instructs SAS about the exact way in which to show the details.
  • DSD : This defines how data is separated by a delimiter.

Hadoop adopted, but not for Analytics?

In this era of Big Data, where we are dealing with wide variety of data having features like velocity,volume, veracity and unstructured data coming in from different sources in different formats like xml, logs, videos, images both structured and unstructured.

Everyone is talking about Hadoop’s capabilities in Big Data Analytics, fact is Hadoop is mostly being adopted for low cost Data Storage and ETL.

Hadoop_Analytics

Continue reading “Hadoop adopted, but not for Analytics?”

Call us to know more