best sas analytics training delhi Archives - DexLab Analytics | Big Data Hadoop SAS R Analytics Predictive Modeling & Excel VBA

Refugee Migration: How Predictive Analytics Coupled with Big Data is Developing Urgent Solutions for Countless Refugees?

Refugee Migration: How Predictive Analytics Coupled with Big Data is Developing Urgent Solutions for Countless Refugees?

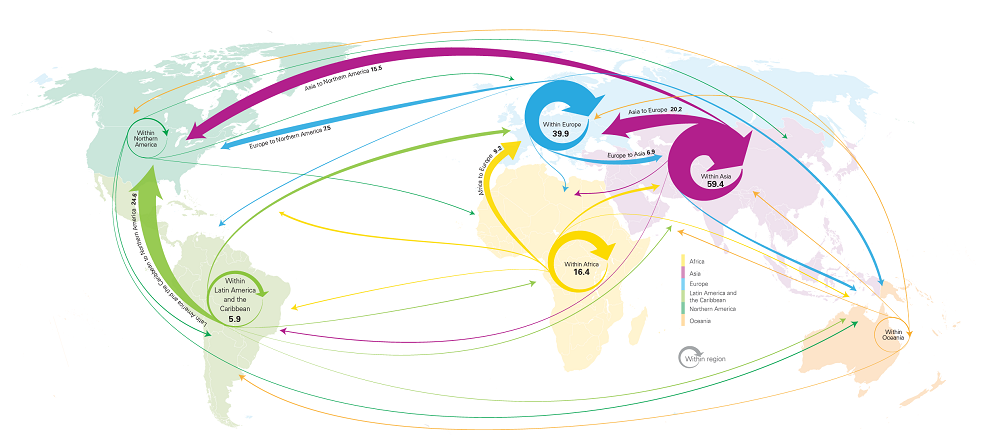
In total, 65 million people are currently displaced or live refugees – owing to the Syrian Civil War. Each day, thousands of refugees are fleeing their homes and seeking asylums in foreign countries. Many countries have opened their borders, countless UN agencies have come forward to help and handle the ongoing global crisis – but how bad is the current situation? What are the chances of working out a satisfactory solution?

2

Predictive Analytics is the key. It’s a raw form of statistical science that mines through available data for future prediction of outcomes. Though we agree to the potentials of predictive analytics, we can’t turn a blind eye to the political and financial roadblocks it poses in front of us, which keeps us from addressing the current crisis with same gusto.

For excellent SAS predictive modeling training, DexLab Analytics is your go-to learning destination in Gurgaon

The Power of Prediction

Past data helps! They help the algorithms to anticipate the challenges even before they arise. Also migration data… gathered from a plethora of sources, including World Bank data, population censuses, sample surveys, population registers, and other administrative sources. Such treasure troves of data could be groundbreaking, especially for representatives working on forefront of the ongoing crisis. Armed with meaningful data, officials using advanced analytics could chart out most likely locations, where the refugees are about to head next. Spotting the possible signs of influx, government and respective policymakers might reroute the refugees to different locations, where better assistance is possible and expected. This kind of real-time data helps respectable authorities to transfer money and goods to locales that need them the most.

Nevertheless, predictions are not always on-point or don’t lead to the best guesses, all the time, yet in many cases, refugees could benefit – remember refugee crisis is not only a serious humanitarian crisis but also a development issue for countries that accept the asylum seekers. Thus, the authorities should refrain from bottling up hundreds and thousands of refugees from bottling them up in overcrowded camps, without food, water and other basic amenities. And for that, they need adequate data, which could help them make the best possible decision in such situations of distress.

A Hope in Sight

Technical challenges are soaring; if the world is resilient to solve the ongoing international crisis, predictive analytics has to be embraced, but make sure you give adequate importance to data security. Accidental data breaches and releases are happening all around, which could result in triggering targeted violence in specific, highly-populated, vulnerable areas.

Addressing the growing concern, hefty financial investment is the best play. Several private players and multinational organizations, including UN till now have given undue attention but devoted limited resources to tackle the challenge. That needs to be changed now. And fortunately, change is in motion; recently two key players in the humanitarian aid and development area of work signed a partnership to formulate innovative solutions for refugee crisis using far-reaching claws of big data and technology. The striking partnership between the World Bank and United Nations Refugee Agency is the first stepping stone towards improving the quality of data about refugees, prompting an improved smarter assistance for refugees across the globe.
No longer are such initiatives a distant concept; the phenomenal rise of big data hadoop and predictive analytics technology has stepped up the quality and speed of data resulting in tailor-made sophisticated assistance, perfect for refugee crisis. In a nutshell, the new dimension is going to make a lot of difference, and technology is going to be a game-changer in this.

For more interesting blogs and data-related stuffs, follow us on DexLab Analytics. We are a leading SAS Predictive Modelling training institute in Delhi offering high-in demand certification courses. Reach us today!


The blog has been sourced from 

sisense.com/blog/refugee-migration-where-are-people-fleeing-from-and-where-are-they-going

mashable.com/2018/04/24/big-data-refugees/#8md_gh7p2iqr

theconversation.com/millions-of-refugees-could-benefit-from-big-data-but-were-not-using-it-86286


Interested in a career in Data Analyst?

To learn more about Data Analyst with Advanced excel course – Enrol Now.
To learn more about Data Analyst with R Course – Enrol Now.
To learn more about Big Data Course – Enrol Now.

To learn more about Machine Learning Using Python and Spark – Enrol Now.
To learn more about Data Analyst with SAS Course – Enrol Now.
To learn more about Data Analyst with Apache Spark Course – Enrol Now.
To learn more about Data Analyst with Market Risk Analytics and Modelling Course – Enrol Now.

Wake Up to a World of Data Possibilities: With SAS Certification

Of late, in spite of trending insurgence of cutting edge technology tools, SAS remains one of the most popular, in-demand programming languages for advanced analytics. It’s been more than two decades, yet it didn’t lose its importance in ruling the data science market. This shows how flexible this pioneering analytics tool is, and how adaptable it is in its functionality that it stood strong through the test of time and development.

 
Wake Up to a World of Data Possibilities: With SAS Certification

Possess the Right SAS Skills, Be In Demand

Organizations are utilizing the perks of advanced analytics inside out. They are realizing that not only big data analytics has secured a niche area of concentration for itself, but it has strived to be an indispensable part of any organization that is on its walk to success.

Continue reading “Wake Up to a World of Data Possibilities: With SAS Certification”

How Many Category 5 Hurricanes Have We Had in the Atlantic?

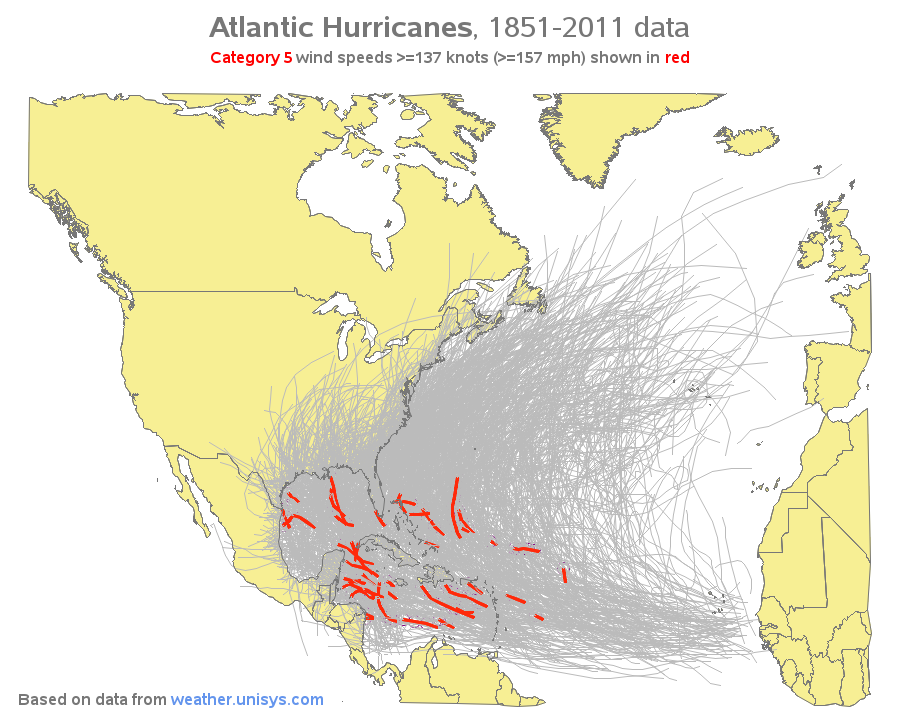
With Hurricane Irma battering the pretty state of Florida while ripping through the Caribbean like a mammoth buzzsaw blade, we start wondering how often such rare Category 5 hurricanes occur. We know hurricanes of such magnitude are rare, but how much rare?

According to Wikipedia page information, hurricanes having wind speed greater than or equal to 157 mph are termed as category 5 hurricanes, enough to wreak havoc around. Using SAS Analytics, let’s start digging some data to unravel how many hurricanes of such great magnitude have hit the Atlantic coastal towns and cities with such dangerous wind speeds..

After indulging in a bit of research work, we came across weather.unisys.com website that contains exhaustive data about all the past hurricanes formed out of Atlantic. It turned out to be a good repository of data – we jotted down a bit of code and parsed the data into SAS data set. Next, we marked all the Atlantic hurricane paths on a map, and highlighted the line segments in bright red, where the wind speed fell under the Category 5 tab. So, come know how often they have taken place, along with their accurate position.

sas certification

Hit the above image to view the full-size interactive version of the map with HTML mouse-over text displaying the hurricane names in red for category 5 descriptions.

Take a look at the technical details of the code we used to draw the map:

  1. The map is created using SAS/Graph Proc GMap.
  2. We projected the map with the help of Proc GProject. Followed to that, we saved the projection parameters using the brand new Parmout=option. It was only then that we can project the hurricane paths individually, using GProject’s parmin=option. (Before the innovation of parmout/parmin parameters, we used to combine the map and hurricane paths, compile and project them together, and then divide the results into two separate datasets – of course the new functionality eases the things out).
  3. The paths of hurricane were plotted using regular ‘move’ and ‘draw’ Annotate functions.
  4. We first plotted the land areas (choropleth map), then covered (annotated) the hurricane tracks (while doing so, make sure the red lines lie on top for better visibility), and finally overlaid the country border contours on top again so as to make them prominent.
  5. As lines are incompatible with mouse-over text, we annotated circles using mouse-over text along the red hurricane paths. We outlined these circles at the very beginning (using when=’b’), hence they would become invisible later.

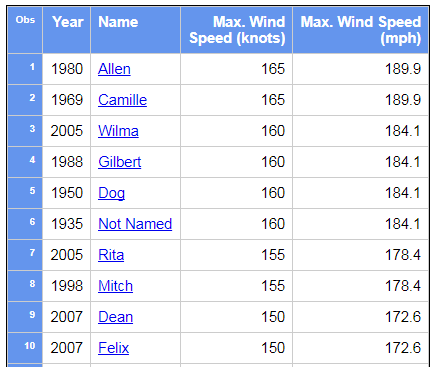
Have a look at the table we presented below. The table comprises of 34 Category 5 Atlantic hurricanes, derived from 150 years of data. You can also run your eyes through a snapshot image – click on the image to see the entire interactive table. And if you are interested in knowing more, hit each hurricane name and ask Google to give you information.

sas training institute

Nota Bene: There might be some hurricanes under Category 5 domain we missed out. Kindly excuse us there, but we think we have nicely hit our main point of discussion. If you have anything to say us, scroll down and comment!

DexLab Analytics is reckoned to be the best SAS analytics training in Pune. The courses are a collaboration of intensive subject matter research and industry experts’ relentless dedication towards their students. For state-of-the-art SAS training courses in Pune, drop by DexLab Analytics.

Interested in a career in Data Analyst?

To learn more about Machine Learning Using Python and Spark – click here.
To learn more about Data Analyst with Advanced excel course – click here.
To learn more about Data Analyst with SAS Course – click here.
To learn more about Data Analyst with R Course – click here.
To learn more about Big Data Course – click here.

What is Truly Efficient? Understanding Stratified Random Sample

What is Truly Efficient?  Understanding Stratified Random Sample:

We have discussed several times the efficiency of various techniques for selecting a simple random sample from an expansive dataset. With PROC SURVEYSELECT will do the job easily…


proc surveyselect data=large out=sample
	 method=srs   /* simple random sample */
	 rate=.01;   /* 1% sample rate       */
run;


However, let us assume that our data includes a STATE variable, and one would want to guarantee that a random sample includes the precise proportion of observations from each of the states of America.

Continue reading “What is Truly Efficient? Understanding Stratified Random Sample”

Call us to know more