best python training institute in gurgaon Archives - DexLab Analytics | Big Data Hadoop SAS R Analytics Predictive Modeling & Excel VBA

Autocorrelation- Time Series – Part 3

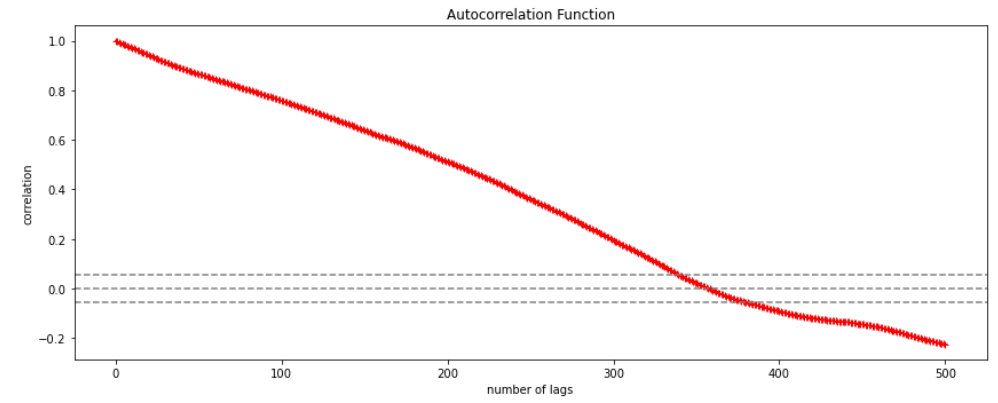
Autocorrelation is a special case of correlation. It refers to the relationship between successive values of the same variables .For example if an individual with a consumption pattern:-

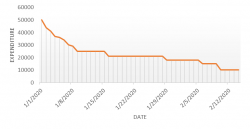
spends too much in period 1 then he will try to compensate that in period 2 by spending less than usual. This would mean that Ut is correlated with Ut+1 . If it is plotted the graph will appear as follows :

Positive Autocorrelation : When the previous year’s error effects the current year’s error in such a way that when a graph is plotted the line moves in the upward direction or when the error of the time t-1 carries over into a positive error in the following period it is called a positive autocorrelation.
Negative Autocorrelation : When the previous year’s error effects the current year’s error in such a way that when a graph is plotted the line moves in the downward direction or when the error of the time t-1 carries over into a negative error in the following period it is called a negative autocorrelation.

Now there are two ways of detecting the presence of autocorrelation
By plotting a scatter plot of the estimated residual (ei) against one another i.e. present value of residuals are plotted against its own past value.

If most of the points fall in the 1st and the 3rd quadrants , autocorrelation will be positive since the products are positive.

If most of the points fall in the 2nd and 4th quadrant , the autocorrelation will be negative, because the products are negative.
By plotting ei against time : The successive values of ei are plotted against time would indicate the possible presence of autocorrelation .If e’s in successive time show a regular time pattern, then there is autocorrelation in the function. The autocorrelation is said to be negative if successive values of ei changes sign frequently.
First Order of Autocorrelation (AR-1)
When t-1 time period’s error affects the error of time period t (current time period), then it is called first order of autocorrelation.
AR-1 coefficient p takes values between +1 and -1
The size of this coefficient p determines the strength of autocorrelation.
A positive value of p indicates a positive autocorrelation.
A negative value of p indicates a negative autocorrelation
In case if p = 0, then this indicates there is no autocorrelation.
To explain the error term in any particular period t, we use the following formula:-

Where Vt= a random term which fulfills all the usual assumptions of OLS
How to find the value of p?

One can estimate the value of ρ by applying the following formula :-
Time Series Analysis Part I


A time series is a sequence of numerical data in which each item is associated with a particular instant in time. Many sets of data appear as time series: a monthly sequence of the quantity of goods shipped from a factory, a weekly series of the number of road accidents, daily rainfall amounts, hourly observations made on the yield of a chemical process, and so on. Examples of time series abound in such fields as economics, business, engineering, the natural sciences (especially geophysics and meteorology), and the social sciences.

  • Univariate time series analysis- When we have a single sequence of data observed over time then it is called univariate time series analysis.
  • Multivariate time series analysis – When we have several sets of data for the same sequence of time periods to observe then it is called multivariate time series analysis.

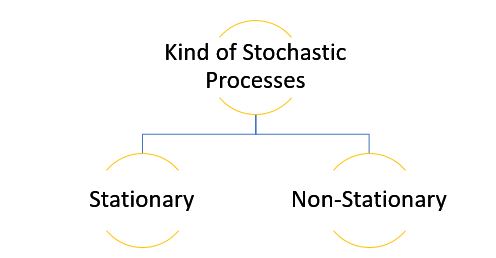
The data used in time series analysis is a random variable (Yt) where t is denoted as time and such a collection of random variables ordered in time is called random or stochastic process.

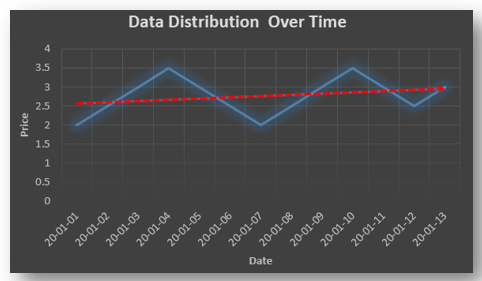
Stationary: A time series is said to be stationary when all the moments of its probability distribution i.e. mean, variance , covariance etc. are invariant over time. It becomes quite easy forecast data in this kind of situation as the hidden patterns are recognizable which make predictions easy.

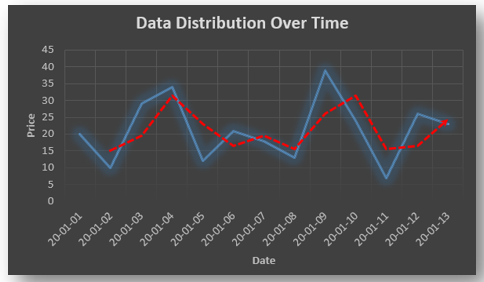
Non-stationary: A non-stationary time series will have a time varying mean or time varying variance or both, which makes it impossible to generalize the time series over other time periods.

Non stationary processes can further be explained with the help of a term called Random walk models. This term or theory usually is used in stock market which assumes that stock prices are independent of each other over time. Now there are two types of random walks:
Random walk with drift : When the observation that is to be predicted at a time ‘t’ is equal to last period’s value plus a constant or a drift (α) and the residual term (ε). It can be written as
Yt= α + Yt-1 + εt
The equation shows that Yt drifts upwards or downwards depending upon α being positive or negative and the mean and the variance also increases over time.
Random walk without drift: The random walk without a drift model observes that the values to be predicted at time ‘t’ is equal to last past period’s value plus a random shock.
Yt= Yt-1 + εt
Consider that the effect in one unit shock then the process started at some time 0 with a value of Y0
When t=1
Y1= Y0 + ε1
When t=2
Y2= Y1+ ε2= Y0 + ε1+ ε2
In general,
Yt= Y0+∑ εt
In this case as t increases the variance increases indefinitely whereas the mean value of Y is equal to its initial or starting value. Therefore the random walk model without drift is a non-stationary process.

So, with that we come to the end of the discussion on the Time Series. Hopefully it helped you understand time Series, for more information you can also watch the video tutorial attached down this blog. DexLab Analytics offers machine learning courses in delhi. To keep on learning more, follow DexLab Analytics blog.


.

What Is The Role Of Big Data In The Pharmaceutical Industry?

What Is The Role Of Big Data In The Pharmaceutical Industry?

Big data is currently trending in almost all sectors as now the awareness of the hidden potential of data is on the rise. The pharmaceutical industry is a warehouse of valuable data that is constantly piling up for years and which if processed could unlock information that holds the key to the next level of innovation and help the industry save a significant amount of money in the process as well. Be it making the clinical trial process more efficient or, ensuring the safety of the patients, big data holds the clue to every issue bothering the industry. The industry has a big need for professionals who have Data science using Python training, because only they can handle the massive amount of data and channelize the information to steer the industry in the right direction.

We are here taking a look at different ways data is influencing the pharmaceutical industry.

Efficient clinical-trial procedure

Clinical trial holds so much importance as the effectiveness of a drug or, a procedure on a select group of patients is tested. The process involves many stages of testing and it could be time-consuming and not to mention the high level of risk factors involved in the process. The trials often go through delays that result in money loss and there is risk involved too as side effects of a specific drug or a component can be life-threatening. However, big data can help in so many ways here, to begin with, it could help filtering patients by analyzing several factors like genetics and select the ones who are eligible for the trials. Furthermore, the patients who are participating in clinical trials could also be monitored in real-time. Even the possible side effects could also be predicted and in turn, would save lives.

Successful sales and marketing efforts

The pharmaceutical industry can see a great difference in marketing efforts if only they use data-driven insight. Analyzing the data the companies could identify the locations and physicians ideal for the promotion of their new drug. They can also identify the needs of the patients and could target their sales representative teams towards that location. This would take the guesswork out of the process and increase the chance of getting a higher ROI. The data can also help them predict market trends as well as understand customer behavior. Another factor to consider here is monitoring the market response to a particular drug and also its performance, as this would help fine-tune marketing strategies.

Collaborative efforts

With the help of data, there could be better collaboration among the different segments that directly impact the industry. The companies could suggest different drugs that could be patient-specific and the physicians could use real-time patient data to decide whether the suggestions should be implemented in the treatment plan. There could be internal and external collaborations as well to improve the overall industry functioning. Be it reaching out to researchers or, CROs, establishing a strong link can help the industry move further.

Predictive analysis

A new drug might be effective in handling a particular health issue and could revolutionize the treatment procedure but, the presence of certain compounds might prove to be fatal for certain patients and drug toxicity if not detected at an early stage could endanger a particular patient. So, using predictive analysis a patient data could be analyzed to determine the genetic factors, disease history, as well as lifestyle. The smart algorithms thereby help identify the risk factors and makes it possible to take a personalized approach regarding medication that could prove to be more effective rather than some random medication.

Big data can increase the efficiency of the pharmaceutical industry in more ways than one, but compared to other industries somehow this industry still hasn’t been able to utilize the full potential of big data, due to factors like privacy and, monetary issues. The lack of trained professionals could also prove to be a big obstacle. Sending their select professionals for Data Science training, could prove to be a big boon for them in the future.


.

Top 4 Python Industrial Use-Cases: Explained

Top 4 Python Industrial Use-Cases: Explained

Dexlab ____ YOutube subscriber

Python is one of the fastest-growing and most popular coding languages in the world; a large number of developers use it on daily basis and why not, it works brilliantly for a plethora of developer job roles and data science positions – starting from scripting solution for sysadmins to supporting machine learning algorithms to fueling web development, Python can work wonders across myriad platforms!

Below, we’ve rounded up 4 amazing Python industrial use-cases; scroll ahead:

Insurance

Widely used in generating business insights; courtesy machine learning.

Case Study:

Smaller firms driven by machine learning gave stiff competition to a US multinational finance and insurance corporation. In return, the insurer formed teams and devised a new set of services and applications based on ML algorithms to enjoy a competitive edge. However, the challenge was that with so many data science tools, numerous versions of Python came into the picture and gave rise to compatibility issues. As a result, the company finalized only one version of Python, which was then used in line with machine learning algorithms and tools to derive specific results.

Data Science Machine Learning Certification

Finance

Data mining helps determine cross-sell opportunities.

Case Study:

Another US MNC dealing in financial services showed interest in mining complex customer behavioral data. Using Python, the company launched a series of ML and data science initiatives to dig into its structured data that it has been gathering for years and correlated it with an army of unstructured data, gathered from social media and web to enhance cross-selling and retrieve resources.

Aerospace

Python helps in meeting system deadlines and ensured utmost confidentiality.

Case Study:

Recently, the International Space Station struck a deal with an American MNC dealing in military, defense and aerospace technology; the latter has been asked to provide a series of systems to the ISS. The critical safety systems were mostly written in languages, like Ada; they didn’t fare well in terms of scripting tasks, data science analysis or GUI creation. That’s why Python was chosen; it offered bigger contract value and minimum exposure.

Retail Banking

Enjoy flexible data manipulation and transformation – all with Python!

Case Study:

A top-notch US department store chain equipped with an in-store banking division gathered data and stored it in a warehouse. The main aim of the company was to share the information with multiple platforms to fulfill its supply chain, analytics, retail banking and reporting needs. Though the company chose Python for on-point data manipulation, each division came up with their own versions of Python, resulting in a new array of issues. In the end, the company decided to keep a standard Python; this initiative not only resulted in amplifying engineering speed but also reduced support costs.

As end notes, Python is the next go-to language and is growing each day. If you have dreams of becoming an aspiring programmer, you need to book the best Python Certification Training in Delhi. DexLab Analytics is a premier Python training institute in Delhi; besides Python, it offers in-demand skill development courses for interested candidates.


The blog has been sourced from www.techrepublic.com/article/python-5-use-cases-for-programmers


Interested in a career in Data Analyst?

To learn more about Data Analyst with Advanced excel course – Enrol Now.
To learn more about Data Analyst with R Course – Enrol Now.
To learn more about Big Data Course – Enrol Now.

To learn more about Machine Learning Using Python and Spark – Enrol Now.
To learn more about Data Analyst with SAS Course – Enrol Now.
To learn more about Data Analyst with Apache Spark Course – Enrol Now.
To learn more about Data Analyst with Market Risk Analytics and Modelling Course – Enrol Now.

Python Language for Embedded Applications

Python Language for Embedded Applications

Python is the need of the hour – not only for fueling websites but also for embedded applications.

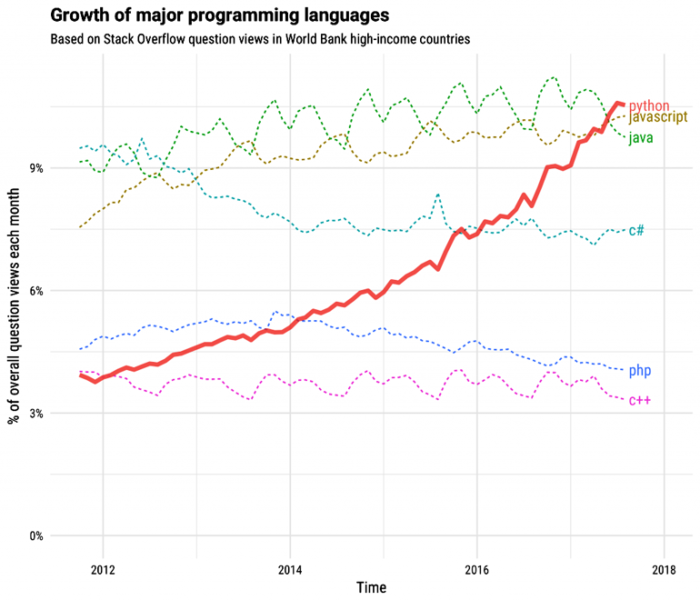
Though C and C++ are still dominant programming languages for embedded applications, new age competitors, such as Python and Javascript are fast picking up pace. Especially Python: it’s gaining accolades for driving websites and Stack Overflow’s recent research has showcased the steady increase of popularity.

In terms of machine learning, Python is nowadays used with recommended platforms, such as TensorFlow and Caffe. It’s even used for fortifying neural networks.

The reason for such spiking popularity is it’s easy to download attribute – open source Python programming language can be downloaded for diverse platforms, including Windows and Linux. Moreover, several integrated development environments (IDEs) already exists for Python; some of the popular multiplatform tools are Microsoft’s Visual Studio and Eclipse (PyDev).

On the other hand, Python is reckoned as an embedded scripting language by wide motley of technical experts and consultants. Autodesk’s 3D animation program, Maya is programmed using Python. Similarly, Blender is also run on Python.

VDC Research highlighted spiked up interest in Python in IoT devices, “The embedded engineering community is embracing the use of scripting languages,” shares Chris Rommel, EVP of IoT & Embedded Technology research at VDC. “What began primarily isolated as a tool in the QA domain has quickly expanded within the software development ranks, with Python, in particular, showing incredible growth in the past few years,” he further adds.

For Python Course in Delhi NCR, DexLab Analytics is the go-to destination.

Python Graphics and User Interfaces

Python is loaded with a multitude of user-interface and graphics options. Developers, newbie and seasoned take advantage of Matplotlib: it’s a 2-D plotting library that offers a MATLAB-inspired interface. An open source KIVY framework is also used extensively. It can be run on a versatile range of platforms, such as Android,Linux, iOS, Windows, OS X, and the Raspberry Pi.

Qt is another very effective user-interface framework that’s high on popularity drive for over 25 years. Javascript, C++ and Python, all of them have relied on Qt for good. It specializes in handling graphics and different other multimedia formats as well as cameras and radios.

The Rise of Pythons for Embedded Systems

Python opens a world of opportunity, including providing support to numerous programming platforms and readable and manageable code. It eradicates the need to use brackets common to languages, such as C++, C and Java. Along with that, it enables an independent, interactive test-driven development approach.

All this sounds too alluring, isn’t it?

But wait, like all programming languages, Python too is bogged down by a few technical glitches. Running the application can sometimes become a bit tricky. Also, at times, Python may not be the perfect language for all embedded applications. Nevertheless, we cannot ignore the perks it ensures us: the benefits we derive from its dynamic nature, simplistic functions, flexibility and widespread support is incredible.

Data Science Machine Learning Certification

Of late, Python Data Science course in India is becoming increasingly popular. Join the bandwagon and get Python certified today!


The blog has been sourced from:

www.electronicdesign.com/embedded-revolution/python-s-big-push-embedded-space


Interested in a career in Data Analyst?

To learn more about Data Analyst with Advanced excel course – Enrol Now.
To learn more about Data Analyst with R Course – Enrol Now.
To learn more about Big Data Course – Enrol Now.

To learn more about Machine Learning Using Python and Spark – Enrol Now.
To learn more about Data Analyst with SAS Course – Enrol Now.
To learn more about Data Analyst with Apache Spark Course – Enrol Now.
To learn more about Data Analyst with Market Risk Analytics and Modelling Course – Enrol Now.

Call us to know more