Autocorrelation is a special case of correlation. It refers to the relationship between successive values of the same variables .For example if an individual with a consumption pattern:-
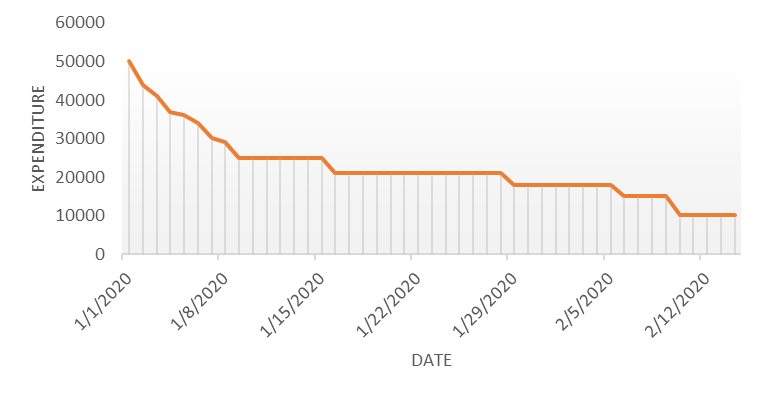
spends too much in period 1 then he will try to compensate that in period 2 by spending less than usual. This would mean that Ut is correlated with Ut+1 . If it is plotted the graph will appear as follows :
Positive Autocorrelation : When the previous year’s error effects the current year’s error in such a way that when a graph is plotted the line moves in the upward direction or when the error of the time t-1 carries over into a positive error in the following period it is called a positive autocorrelation. Negative Autocorrelation : When the previous year’s error effects the current year’s error in such a way that when a graph is plotted the line moves in the downward direction or when the error of the time t-1 carries over into a negative error in the following period it is called a negative autocorrelation.
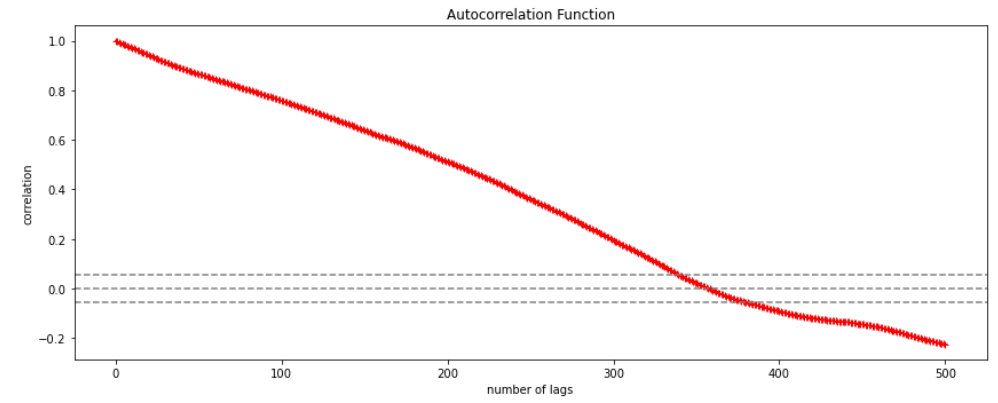
Now there are two ways of detecting the presence of autocorrelation By plotting a scatter plot of the estimated residual (ei) against one another i.e. present value of residuals are plotted against its own past value.
If most of the points fall in the 1st and the 3rd quadrants , autocorrelation will be positive since the products are positive.
If most of the points fall in the 2nd and 4th quadrant , the autocorrelation will be negative, because the products are negative. By plotting ei against time : The successive values of ei are plotted against time would indicate the possible presence of autocorrelation .If e’s in successive time show a regular time pattern, then there is autocorrelation in the function. The autocorrelation is said to be negative if successive values of ei changes sign frequently. First Order of Autocorrelation (AR-1) When t-1 time period’s error affects the error of time period t (current time period), then it is called first order of autocorrelation. AR-1 coefficient p takes values between +1 and -1 The size of this coefficient p determines the strength of autocorrelation. A positive value of p indicates a positive autocorrelation. A negative value of p indicates a negative autocorrelation In case if p = 0, then this indicates there is no autocorrelation. To explain the error term in any particular period t, we use the following formula:-
Where Vt= a random term which fulfills all the usual assumptions of OLS How to find the value of p?
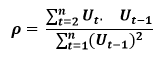
One can estimate the value of ρ by applying the following formula :-
A time series is a sequence of numerical data in which each item is associated with a particular instant in time. Many sets of data appear as time series: a monthly sequence of the quantity of goods shipped from a factory, a weekly series of the number of road accidents, daily rainfall amounts, hourly observations made on the yield of a chemical process, and so on. Examples of time series abound in such fields as economics, business, engineering, the natural sciences (especially geophysics and meteorology), and the social sciences.
Univariate time series analysis- When we have a single sequence of data observed over time then it is called univariate time series analysis.
Multivariate time series analysis – When we have several sets of data for the same sequence of time periods to observe then it is called multivariate time series analysis.
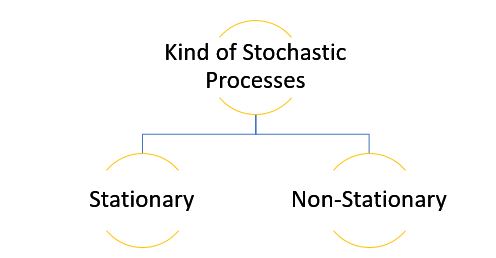
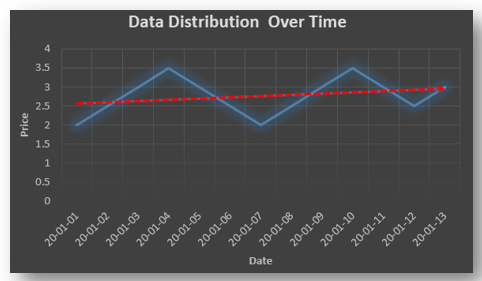
The data used in time series analysis is a random variable (Yt) where t is denoted as time and such a collection of random variables ordered in time is called random or stochastic process.
Stationary: A time series is said to be stationary when all the moments of its probability distribution i.e. mean, variance , covariance etc. are invariant over time. It becomes quite easy forecast data in this kind of situation as the hidden patterns are recognizable which make predictions easy.
Non-stationary: A non-stationary time series will have a time varying mean or time varying variance or both, which makes it impossible to generalize the time series over other time periods.
Non stationary processes can further be explained with the help of a term called Random walk models. This term or theory usually is used in stock market which assumes that stock prices are independent of each other over time. Now there are two types of random walks: Random walk with drift : When the observation that is to be predicted at a time ‘t’ is equal to last period’s value plus a constant or a drift (α) and the residual term (ε). It can be written as Yt= α + Yt-1 + εt The equation shows that Yt drifts upwards or downwards depending upon α being positive or negative and the mean and the variance also increases over time. Random walk without drift: The random walk without a drift model observes that the values to be predicted at time ‘t’ is equal to last past period’s value plus a random shock. Yt= Yt-1 + εt Consider that the effect in one unit shock then the process started at some time 0 with a value of Y0 When t=1 Y1= Y0 + ε1 When t=2 Y2= Y1+ ε2= Y0 + ε1+ ε2 In general, Yt= Y0+∑ εt In this case as t increases the variance increases indefinitely whereas the mean value of Y is equal to its initial or starting value. Therefore the random walk model without drift is a non-stationary process.
So, with that we come to the end of the discussion on the Time Series. Hopefully it helped you understand time Series, for more information you can also watch the video tutorial attached down this blog. DexLab Analytics offers machine learning courses in delhi. To keep on learning more, follow DexLab Analytics blog.
Big data is certainly is getting a lot of hype and for good reasons. Different sectors ranging from business to healthcare are intent on harnessing the power of data to find solutions to their most imminent problems. Huge investments are being made to build models, but, there are some niggling issues that are not being resolved.
So what are the big challenges the data science industry is facing?
Managing big data
Thanks to the explosion of information now the amount of data being created every year is adding to the already overstocked pile, and, most of the data we are talking about here is unstructured data. So, handling such a massive amount of raw data that is not even in a particular database is a big challenge that could only be overcome by implementing advanced tools.
Lack of skilled personnel
One of the biggest challenges the data science industry has to deal with is the shortage of skilled professionals that are well equipped with Data Science training. The companies need somebody with specific training to manage and process the datasets and present them with the insight which they can channelize to develop business strategies. Sending employees to a Data analyst training institute can help companies address the issue and they could also consider making additional efforts for retaining employees by offering them a higher remuneration.
Communication gap
One of the challenges that stand in the way, is the lack of understanding on the part of the data scientists involved in a project. They are in charge of sorting, cleaning, and processing data, but before they take up the responsibility they need to understand what is the goal that they are working towards. When they are working for a business organization they need to know what the set business objective is, before they start looking for patterns and build models.
Data integration
When we are talking about big data, we mean data pouring from various sources. The myriad sources could range from emails, documents, social media, and whatnot. In order to process, all of this data need to be combined, which can be a mammoth task in itself. Despite there being data integration tools available, the problem still persists. Investment in developing smarter tools is the biggest requirement now.
Data security
Just the way integrating data coming from different sources is a big problem, likewise maintaining data security is another big challenge especially when interconnectivity among data sources exists. This poses a big risk and renders the data vulnerable to hacking. In the light of this problem, procuring permission for utilizing data from a source becomes a big issue. The solution lies in developing advanced machine learning algorithms to keep the hackers at bay.
Data validity
Gaining insight from data processing could only be possible when that data is free from any sort of error. However, sometimes data hailing from different sources could show disparity regardless of being about the same subject. Especially in healthcare, for example, patient data when coming from two different sources could often show dissimilarity. This poses a serious challenge and it could be considered an extension of the data integration issue. Advanced technology coupled with the right policy changes need to be in place to address this issue, otherwise, it would continue to be a roadblock.
The challenges are there, but, recognizing those is as essential as continuing research work to finding solutions. Institutes are investing money in developing data science tools that could smoothen the process by eliminating the hurdles. Accessing big data courses in delhi, is a good way to build a promising career in the field of data science, because despite there being challenges the field is full big opportunities.
The term big data refers to the massive amount of data being generated from various sources that need to be sorted, processed, and analyzed using advanced data science tools to derive valuable insight for different industries. Now, big data comprises structured, semi-structured, and mostly unstructured data. Processing this huge data takes skill and expertise and which only someone with Data Science training would be able to do.
The concept of big data is relatively new and it started emerging post the arrival of internet closely followed by the proliferation of advanced mobile devices, social media platforms, IoT devices, and all other myriad platforms that are the breeding grounds of user-generated data. Managing and storing this data which could be in text, audio, image formats is essential for not just businesses but, for other sectors as well. The information data holds can help in the decision-making process and enable people to understand the vital aspects of an issue better.
The characteristics of big data
Now, any data cannot be classified as big data, there are certain characteristics that define big data and getting in-depth knowledge regarding these characteristics can help you grasp the concept of big data better. The main characteristics of big data could be broken down into 5Vs.
What are the 5Vs of data?
The 5Vs of data basically refers to the core elements of big data, the presence of which acts as a differentiating factor. Although many argue in favor of the essential 3 VS, other pundits prefer dissecting data as per 5Vs. These 5Vs denote Volume, Velocity, Variety, Veracity, Value the five core factors but, not necessarily in that order. However, Volume would always be the element that lays the foundation of big data. Pursuing a Data Science course would further clarify your idea of big data.
Volume
This concept is easier to grasp as it refers to the enormous amount of data being generated and collected every day. This amount is referred to as volume, the size of data definitely plays a crucial role as storing this data is posing a serious challenge for the companies. Now the size of the data would vary from one industry to the other, the amount of data an e-commerce site generates would vary from the amount generated on a popular social media platform like Facebook. Now, only advanced technology could handle and process and not to mention deal with the cost and space management issue for storing such large volumes of data.
Velocity
Another crucial feature of big data is velocity which basically refers to the speed at which data is generated and processed, analyzed, and moved across platforms to deliver insight in real-time if possible. Especially, in a field like healthcare the speed matters, crucial trading decisions that could result in loss or profit, must also be taken in an instant. Only the application of advanced data science technology can collect data points in an instant and process those at a lightning speed to deliver results. Another point to be noted here is the fact that just like volume the velocity of data is also increasing.
Variety
The 3rd V refers to the variety, a significant aspect of big data that sheds light on the diversity of data and its sources. As we already know that the data now hails from multiple sources, including social media platforms, IoT devices, and whatnot. The problem does not stop there, the data is also diverse in terms of format such as videos, texts, images, audios and it is a combination of structured and unstructured data. In fact, almost 80%-90% of data is unstructured in nature. This poses a big problem for the data scientists as sorting this data into distinct categories for processing is a complicated task. However, with advanced data science technologies in place determining the relationship among data is a lot hassle-free process now.
Veracity
It is perhaps the most significant aspect of all other elements, no matter how large datasets you have and in what variety, if the data is messy and inaccurate then it is hardly going to be of any use. Data quality matters and dirty data could be a big problem especially because of the fact that data comes from multiple sources. So, you have apparently no control, the problems range from incomplete data to inconsistency of information. In such situations filtering the data to extract quality data for analysis purposes is essential. Pursuing Data science using python training can help gain more skill required for such specific tasks.
Value
The 5th V of big data refers to the value of the data we are talking about. You are investing money in collecting, storing, and processing the big data but if it does not generate any value at the end of the day then it is completely useless. Managing this massive amount of data requires a big investment in advanced infrastructure and additional resources, so, there needs to be ROI. The data teams involved in the process of collecting, sorting, and analyzing the data need to be sure of the quality of data they are handling before making any move.
The significance of big data in generating valuable insight is undeniable and soon it would be empowering every industry. Further research in this field would lead to the development of data science tools for handling big data issues in a more efficient manner. The career prospects in this field are also bright, training from a Data analyst training institute can help push one towards a rewarding career.
With the big data field experiencing an exponential growth, the need for skilled professionals to sort, analyze data is also growing. Not just businesses but other sectors too are realizing the significance of big data to leverage their growth.
In order to move forward with confidence, big data can help. With digitization the amount of data being generated is also increasing and to process such vast amount of data skilled professionals are required.
The field is surely opening up for the young generation who needs the right blend of skill and passion to land high-paying jobs in the field. Help is available in the form of training institutes which offer cutting edge courses like big data training in gurgaon.
So how much data we are talking about here?
The amount of data that is generated now thanks to IOT, stands at more than 2.5 quintillion bytes of data and this amount is being generated everyday as per the sixth edition of DOMO’s report. By this current year it was estimated that every person will create 1.7MB of data every second.
With IOT being primarily the reason behind this data proliferation, we are looking at a huge data avalanche heading our way comprising mostly unstructured data.
All of the data generated along with past stock are of importance now as crucial sectors like banking, healthcare, communication, manufacturing, finance are being reliant on data to extract valuable information for taking pivotal decisions.
A Data analyst training institute can be of immense value as they take up the responsibility of shaping data skills of the professionals needed by these sectors.
The expanding field of data requires data experts
Processing through mountains of unstructured data, cleaning it, preparing it for further processing and then analyzing it to find pattern takes skill which could be attained by pursuing Data science using python training.
As per survey findings, there is a huge gap in the demand and supply chain. The field might be expanding and organizations being eager to embrace the power of data, but, the dearth of professionals is posing a big problem which is why the companies in dire need of trained workforce are taking the salary graph higher to lure talent.
However, there are courses available such as business analyst training delhi, that are aimed at training up the new generation of geeks to handle the big data, thereby helping them carve out successful career avenues.
What are the trending jobs in this sector?
Data scientist
A data scientist basically works with a business organization to process raw data, cleaning, analyzing the data to detect patterns that could be of immense value for the organization concerned. A data scientist can play a big role in helping a company decide the next business strategy. They also create algorithms and build machine learning models. Data Science training can help you be prepared for such a high-profile position.
In the USA, a data scientist can earn upto $1,13,309, while in India it could be ₹500,000 per annum.
Data Engineer
A data engineer is a person who is well versed in programming and SQL, and works with stored data. He basically has to work with data systems and is charged with the responsibility of creating data infrastructure and maintaining it. A data engineer also works to build data pipelines to channelize valuable data to data analysts and scientists fast.
The salary range of a data engineer in the USA could be near $128,722 per annum and in India it could hover around ₹839,565.
Data Analyst
The data analyst is basically the guy who runs the show as he is in charge of manipulating huge data sets. He is involved with the tasks of gathering data and he also creates databases, analytics models, extracts information and analyzes that to aid in decision making. Not just that but he also needs to present the insight into a format that everybody can grasp.
If you aim to grab this job then you could expect a pay around $62,453 in United States. In India that number might be around ₹419135 on average.
BI Analyst
A BI Analyst has to put his entire focus on analyzing data in order to identify the potential areas for a company to prosper along with the main obstacles standing in their way to success. They have to update the database on a continuous basis along with monitoring the performance of rivals in the field concerned.
Along with possessing sharp business acumen, he must be proficient in data handling. He basically offers data-driven insight while donning the role of a consultant.
A background in computer science or, business administration, statistics, finance could work in your favor if only you can couple that with big data courses in delhi.
A skilled BI Analyst could expect a pay around $94906 in the USA, and in India they might get upto ₹577745.
There are more lucrative job opportunities and exciting job roles awaiting the next generation of professionals that can help them build a highly successful career. Regardless of which background they hail from undergoing a Data Science course can push them in the right direction.
In today’s data-driven world, it is hard to ignore the growing need for data science, as businesses are busy applying data to devise smarter marketing strategies and urging their employees to upgrade themselves. Data Science training is gaining ground as lucrative career opportunities are beckoning the younger generation.
So, it is not surprising that a crucial sector like healthcare would apply data science to upgrade their service. Health care is among one of the many sectors that have acknowledged the benefits of data science and adopted it.
The Healthcare industry is vast and it comprises many disciplines and branches that intercross generating a ton of unstructured data which if processed and analyzed could lead to revolutionary changes in the field.
Here is taking a look at how the industry can benefit by adopting data science techniques
Diagnostic error prevention
No matter what health issues one might have, accurate diagnosing is the first step that helps a physician prescribe treatment procedure. However, there have been multiple cases where a diagnostic error has led to even death. With the implementation of data science technology, it is now possible to increase the accuracy of the procedures as the algorithm sifts data to detect patterns and come up with accurate results.
Medical imaging procedures such as MRI, X-Ray can now detect even tiniest deformity in the organs which were erstwhile impossible, due to the application of deep learning technology. Advanced models such as MapReduce is also being put to use to enhance the accuracy level.
Bioinformatics
Genomics is an interesting field of research where researchers analyze your DNA to understand how it affects your health. As they go through genetic sequences to gain an insight into the correlation, they try to find how certain drugs might work on a specific health issue.
The purpose is to provide a more personalized treatment program. In order to process through the highly valuable genome data, data science tools such as SQL are being applied. This field has a vast scope of improvement and with more advanced research work being conducted in the field of Bioinformatics, we can hope for better results. Researchers who have studied Data science using python training, would prove to be invaluable assets for this specific field.
Health monitoring with wearables
Healthcare is an ongoing process, if you fall ill, you get yourself diagnosed and then get treatment for the health condition you have. The story in most cases does not end there, with the number of patients with chronic health problems increasing, it is evident that constant monitoring of your health condition is required to prevent your health condition from taking a worse hit. Data science comes into the picture with wearables and other forms of tracking devices that are programmed to keep your health condition in check. Be it your temperature or, heartbeat the sensors keep tracking even minute changes, the data is analyzed to enable the doctors take preventive measures, the GPS-enabled tracker by Propeller, is an excellent case in point.
Faster approval of new drugs
The application of data science is not restricted to only predicting, preventing, and monitoring patient health conditions. In fact, it has reached out to assist in the drug development process as well. Earlier it would take almost a decade for a drug to be accessible in the market thanks to the numerous testing, trial, and approval procedures.
But, now it is possible to shorten the duration thanks to advanced data science algorithms that enable the researchers to simulate the way a drug might react in the body. Different models are being used by the researchers to process clinical trial data, so, that they can work with different variables. Data Science course enables a professional to carry out research work in such a highly specialized field.
In the context of Covid-19
With the entire world crippling under the unprecedented impact of COVID-19, it is needless to point out that the significance of data science in the healthcare sector is only going to increase. If you have been monitoring the social media platforms then you must have come across the #FlattenTheCurve.
The enormity of the situation and erroneous data collection both have caused issues, but, that hasn’t deterred the data scientists. Once, the dust settles they will have a mountainous task ahead of them to process through a massive amount of data the pandemic will have left behind, to offer insight that might help us take preventive measures in the future.
The field of data science has no doubt made considerable progress and so has the field of modern healthcare. Further research and collaboration would enable future data scientists to provide a better solution to bolster the healthcare sector.
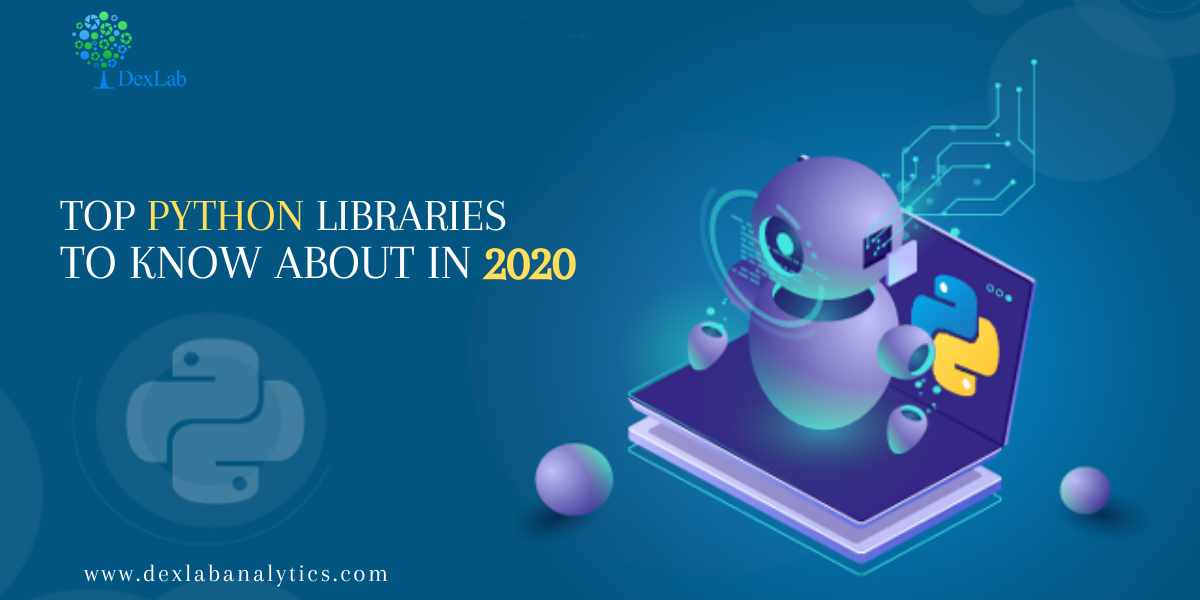
Python today is one of the most sought after programming languages in the world. As per Python’s Executive Summary, “Python is an interpreted, object-oriented, high-level programming language with dynamic semantics. Its high-level built in data structures, combined with dynamic typing and dynamic binding, make it very attractive for Rapid Application Development, as well as for use as a scripting or glue language to connect existing components together. Python’s simple, easy to learn syntax emphasizes readability and therefore reduces the cost of program maintenance.”
The most advantageous facet of Python is the richness of its library sources and the myriad uses and applications of these libraries in programming. This essay is dedicated to studying some of the best Python libraries available.
Tensor Flow
Tensor Flow is a highly popular open source library built by Google and Brain Team. It is used in almost all Google projects for machine learning. Tensor Flow
works as a computational library for writing fresh algorithms that require vast amounts of tensor operations.
Scikit-learn
Unarguably one of the most competent libraries for working with complex data, Scikit-learn is a python library associated with Numpy and SciPy. This library facilitates cross validation or the ability to use more than one metric.
Keras
Keras is one of the most revolutionary libraries in Python in that it makes it easy to express neural networks. Keras provides some of the most competent utilities for compiling models, processing datasets and more.
PyTorch
It is the largest machine learning library that permits developers to perform tensor computation, create dynamic graphs and calculate gradients automatically. Also, it offers a rich repository of APIs for solving applications related to neural networks.
Light GBM
Gradient Boosting is one of the best machine learning libraries that helps developers build new algorithms using elementary models like decision trees. This library is highly scalable and optimal for fast implementation of gradient boosting.
Eli5
This library helps overcome the problem of inaccuracy in machine learning model predictions. It is used in mathematical operations that consume less computational time and it is important when it comes to depending on other Python libraries.
SciPy
This library is built using Numpy and it is used in high-level computations in data science. It is used extensively for scientific and computations, solving differential equations, linear algebra and optimization algorithms.
Pandas
Python Data Analysis or Pandas is another highly popular library that is crucial to a data science life cycle in a data science project. Pandas provides super fast and flexible data structures such as data frame CDs that are specifically designed to work with structured data intuitively.
There are many more libraries like Theano and Librosa that are lesser known but very very important for machine learning, the most revolutionary scientific development of our century. To know more on the subject, do peruse the DexLab Analytics website today. DexLab Analytics is a premier Machine Learning institute in Gurgaon.
Data Science is the new rage and if you are looking to make a career, you might as well choose to become a data scientist. Data Scientists work with large sets of data to draw valuable insights that can be worked upon. Businesses rely on data scientists to sieve through tonnes of data and mine out crucial information that becomes the bedrock of business decisions in the future.
With the growth of AI, machine learning and predictive analytics, data science has come to be one of the favoured career choices in the world today. It is imperative for a data scientist to know one of more programming languages from any of those available – Java, R, Python, Scala or MATLAB.
However, Data Scientists prefer Python to other programming languages because of a number of reasons. Here we delve into some of them.
Popular
Python is one of the most popular programming languages used today. This dynamic language is easy to pick up and learn and is the best option for beginners. Secondly, it interfaces with complex high performance algorithms written in Fortran or C. It is also used for web development, data mining and scientific computing, among others.
Preferred for Data Science
Python solves most of the daily tasks a data scientist is expected to perform. “For data scientists who need to incorporate statistical code into production databases or integrate data with web-based applications, Python is often the ideal choice. It is also ideal for implementing algorithms, which is something that data scientists need to do often,” says a report.
Packages
Python has a number of very useful packages tailored for specific functions, including pandas, NumPy and SciPy. Data Scientists working on machine learning tasks find scikit-learn useful and Matplotlib is a perfect solution for graphical representation and data visualization in data science projects.
Easy to learn
It is easy to grasp and that is why not only beginners but busy professionals also choose to learn Python for their data science needs. Compared to R, this programming language shows a sharper learning curve for most people choosing to learn it.
Scalability
Unlike other programming languages, Python is highly scalable and perceptive to change. It is also faster than languages like MATLAB. It facilitates scale and gives data scientists multiple ways to approach a problem. This is one of the reasons why Youtube migrated to Python.
Libraries
Python offers access to a wide range of data science and data analysis libraries. These include pandas, NumPy, SciPy, StatsModels, and scikit-learn. And Python will keep building on these and adding to these. These libraries have made many hitherto unsolvable problems seem easy to crack for data scientists.
Python Community
Python has a very robust community and many data science professionals are willing to create new data science libraries for Python users. The Python community is tight-knit one and very active when it comes to finding a solution. Programmers can connect with community members over the Internet and Codementor or Stack Overflow.
So, that is why data scientists tend to opt for Python over other programming languages. This article was brought to you by DexLab Analytics. DexLab Analytics is premiere data science training institute in Gurgaon.
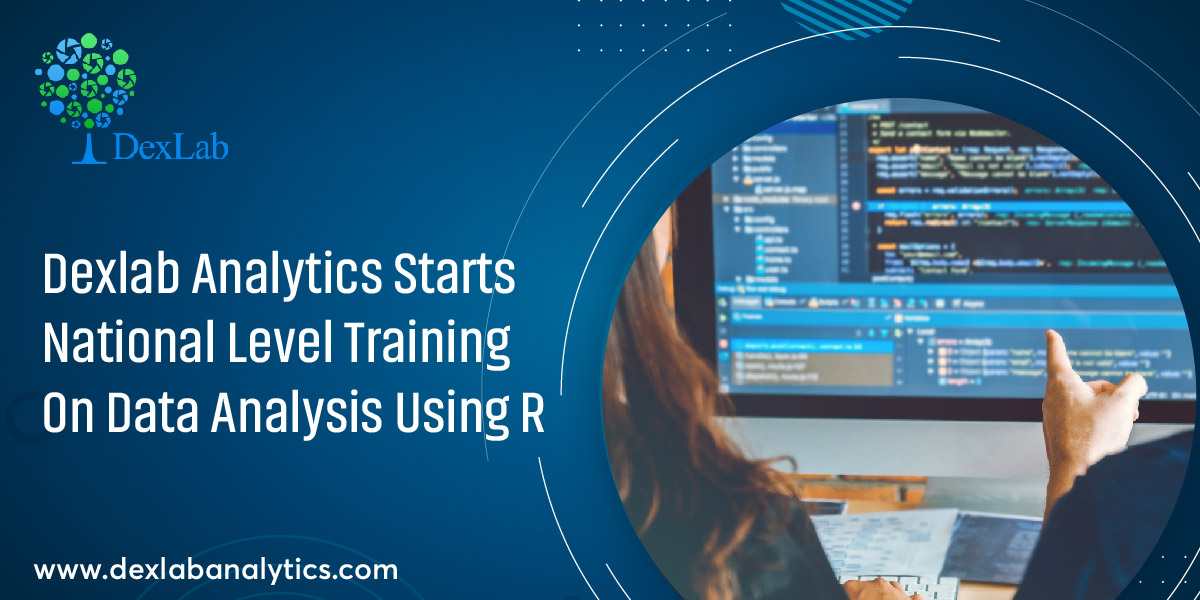
From Saturday, 6th June 2020, a team of senior consultants at DexLab Analytics has been conducting a national level training for more than 40 participants who are research scholars, MPhil students and professors from colleges like IIT, CSIR, BHU and NIT, among others. This one of a kind, crowd-funded training is being conducted on “Environment Air pollution Data Analysis using OpenAir package of R”.
The training is a result of the lockdown wherein DexLab Analytics is working towards its upskilling initiatives for professionals and subject matter experts across India. The training is being conducted in DexLab Analytics’TraDigital format – real time, online, classroom styled, instructor-led training.
The attendees will be taking up these interactive classes from the safety and comfort of their homes. They will be getting assignments, learning material and recordings virtually.
The one-month-long training will be conducted in R Programming, Data Science and Machine Learning using R Programming from the perspective of Environmental Science. DexLab Analytics is conducting this training module in line with the tenets of ‘Atmanirbhar India’.
DexLab Analytics is a leading data science training institute in India with a vast array of state-of-the-art analytics courses, attracting a large number of students nationwide. It offers high-in-demand professional courses like Big Data, R Programming, Python, Machine Learning, Deep Learning, Data Science, Alteryx, SQL, Business Analytics, Credit Risk modeling, Tableau, Excel etc. to help young minds be data-efficient. It has its headquarters in Gurgaon, NCR.