Analytics training institute Archives - Page 2 of 5 - DexLab Analytics | Big Data Hadoop SAS R Analytics Predictive Modeling & Excel VBA

How Data Science Is Getting Better, Day by Day?

HOW DATA SCIENCE IS GETTING BETTER, DAY BY DAY?

In the latest Star Wars movie, the character of Rose Tico – a humble maintenance techie with a talent for tinkering is relatable; her role expands and responsibilities increase as the movie gets going, just like our data scientists. A chance encounter with Finn puts her into the frontlines of action, and by the end of the movie, she’s flying ski-speeders in the new galactic civil war, one of the most critical battles in the movie – with time, her role becomes more complex and demanding, but she never quivers and embraces the challenges to get the job done.

A lot many data scientists draw similarities with Rose’s character. In the last 5 years, the job role and responsibility of data analysts has undergone an unrecognizable change – as data proliferation is increasing in capacity and complexity, the responsibility is found shifting base from dedicated consultants to cross-functional, highly-skilled data teams, proficient enough in integrating skills together. Today’s data consultants need to complete tasks collaboratively to formulate trailblazing analysis that let businesses predict future success and growth pattern, effectively.

Get excellent data science certification from DexLab Analytics.

Quite conventionally, the intense role of prediction falls on the sophisticated crop of data scientists, while business analysts are more oriented towards measuring churn. On the other hand, intricate tasks, like model construction or natural language processing are performed by an elite team of data professionals, armed with strong engineering expertise.

Said differently, the emergence of data manipulation languages, such as R and Python is surging – owing to their extensive usage and adaptability, businesses are biased towards implementing these languages for advanced analysis. Drawing inspiration from Rose’s character, each data scientist should adapt to newer technology and expectations, and enhance expertise and skills that’s needed for the new role.

However, acing the cutting edge programming languages and tools isn’t enough for the challenge – today, data teams need to visualize their results, like never before. The insights churned out of advanced machine learning are curated for consumption by business pioneers and operation teams. Thus, the results have to be crisp, clear and creatively presented. As a result, predictive tools are being combined with effective capability of Python and R with which analysts and stakeholders are quite familiar.

The whole big data industry is changing, and the demand for skilled big data analysts is sky-rocketing. In this tide of change, if you are not relying on advanced data analysis tools and predictive analytics, you are going to lag behind. Companies that analyze data, boost decision-making, and observe social media trends – changing with time – will have immense advantages over companies that don’t pay attention to these crucial parameters.

2

No second thoughts, it’s an interesting time for data aspirants to make significant impacts in the whole data community and trigger fabulous business results. For professional training or to acquire new skills – drop by DexLab Analytics – their data Science Courses in Noida are outstanding.

The blog has been sourced from  dataconomy.com/2018/02/whole-new-world-data-teams


Interested in a career in Data Analyst?

To learn more about Data Analyst with Advanced excel course – Enrol Now.
To learn more about Data Analyst with R Course – Enrol Now.
To learn more about Big Data Course – Enrol Now.

To learn more about Machine Learning Using Python and Spark – Enrol Now.
To learn more about Data Analyst with SAS Course – Enrol Now.
To learn more about Data Analyst with Apache Spark Course – Enrol Now.
To learn more about Data Analyst with Market Risk Analytics and Modelling Course – Enrol Now.

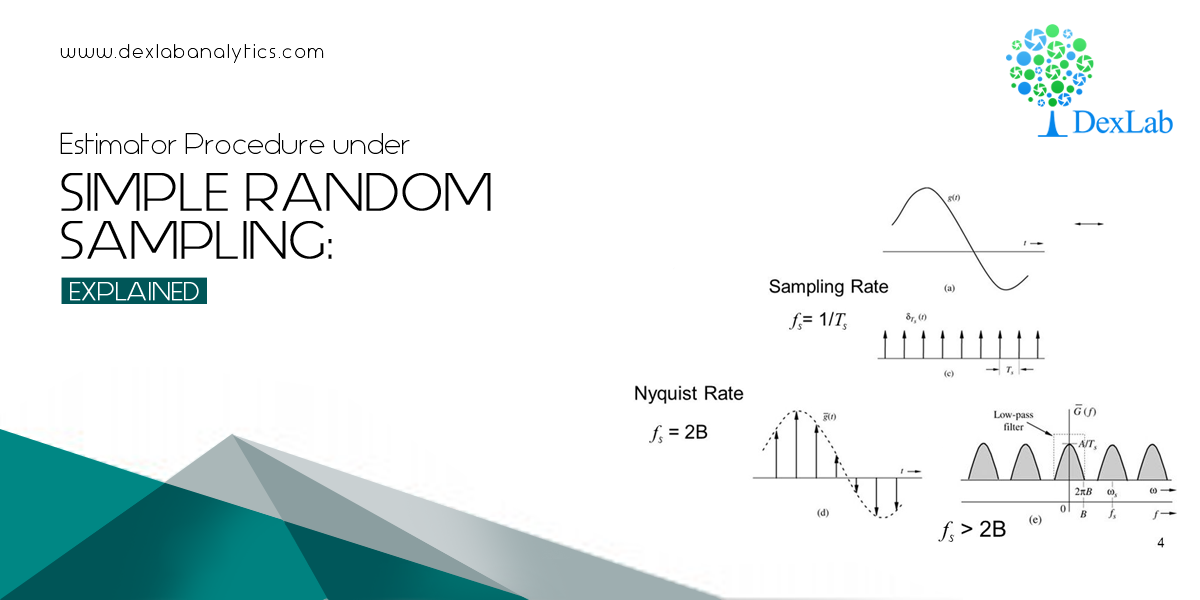
Estimator Procedure under Simple Random Sampling: EXPLAINED

Estimator Procedure under Simple Random Sampling: EXPLAINED

In continuation with the previous introductory blog on sampling: An ABC Guide to Sampling Theory, we will take a closer look into the concept of the estimator procedure under Simple Random Sampling with the help of mathematical examples. It will help us understand the underlying phenomenon, the manner to be precise in which the estimator function of sampling works.

Simple random sampling (SRS) is a method of selecting a sample comprising ‘n’ number of sampling units out of the population of ‘N’ number of sampling units such that every sampling unit has an equal chance of being chosen.

The Estimator Procedure under Simple Random Sampling

The process of selection of a sample under SRS (Simple Random Sampling) is random. This means, each number of the population has an equal probability of getting selected, which makes each of the observation identical and independently distributed.

The statistic chosen by the investigation of estimation of random samples need to satisfy a set of certain properties given below:

  1. Unbiasedness
  2. Consistency
  3. Sufficiency
  4. Efficiency

As a matter of fact, investigation is always about coming up with an idea regarding the population parameters based on the sample observations. The best part would be to formulate an unbiased, consistent estimator, which is also efficient. Normally, a sample mean for a set of sample observations is considered to be a very desirable estimator to form ideas about population parameters.

In detail, let’s examine the relevance of each of the properties of an estimator:

Unbiasedness of an estimator

Take a look at the below examples to understand the very idea of unbiasedness.

Example 1:

Answer:-

According to the problem, we have

Adding (1) & (2), we get,

So, from (3), we get:-

 is called an unbiased estimators for .

Now, subtracting (2) & (1), we get –

Example 2:

Assume that an investigator draws a sample from this population using SRSWR. Then show that the sample mean is an unbiased estimator for the population mean.

Now, by specification we have:-

We are redefined to show that:-

L.H.S  :

DexLab Analytics Presents #BigDataIngestion

DexLab Analytics Presents #BigDataIngestion


Data sampling is the key to business analytics and data science. On that note, DexLab Analytics offers state of the art Data Science Certification for all data enthusiasts. Recently, they have organized a new admission drive #BigDataIngestion offering exclusive 10% off on in-demand courses, including big data, machine learning and data science courses.


Interested in a career in Data Analyst?

To learn more about Data Analyst with Advanced excel course – Enrol Now.
To learn more about Data Analyst with R Course – Enrol Now.
To learn more about Big Data Course – Enrol Now.

To learn more about Machine Learning Using Python and Spark – Enrol Now.
To learn more about Data Analyst with SAS Course – Enrol Now.
To learn more about Data Analyst with Apache Spark Course – Enrol Now.
To learn more about Data Analyst with Market Risk Analytics and Modelling Course – Enrol Now.

A Comprehensive Guide on Clustering and Its Different Methods

A Comprehensive Guide on Clustering and Its Different Methods

Clustering is used to make sense of large volumes of data, structured or unstructured, by dividing the data into groups. The members of a group are ‘’similar’’ between them and ‘’dissimilar’’ to objects in other groups. The similarity is based on characteristics such as equal distances from a point or people who read the same genre of book. These groups with similar members are called clusters. The various methods of clustering, which we shall be discussing subsequently, help break up data into logical groupings before analyzing the data more deeply.

If a CEO of a company presents a broad question like- ‘’ Help me understand our customers better so that we can improve marketing strategies’’, then the first thing analysts need to do is use clustering methods to the classify customers. Clustering has plenty of application in our daily lives. Some of the domains where clustering is used are:

  • Marketing: Used to group customers having similar interests or showing identical behavior from large databases of customer data, which contain information on their past buying activities and properties.
  • Libraries: Used to organize books.
  • Biology: Used to classify flora and fauna based on their features.
  • Medical science: Used for the classification of various diseases.
  • City-planning: identifying and grouping houses based on house type, value and geographical location.
  • Earthquake studies: clustering existing earthquake epicenters to locate dangerous zones.

Clustering can be performed by various methods, as shown in the diagram below:

Fig 1

The two major techniques used to perform clustering are:

  • Hierarchical Clustering: Hierarchical clustering seeks to develop a hierarchy of clusters. The two main techniques used for hierarchical clustering are:
  1. Agglomerative: This is a ‘’bottom up’’ approach where first each observation is assigned a cluster of its own, then pairs of clusters are merged as one moves up the hierarchy. The process terminates when only a single cluster is left.
  2. Divisive: This is a ‘’top down’’ approach wherein all observations start in one cluster, and splits are performed recursively as one moves down the hierarchy. The process terminates when each observation has been assigned a separate cluster.

Fig 2: Agglomerative clustering follows a bottom-up approach while divisive clustering follows a top-down approach.

  • Partitional Clustering: In partitional clustering a set of observations is divided into non-overlapping subsets, such that each observation is in exactly one subset. The main partitional clustering method is K-Means Clustering.

The most popular metric used for forming clusters or deciding the closeness of clusters is distance. There are various distance measures. All observations are measured using one particular distance measure and the observation having the minimum distance from a cluster is assigned to it. The different distance measures are:

  • Euclidean Distance: This is the most common distance measure of all. It is given by the formula:

Distance((x, y), (a, b)) = √(x – a)² + (y – b)²

For example, the Euclidean distance between points (2, -1) and (-2, 2) is found to be

Distance((2, -1), (-2, 2)) 

  • Manhattan Distance:

This gives the distance between two points measured along axes at right angles. In a plane with p1 at (x1, y1) and p2 at (x2, y2), Manhattan distance is |x1 – x2| + |y1 – y2|.

  • Hamming Distance:

Hamming distance between two vectors is the number of bits we must change to convert one into the other. For example, to find the distance between vectors 01101010 and 11011011, we observe that they differ in 4 places. So, the Hamming distance d(01101010, 11011011) = 4

  • Minkowski Distance:

The Minkowski distance between two variables X and Y is defined as

The case where p = 1 is equivalent to the Manhattan distance and the case where p = 2 is equivalent to the Euclidean distance.

These distance measures are used to measure the closeness of clusters in hierarchical clustering.

In the next blogs, we will discuss the different methods of clustering in more details, so make sure you follow DexLab Analytics– we provide the best big data Hadoop certification in Gurgaon. Do check our data analyst courses in Gurgaon.


Interested in a career in Data Analyst?

To learn more about Data Analyst with Advanced excel course – Enrol Now.
To learn more about Data Analyst with R Course – Enrol Now.
To learn more about Big Data Course – Enrol Now.

To learn more about Machine Learning Using Python and Spark – Enrol Now.
To learn more about Data Analyst with SAS Course – Enrol Now.
To learn more about Data Analyst with Apache Spark Course – Enrol Now.
To learn more about Data Analyst with Market Risk Analytics and Modelling Course – Enrol Now.

Microsoft Introduces FPGA Technology atop Google Chips through Project Brainwave

Microsoft Introduces FPGA Technology atop Google Chips through Project Brainwave

A Change Is In the Make – due to increasing competition among tech companies working on AI, several software makers are inventing their own new hardware. A few Google servers also include chips designed for machine learning, known as TPUs exclusively developed in-house to ensure higher power and better efficiency. Google rents them out to its cloud-computing consumers. Of late, Facebook too shared its interest in designing similar chips for its own data centers.

However, a big player in AI world, Microsoft is skeptical if the money spent is for good – it says the technology of machine learning is transforming so rapidly that it makes little sense to spend millions of dollars into developing silicon chips, which could soon become obsolete. Instead, Microsoft professionals are pitching for the idea of implementing AI-inspired projects, named FPGAs, which can be re-modified or reprogrammed to support latest forms of software developments in the technology domain.  The company is buying FPGAs from chip mogul, Intel, and already a few companies have started buying this very idea of Microsoft.

This week, Microsoft is back in action with the launch of a new cloud service for image-recognition projects, known as Project Brainwave. Powered by the very FPGA technology, it’s one of the first applications that Nestle health division is set to use to analyze the acuteness of acne, from images submitted by the patients. The specialty of Project Brainwave is the manner in which the images are processed – the process is quick as well as very low in cost than other graphic chip technologies used today.

It’s been said, customers using Project Brainwave are able to process a million images in just 1.8 milliseconds using a normal image recognition model for a mere 21 cents. Yes! You heard it right. Even the company claims that it performs better than it’s tailing rivals in cloud service, but unless the outsiders get a chance to test the new technology head-to-head against the other options, nothing concrete can be said about Microsoft’s technology. The biggest competitors of Microsoft in cloud-service platform include Google’s TPUs and graphic chips from Nvidia.

Let’s Take Your Data Dreams to the Next Level

At this stage, it’s also unclear how widely Brainwave is applicable in reality – FPGAs are yet to be used in cloud computing on a wide scale, hence most companies lack the expertise to program them. On the other hand, Nvidia is not sitting quietly while its contemporaries are break opening newer ideas in machine learning domain. The recent upgrades from the company lead us to a whole new world of specialized AI chips that would be more powerful than former graphic chips.

Latest reports also confirm that Google’s TPUs exhibited similar robust performance similar to Nvidia’s cutting edge chips for image recognition task, backed by cost benefits. The software running on TPUs is both faster and cheaper as compared to Nvidia chips.

In conclusion, companies are deploying machine learning technology in all areas of life, and the competition to invent better AI algorithms is likely to intensify manifold. In the coming days, several notable companies, big or small are expected to follow the footsteps of Microsoft.

For more machine learning related stories and feeds, follow DexLab Analytics. It is the best data analytics training institute in Gurgaon offering state of the art machine learning using python courses.

The article has been sourced from – https://www.wired.com/story/microsoft-charts-its-own-path-on-artificial-intelligence


Interested in a career in Data Analyst?

To learn more about Machine Learning Using Python and Spark – click here.

To learn more about Data Analyst with Advanced excel course – click here.
To learn more about Data Analyst with SAS Course – click here.
To learn more about Data Analyst with R Course – click here.
To learn more about Big Data Course – click here.

How Artificial Intelligence is Boosting the Design of Smarter Bionics

How Artificial Intelligence is Boosting the Design of Smarter Bionics

Artificial Intelligence and Machine Learning are a set of technologies that empower machines and computers to learn and evolve upon their own learning through constant reiteration and consistent data bank upgrades. The entire chain of mechanism stands on recursive experiments and human intervention.

Bionics

Advances in technology have greatly benefited the field of prosthetics in the last few years. Today’s prosthetic limbs are made using space-age materials that provide increased durability and function. In addition, many prosthetics make use of bionic technology. These types of prosthetics are called myoelectric prosthetics.

Let’s Take Your Data Dreams to the Next Level

Myoelectric prosthetics picks up the electrical action potential from the residual muscles in the amputated limb. Upon receiving the action potentials, the prosthetic amplifies the signal using a rechargeable battery. Detected signal can be used further into usable information to drive a control system. Artificial Intelligence helps to identify motion commands for the control of a prosthetic arm by evidence accumulation. It is able to accommodate inter-individual differences and requires little computing time in the pattern recognition. This allows more freedom and doesn’t require the person to perform frequent, strenuous muscle contractions. The inclusion of AI technology in prosthetics has helped thousands of amputees return to daily activities. While technologies that make bionic implants possible are still in infancy stage, many bionic items already exist.

The Bionic Woman

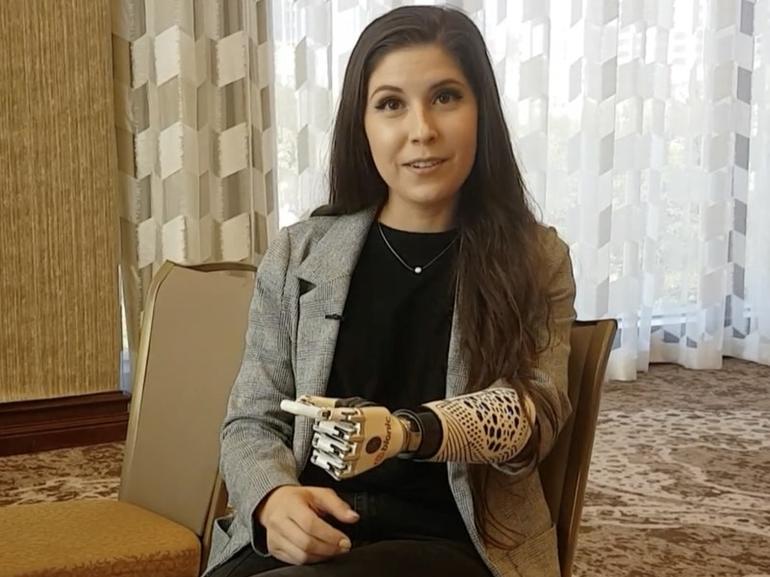
 Angel Giuffria is an amputee actress and Ottobock Healthcare’s Brand Champion who has been wearing electromechanical devices since she was four months old. Following are excerpts of an interview with her.

“I wear currently the bebionic 3 small-size hand which sounds like a car. But at this point, that’s where we’re getting with technology. It’s a multi-articulating device. That small-size hand is really amazing… this technology wasn’t available to them previously”

She further added, “..The new designs that look more tech are able to showcase the technology. I’ve really become attached to and I think a lot of other people have really clung onto as well because it just gives off the impression of showing people how capable we are in society now.”

 She also spoke about prosthetics like the Michelangelo Hand which is stronger, faster and has multiple hook options. Modern additions to prosthetics such as lights and cameras are added advantages. She describes her hand to be able to do multiple functions like change grip patterns and control wrist movements which enable her to hold small items like keys and credit cards.

angelgiuffriaottobokbebionichand

I-limb

Bertolt Meyer’s amazing bionic hand controlled via an iPhone app is another glimpse at the advances being made in prosthetics.

In 2009, Meyer, a social psychologist at the University of Zurich was fitted with an i-limb, a state-of-the-art bionic prosthesis developed by a Scottish company, Touch Bionics, which comes with an aluminum chassis and 24 different grip patterns. To select a new suite of gestures, Meyer simply taps an app on his iPhone. He describes his i-limb to be the first, where aesthetics match engineering.

Bertolt-Meyer-who-has-an--010

In the world of prosthetics, function is the key. Most amputees are constantly searching for the same level of functionality that they enjoyed before they lost their limb. With the introduction of artificial intelligence in prosthetic limbs, amputees are closer to their goals than ever before. Bionics having access to the relevant databases are capable of learning new things in a programmed manner which improves their performance.

For more such interesting blogs follow Dexlab Analytics. Also take a look at the Machine Learning courses being offered by Dexlab Analytics– a premier analytics training institute in Gurgaon.


Interested in a career in Data Analyst?

To learn more about Machine Learning Using Python and Spark – click here.

To learn more about Data Analyst with Advanced excel course – click here.
To learn more about Data Analyst with SAS Course – click here.
To learn more about Data Analyst with R Course – click here.
To learn more about Big Data Course – click here.

How Big Data Plays the Key Role in Promoting Cyber Security

The number of data breaches and cyber attacks is increasing by the hour. Understandably, investing in cyber security has become the business priority for most organizations. Reports based on a global survey of 641 IT and cyber security professionals reveal that a whopping 69% of organizations have resolved to increase spending on cyber security. The large and varied data sets, i.e., the BIG DATA, generated by all organizations small or big, are boosting cyber security in significant ways.

How Big Data Plays the Key Role in Promoting Cyber Security

Business data one of the most valuable assets of a company and entrepreneurs are becoming increasingly aware of the importance of this data in their success in the current market economy. In fact, big data plays the central role in employee activity monitoring and intrusion detection, and thereby combats a plethora of cyber threats.

Let’s Take Your Data Dreams to the Next Level

  1. EMPLOYEE ACTIVITY MONITERING:

Using an employee system monitoring program that relies on big data analytics can help a company’s human resource division keep a track on the behavioral patterns of their employees and thereby prevent potential employee-related breaches. Following steps may be taken to ensure the same:

  • Restricting the access of information only to the staff that is authorized to access it.
  • Staffers should use theirlogins and other system applications to change data and view files that they are permitted to access. 
  • Every employee should be given different login details depending on the complexity of their business responsibilities.


  1. INTRUSION DETECTION:

A crucial measure in the big data security system would be the incorporation of IDS – Intrusion Detection System that helps in monitoring traffic in the divisions that are prone to malicious activities. IDS should be employed for all the pursuits that are mission-crucial, especially the ones that make active use of the internet. Big data analytics plays a pivotal role in making informed decisions about setting up an IDS system as it provides all the relevant information required for monitoring a company’s network.

The National Institute of Standards and Technology recommends continuous monitoring and real-time assessments through Big Data analytics. Also the application of predictive analytics in the domain of optimization and automation of the existing SIEM systems is highly recommended for identifying threat locations and leaked data identity.

  1. FUTURE OF CYBER SECURITY:

Security experts realize the necessity of bigger and better tools to combat cyber crimes. Building defenses that can withstand the increasingly sophisticated nature of cyber attacks is the need of the hour. Hence advances in big data analytics are more important than ever.

Relevance of Hadoop in big data analytics:

  • Hadoop provides a cost effective storage solution to businesses.
  • It facilitates businesses to easily access new data sources and draw valuable insights from different types of data.
  • It is a highly scalable storage platform.
  • The unique storage technique of Hadoop is based on a distributed file system that primarily maps the data when placed on a cluster. The tools for processing data are often on the same servers where the data is located. As a result data processing is much faster.
  • Hadoop is widely used across industries, including finance, media and entertainment, government, healthcare, information services, and retail.
  • Hadoop is fault-tolerant. Once information is sent to an individual node, that data is replicated in other nodes in the cluster. Hence in the event of a failure, there is another copy available for use.
  • Hadoop is more than just a faster and cheaper analytics tool. It is designed as a scale-out architecture that can affordably store all the data for later use by the company.


Developing economies are encouraging investment in big data analytics tools, infrastructure, and education to maintain growth and inspire innovation in areas such as mobile/cloud security, threat intelligence, and security analytics.

Thus big data analytics is definitely the way forward. If you dream of building a career in this much coveted field then be sure to invest in developing the relevant skill set. The Big Data training and Hadoop training imparted by skilled professionals at Dexlab Analytics in Gurgaon, Delhi is sure to give you the technical edge that you seek. So hurry and get yourself enrolled today!


Interested in a career in Data Analyst?

To learn more about Machine Learning Using Python and Spark – click here.

To learn more about Data Analyst with Advanced excel course – click here.
To learn more about Data Analyst with SAS Course – click here.
To learn more about Data Analyst with R Course – click here.
To learn more about Big Data Course – click here.

Reigning the Markets: 4 Most Influential Analytics Leaders of 2018

Data analytics in India is grabbing attention. Data and analytics, together, they play a key role in delivering business opinions, which are high-yielding and relatively new. At the helm of such robust data analytics growth are leaders from numerous organizations who introspect into data to conjure up decisions as a seamlessly as possible. They are masterminds in the world of data analytics.

Reigning the Markets: 4 Most Influential Analytics Leaders of 2018

Here, we will talk about 4 most influential analytics leaders who acted as pioneers of bringing in newer technologies and life-changing innovations into the field of analytics, machine learning, artificial intelligence and big data across diverse domains.

Debashish Banerjee, Managing Director, Deloitte Analytics

With 17 years and more experience in predictive modeling, data analytics and data science, Mr. Banerjee’s extensive contribution in the fields of actuarial risk, data mining, advanced analytics and predictive modeling in particular is phenomenal. He started his career with GE, and initiated and headed insurance analytics, pricing and reserving team of GE, India – one of the firsts in India.

In 2005, he shifted to Deloitte with a mission to initiate the advanced analytics and modeling practice in India, through which he manages and offers leadership support to the Deloitte Consulting’s Data Science practices that stresses on AI, predictive modeling, big data and cognitive intelligence. He mostly worked in marketing, customer and HR domains.

Let’s Take Your Data Dreams to the Next Level

Kaushik Mitra, Chief Data Officer and Head of Big Data & Digital Analytics, AXA Business Services (ABS)

Experienced for over 25 years in integrating analytics, technology and marketing worldwide, Kaushik Mitra dons a lot many hats. Besides assuming leadership roles for diverse domains, like AI, analytics, data science, business intelligence and modeling, Mr. Mitra is at present involved in driving an array of data innovation coupled with technology restructuring in the enterprise, as well as coordinating GDPR implementation in ABS.

Before joining ABS, he worked with Fidelity Investments in Bangalore, where he played a pivotal role in establishing their data science practice. Armed with a doctorate in Marketing from the US, he is a notable figure in the world of analytics and marketing, along with being a frequent speaker in Indian industry networks, like NASSCOM and other business forums.

Ravi Vijayaraghavan, Vice President, Flipkart

Currently, Ravi Vijayaraghavan and his team are working on how to leverage analytics, data and science to improve decision-making capabilities and influence businesses across diverse areas within Flipkart. Before joining Flipkart, he used to work as Chief Data Scientist and Global Head of the Analytics and Data Sciences Organization at [24]7.ai. It was here that he created, developed, implemented and optimized machine learning and analytics driven solutions. Also, he held important leadership portfolios at Mu Sigma and Ford Motor Company.

Deep Thomas, Chief Data & Analytics Officer, Aditya Birla Group

“Delivering nothing but sustained and rising profitability figures through potent digital transformation and leveraging data, business analytics, multi-disciplinary talent pool and innovative processes” – has been the work mantra of Deep for more than two decades. Being the Chief Data & Analytics Officer for Aditya Birla Group, he spearheads top of the line analytics solutions and frames organization-wide initiatives and tech-induced programs to enhance business growth, efficiencies and productivity within an organization.

Initially, he headed Tata Insights and Quants, the much acclaimed Tata Group’s Big Data and Decision Science Company. Apart from this, he held a variety of leadership positions in MNCs like Citigroup, HSBC and American Express across US and India to boost global digital and business transformation.

This article has been sourced from – https://analyticsindiamag.com/10-most-influential-analytics-leaders-in-india-2018

For more such interesting blogs and updates, follow DexLab Analytics. It’s a premier data science certification institute in Delhi catering to data aspirants. Take a look at their data science courses in Delhi: they are program-centric and nicely curated.


Interested in a career in Data Analyst?

To learn more about Machine Learning Using Python and Spark – click here.

To learn more about Data Analyst with Advanced excel course – click here.
To learn more about Data Analyst with SAS Course – click here.
To learn more about Data Analyst with R Course – click here.
To learn more about Big Data Course – click here.

5 Expected Changes You Are Going to Witness Once You Move to SaaS

Moving to the cloud takes time. One of our friends started with Salesforce in 2009, after 5 years they introduced G Suite (widely known as Google Apps during that time) and it’s now in 2017 that they have adopted a fully cloud-based electronic health record facility. It took 10 years for an organization to resort to a handful number of installed applications for smooth handling of specialized tasks.  

5 Expected Changes You Are Going to Witness Once You Move to SaaS

Nevertheless, their shift to Software-as-a-Service (SaaS) has had an impact on IT spending. Though the expenditure varies from company to company, every organization must have experienced these 5 changes highlighted below:


Let’s Take Your Data Dreams to the Next Level

Better networks

Unsurprisingly, people need and expect faster internet speed these days. Even small businesses have connections that deliver 250Mbps down and 75Mbps (or more) up. An interesting switch is being observed in infrastructure. Today, more or less any medium-organization boasts of 802.11n or 802.11ac WIFI networks, which was unimaginable even few years ago. Deploying wireless mesh devices has become the order of the day now.

Lesser computer upgrades

There was a time, when we used to think that we have to replace our computers every three or five years. In several cases, we had even planned to make a few upgrades to the hardware to keep them running (RAM and hard-drive replacement was a common thought).

But in reality, organizations seldom have to replace parts. In most offices, five year old desktops perform perfectly in delivering the right results. This means definitely days of upgrades are over, all that matters is a faster internet speed and robust app development.


More usage of “plug-in and use” systems

More and more companies are seeking so-called “sealed” systems. Though some big companies still go on deploying standardized drive images, but increasingly organizations are found picking off-the-shelf sealed devices, like all-in-one desktops and non-use-configurable laptops.


As organizations are moving towards SaaS, Chromebooks are becoming increasingly famous. In fact, more than 20% of the team mentioned in the beginning of the blog uses a Chromebook as their primary work device.

Longer life for devices

Devices, like desktops and laptops that have embraced SaaS seem to have a longer lifecycle. As SaaS mostly depends on browser and network performance, the need for replacing devices has decreased to a great extent. Systems work totally until the device fails to perform or no longer in a position to receive any updates. Also, with SaaS, crucial data don’t remain solely on the device, hence if a system fails, little seems to be lost.

Considerable attention to the peripherals

Peripherals are intimidating. A large number of conventional desktop units have a scanner, printer and copier devices that are supported by a locally installed Windows software or server. Organizations can easily find alternatives of these devices, but it will take some time and effort as well. Few applications and sectors still suffer from minor or significant glitches, but over time, we hope peripherals and accessories will start showing signs of improvements.


What changes have you noticed in cloud computing and storage? How do you think the landscape of IT has changed over the past decade?


To better understand the intricacies of cloud computing and data storage, opt for business analytics course in Delhi from DexLab Analytics. They offer excellent analyst courses in Delhi at really affordable prices. Check out the course itinerary today!


The article has been sourced from – https://www.techrepublic.com/article/5-changes-companies-will-see-after-moving-to-saas


Interested in a career in Data Analyst?

To learn more about Machine Learning Using Python and Spark – click here.

To learn more about Data Analyst with Advanced excel course – click here.
To learn more about Data Analyst with SAS Course – click here.
To learn more about Data Analyst with R Course – click here.
To learn more about Big Data Course – click here.

How India is driving towards Data Governance

Data is power – it’s the quintessential key to proper planning, governance, policy decisions and empowering communities. In the recent times, technological expansion is found to be contributing immensely towards ensuring a sustainable future and building promising IT base. Robust developments in IT related services have resulted into key breakthroughs, including Big Data, which as a result have triggered smooth data governance.

How India is driving towards Data Governance

According to a NASSCOM report, India’s analytics market is expected to grow from $1 billion to $2.3 billion in the year 2017-18. However, the fuller benefits of data analytics are yet to be channelized by the public sector.

In a varied country like India, data collection is a lengthy procedure. At present, information is being collected by various government departments straight from Panchayat levels to state levels. Though, most of the data remains trapped within department walls, it is largely used to pan out performance reports. Also, certain issues in timely collection of data pops up, while sometimes the quality of data collected becomes questionable, hence delaying the entire analysis.


2


Quality data plays an integral role, if analyzed properly at the proper time. They can be crucial for decision-making, delivery of services and important policy revisions. As a matter of fact, last year, Comptroller and Auditor General (CAG) initiated Centre for Data Management and Analytics (CDMA) to combine and incorporate relevant data for the purpose of auditing. The main purpose here is to exploit the data available in government archives to build a more formidable and powerful Indian audit and accounts department.

Indian government is taking several steps to utilize the power of data – Digital India and Smart Cities initiatives aim to employ data for designing, planning, managing, implementing and governing programs for a better, digital India. Many experts are of the opinion that government reforms would best work if they are properly synchronized with data to determine the impact of services, take better decisions, boost monitoring programmes and improve system performances.

Open Data Policy is the need of the hour. Our government is working towards it, under the jurisdiction of the Department of Information and Technology (DIT) to boost the perks of sharing information across departments and ministries. Harnessing data eases out the load amongst the team members, while ensuring better accountability.

Tech startups and companies that probe into data and looks for solutions in data hoarding and analytics to collect and manage complicated data streams need to be supported. The government along with local players should encourage citizens to help them in collecting adequate information that could help them in long-run. India is walking towards a rapid economic development phase, where commitment towards information technology, data governance and open-source data is of prime importance. For the overall economy, bulk investments in capacity building, technology implementation and data-facilitating structures should be considered and implementable to bring plans and participation into place to hit off a better tech-inspired reality.

For data analyst certification in Delhi NCR, drop by DexLab Analytics – it’s a prime data science online training centre situated in the heart of Delhi.

The original article appeared on – https://economictimes.indiatimes.com/small-biz/security-tech/technology/indias-investment-in-big-data-will-ensure-governance/articleshow/57960046.cms


Interested in a career in Data Analyst?

To learn more about Machine Learning Using Python and Spark – click here.

To learn more about Data Analyst with Advanced excel course – click here.
To learn more about Data Analyst with SAS Course – click here.
To learn more about Data Analyst with R Course – click here.
To learn more about Big Data Course – click here.

Call us to know more