Analytics training institute noida Archives - Page 3 of 3 - DexLab Analytics | Big Data Hadoop SAS R Analytics Predictive Modeling & Excel VBA

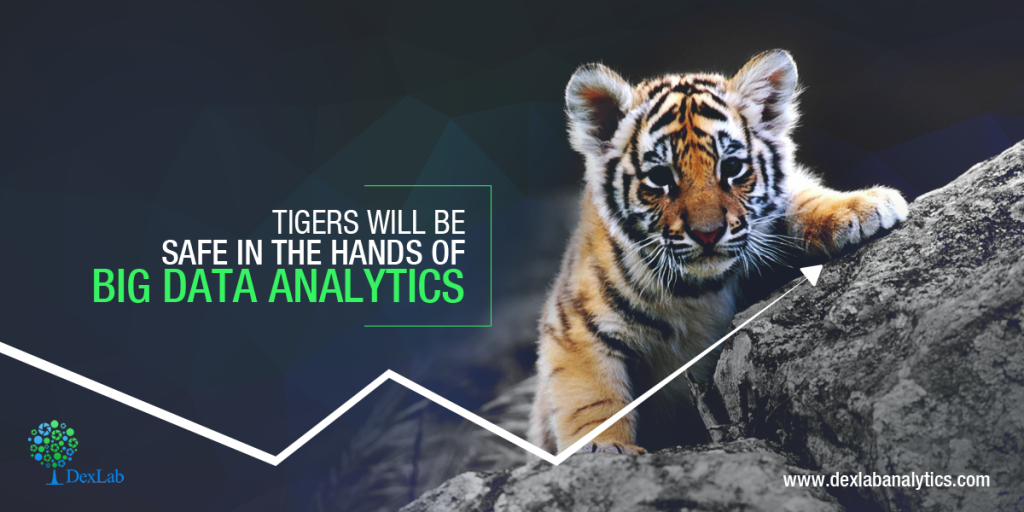
Tigers will be safe in the hands of Big Data Analytics

Once again, good news is in the air for our very own ‘Big Cats’. The very recent reports on Tiger Census have proudly announced the incredible rise in the number from 1,706 to 2, 226 since 2010, when the counting started.

 
Tigers-will-be-safe-in-the-hands-of-Big-Data-Analytics
 

The previous years have seen the major downfall in the number owing to reasons like poaching, environmental degradation, dwindling habitats and of course man- nature conflict . But in contrast, the combined efforts put forwarded by local communities, conservationists and the Government has resulted in the upliftment, as stated by Marco Lambertini, Director General of WWF International.

Continue reading “Tigers will be safe in the hands of Big Data Analytics”

Data-Analytics Driven Insights Still Distrusted By Executives!

While organizations are all words about having data driven decision making to drive their businesses, but maximum of business leaders seem to lack confidence in the information generated from data analytics. But in the rest of the world, demand for analytics training institute is on the rise with every passing day…


Data-Analytics Driven Insights Still Distrusted By Executives!


Data analysis is increasingly becoming central to decision-making in companies, especially in departments where people work towards increasing customer growth, improving productivity, and risk management. But although companies push to make their decision making process more data dependent, it seems business leaders are still more accustomed to taking serious business based on gut instincts and experiences. They still seem to have trouble trusting the insights shared from meticulous data analysis processes. Continue reading “Data-Analytics Driven Insights Still Distrusted By Executives!”

5 Analytics Tools To Improve Your Business Decisions

5 Analytics Tools To Improve Your Business Decisions

Big Data has proved to be inevitable for business organisations in the quest for stepping ahead of their competitors. Nevertheless, only having Big Data at hand does not solve problems. You also need the availability of efficient analytics software that can put your data to the best use.

A business analytics tool is responsible for analysing massive amounts of data in order to extract valuable information. Such information in turn, can be used for improving operational efficiency and for taking better decisions.

2

So, let us here go through the top 10 data analytics tools available in the market.

  • Yellowfin BI

Yellowfin Business Intelligence (BI) is a reporting, dashboard and data analysis software. The software is able to conduct analysis of huge amounts of database, in order to figure out appropriate information. With Yellowfin, your dashboard can be easily accessible from everywhere including company intranet, mobile device or web page.

  • Business Intelligence & Reporting Tools (BIRT)

BIRT is open source software programmed for JAVA and JAVA EE platforms. It consists of a runtime component and a visual report designer, which can be used for creating reports, visual data, and charts and so on. Information gathered from this software can be used for tracking historical data and analysing it and as well as for monitoring ongoing developments in various fields. BIRT can also be used for real-time decision-making purposes.

  • Clear Analytics

Clear Analytics is quite easy to manage as the software is based on Excel spreadsheets. While the software allows you to continue managing data using Excel, it also adds some extra features like reports scheduling, administrative capabilities, version control, governance etc. for better decision making. In short, Clear Analytics can be your choice in case you want high-end performance in exchange of minimal effort.

  • Tableau

Tableau is BI software that provides insight into the data that a business organisation requires for connecting the dots, in order to make clear and effective decisions. Data visualisation in Tableau is much dynamic and elaborative as compared to the other programmes available. Besides, it also provides easier access to data given its extended mobile device support. Additionally, the costs of implementing this program as well as its upgrade are relatively low.

  • GoodData

GoodData is a service BI platform. It takes into account both internal and external datasets (cloud) of an organisation to analyse and provide better governance. The platform is programmed for managing data security and governance thereby, consequently providing the user with the desired results. The most important feature of this platform is that it can analyse datasets of any size, thus making it effective for its users. Recently, the company rebranded their software as an Open Analytics platform.

These are some of the major analytics tools used by organisations irrespective of their scale in order to enhance their business intelligence. Whether you are looking to enhance your career or take better business decisions, a Data analyst certification course can help you to achieve such objectives. Data Analysis helps you to track the competitive landscape and figure out the essentials that needs to be done, in order to get ahead of your competitors. If you are a manager, you can take precise decisions based on quantitative data. Since big data is potential of driving your success, it is your job to master the science and use it for your advantage.


Interested in a career in Data Analyst?

To learn more about Data Analyst with Advanced excel course – Enrol Now.
To learn more about Data Analyst with R Course – Enrol Now.
To learn more about Big Data Course – Enrol Now.

To learn more about Machine Learning Using Python and Spark – Enrol Now.
To learn more about Data Analyst with SAS Course – Enrol Now.
To learn more about Data Analyst with Apache Spark Course – Enrol Now.
To learn more about Data Analyst with Market Risk Analytics and Modelling Course – Enrol Now.
Statistics of Workforce Inequality & Life After Work

Online companies and IT firms have been frequently criticized for their lack of diversity and gender inequality in the work force. So, we researched about some facts and statistics to understand these claims as after all we are data-driven being the premiere Analytics training institute, Pune. We found a gap in several US-based internet firms which have published diversity reports since, 2014 but what they claim has been starkly different from what the truth in the numbers happened to be. Surprisingly, being a developing nation, India has fared quite well in this realm with most of IT MNCs having addressed the issue of gender inequality in their workplace.


Statistics of workforce inequality & life after work


Here are some statistical facts about workplace diversity in internet companies in the US that show lack of diversity:


With majority of people that account for the AP (Advanced Placement) test takers in total only 20 percent were female in the tests for AP computer science test takers as of the data from 2014. Various US-based online corporations have been criticized for their apparent lack of tolerance and unwelcoming nature against females and non-Caucasians. Continue reading “Statistics of Workforce Inequality & Life After Work”

Data analysis resources to keep you updated

Data analysis resources to keep you updated

One should always be proactive about building upon what they already know and have learnt, and with explosion of the web such resources can be obtained fairly easily. The problem is not the availability of resources but the abundance from it. Due to the availability of too many choices it often becomes difficult to gauge if the sources are actually authentic.

2

So, here is a list of books, websites and other resources which we think are authentic:

To stay on top of the latest trends and analyses reports and what’s new in the realm of analytics here are the best latest blogs:

  • FiveThirtyEight: the main man behind this blog is Nate Silver, a data whiz kid, this blog is the place to find out data analysis and visualizations of political, economic and cultural issues. The content in his blogs are usually light-hearted and interactive yet pointed with illustrative examples of data can be used in day-to-day activities.
  • Flowing Data: this is an interesting blog where Dr. Nathan Yau, PhD reveals how the data personnel – like designers, analysts, scientists and statisticians can analyze and visualize data to gather a better understanding of the world around us. It is especially fun to read as Yau offers a funny approach about the regular challenges faced by a data professional in this field. One can also find job recommendations, tutorials and other resources in this blog.
  • Simply statistics: this is another blog that is managed by expert professors each from Ivy League colleges like Johns Hopkins University, Harvard University and the Dana Ferber Cancer Institute. These professors also talk about how data is being used or misused around the world in different industries.
  • Hunch: this blog has been created by John Langford from Microsoft Research, he is the doctor of learning there and his blog talks about machine learning basics of what we know and how we use what we know. This is a good read for those who are new in the field of machine learning and do not yet know how things work in machine learning as it provides an in-depth view of new ideas and events going on in this industry.

To connect to other fellow data scientists and analysts to inquire about questions that may arise while you try the tread the treacherous roads of the data world, these are few communities of data analysts you can follow.

    1. Kaggle competitions: this is a popular community that all data scientists are likely to come across. This is a platform where one can find data prediction competitors. This is a platform where one can search for upcoming competitions in data analysis the website also features a forum where a visitor can ask any question or find a partner for the competition, share resources and ask for support to make a good career in data science.
    2. Metaoptimize: this is a question and answer community for people who are into machine learning, natural language processing, data mining and more. Badges are awarded as per votes on questions are awarded. Thus, making it becomes simpler for the visitors to discover the most popular helpful answers to the questions.
    3. Datatau: this website is best described as hacker news for data scientists and it lives up to this description to the last word. People share career advice with each other; interesting articles are shared amongst the users and then commented upon also the people here share useful information to those new to the world of data analytics.
    4. DexLab Analytics blogs: while DexLab Analytics is one of the leading data analytics training institute in Gurgaon, but they maintain regular blogs about the latest developments in the field of data science and provide India-specific as well global data related news. For students pursuing or aspiring to pursue a career in data science must follow the daily posts from this institute.

In conclusion we would like to add that while there are several resources from where one can obtain valuable information about data analysis. Thus, keeping this list as a starting point you can find several other experts out there to help you learn more about data analytics.


Interested in a career in Data Analyst?

To learn more about Data Analyst with Advanced excel course – Enrol Now.
To learn more about Data Analyst with R Course – Enrol Now.
To learn more about Big Data Course – Enrol Now.

To learn more about Machine Learning Using Python and Spark – Enrol Now.
To learn more about Data Analyst with SAS Course – Enrol Now.
To learn more about Data Analyst with Apache Spark Course – Enrol Now.
To learn more about Data Analyst with Market Risk Analytics and Modelling Course – Enrol Now.

Call us to know more