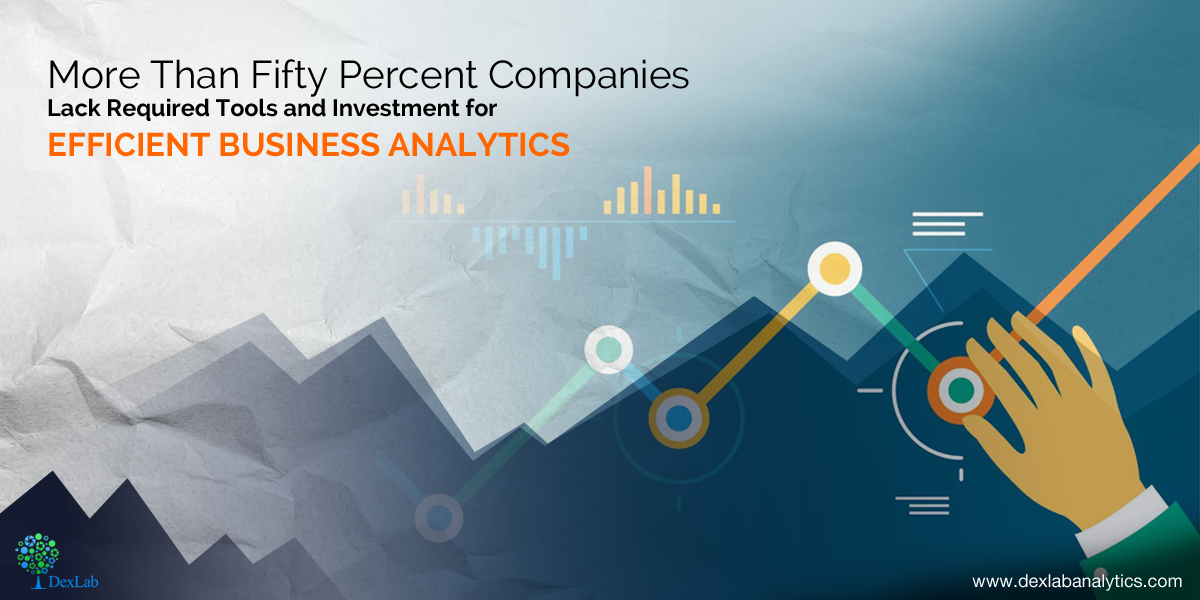
Fifty-nine percent of the companies around the world are not using Predictive Models or Advanced Analytics – says Forbes Insights/Dun & Bradstreet Study.
A recent study by Forbes Insights and Dun & Bradstreet, “Analytics Accelerates Into the Mainstream: 2017 Enterprise Analytics Study,” elucidates the ever-increasing indispensable role that analytics play in today’s business world, all the way from devising strategies to operations. The gloomy Forbes study highlights the crucial need for immediate investment, implementation and prioritization of analytics within companies.
The survey was carried on more than 300 senior executives in Britain, Ireland and North America and the report illuminates that the leading corporate giants need to invest more on the people, the processes they use and technologies that authorize decision support and decision automation.
Bruce Rogers, chief insights officer at Forbes Media was found quoting, “This study underlines the need for continued focus and investment,” he further added, “Without sophisticated analysis of quality data, companies risk falling behind.”
“All analytics are not created equal,” said Nipa Basu, chief analytics officer, Dun & Bradstreet. She explained, “This report shows a critical opportunity for companies to both create a solid foundation of comprehensive business data – master data – and to utilize the right kind of advanced analytics. Those that haven’t yet begun to prioritize implementation of advanced analytics within their organizations will be playing catch-up for a long while, and may never fully recover.”
Key findings revealed:
Need for tools and best practices
Though data usage and consumption growth brags about success, little sophistication is observed in how data are analysed. Only 23% of the surveyed candidates are found to be using spreadsheets for all sorts of data work, while another 17% uses dashboards that are a little more efficient than spreadsheets.
The survey says mere 41% rely on predictive models and/or advanced analytical and forecasting techniques, and 19% of the respondents implement no analytical tools that are more complicated than fundamental data models and regressions.
Skill deficiency stalling analytics success
Twenty seven percent of respondents diagnosed with skill gaps as a major blocker between current data and analytics efforts. Fifty two percent were found to be working with third-party data vendors to tackle such lacks of skills. Moreover, 55% of the surveyed contestants said that third-party analytics partners performs better than those who works in-house, exhibiting both a shortage of analytics capabilities among in-house analysts and a dearth in skilled workers.
Investment crunch
Survey respondents ticked lack of investment and problems with technology as the top hindrances to fulfilling their data strategy goals. Despite the increasing use of data, investment in deft personnel and technology is lagging behind.
CFO’s introspect into data for careful insights
According to the survey, 63% of those who are in the financial domains shared they are using data and analytics to discover opportunities to fund business growth. Further, 60% of the survey respondents revealed they rely on data to boost long-term strategic planning.
To learn more about Data Analyst with Advanced excel course – Enrol Now. To learn more about Data Analyst with R Course – Enrol Now. To learn more about Big Data Course – Enrol Now.
To learn more about Machine Learning Using Python and Spark – Enrol Now. To learn more about Data Analyst with SAS Course – Enrol Now. To learn more about Data Analyst with Apache Spark Course – Enrol Now. To learn more about Data Analyst with Market Risk Analytics and Modelling Course – Enrol Now.
Two decades ago, if someone asked me to write a computer program that played tic-tac-toe, I would have failed horribly. Now being an accomplished computer programmer, I know the desirable tricks to solve tic-tac-toe with the help of “Minimax Algorithm”, and what it takes is just about an hour to jot down the program. No doubt, my coding skills have evolved over the period of time, but also computer science technology has reached unattainable heights.
Computers paved the ways for a startled innovation. When in 1997, IBM introduced a chess-playing computer, known as Deep Blue, which eventually beat world-renowned Grandmaster Garry Kasparov in a six-game match, people remained in awe for years. Following the trend, in 2016, Google’s London-based AI Company, DeepMind launched AlphaGo – and it mastered over the ancient board game Go. Computers have outplayed the best human players in the games of chess, draughts and backgammon, now it’s time for Go.
The technology goes on thriving, beating humans at games. In late May, AlphaGo is all set to take on its human rival Ke Jie, the best player in the world during the Future of Go Summit in Wuzhen, China. Games, which solely relied on human intelligence, wit, intuition, discern is now excelled by the AI, which is powered by improved engineering and computer superiority.
Don’t you think this is great! Where AI is driving our cars, looking for ways to cure deadly cancer and helping us in everyday work, winning at Go takes AI a step ahead. It not only makes the games more fun and exciting, but endlessly enjoyable.
The strategy explained
In the eastern part of the world, notably in China, Japan and South Korea, Go is extremely popular and many celebrities indulge in it. The game developers showed interest for long in the complexity of this game. However, the rules are simple – the main objective is to secure the maximum territories by placing and capturing black and white stones on a 19×19 grid.
Chess is less complicated than Go; in the latter, the chances of recognising wins and losses is relatively tougher, as stones possess equal values, and ensures understated impacts throughout the board. To play Go, AlphaGo program implemented deep learning in neural networks – a brain-stimulated program. The connections formed here runs in-between layers of simulated neurons, further strengthened by examples and experiences. Firstly, it analysed 30 million positions from expert games, while gaining abstract information about the state of play from the board data, just like other programmes that classify images from pixels. After all this, finally it played against itself over 50 computers to improve its performance, with each iteration and this came to be known as reinforcement learning.
The round of applause
“AlphaGo plays in a human way”, says Fan – DeepMind’s program AlphaGo beat Fan Hui, the European Go champion. He further added, “If no one told me, maybe I would think the player was a little strange, but a very strong player, a real person.” “The program seems to have developed a conservative (rather than aggressive) style”, adds Toby Manning, a veteran Go player and a referee.
To learn more about Data Analyst with Advanced excel course – Enrol Now. To learn more about Data Analyst with R Course – Enrol Now. To learn more about Big Data Course – Enrol Now.
To learn more about Machine Learning Using Python and Spark – Enrol Now. To learn more about Data Analyst with SAS Course – Enrol Now. To learn more about Data Analyst with Apache Spark Course – Enrol Now. To learn more about Data Analyst with Market Risk Analytics and Modelling Course – Enrol Now.
Self Service Analytics is proving useful for business users, who are working on business data without necessarily having a background in technology and statistics. It is essentially bridging the gap between trained data analysts and normal business users.
Following are the characteristics of Self Service Analytics:
Business Users Independence:
Self Service Analytics reduces dependency on IT and Data warehousing teams, thereby reducing the turnaround time for a request made by a business user.
It does so by continuously collating and loading real time data into a singular stream without disparity, which is easily accessible through browsers. Thus, it helps business users in taking decisions on Real-Time basis.
This feature benefits organizations because vital decisions made within time can be more profitable as compared to the traditional way of analysing data, which may not be a good idea in respect to the urgency constraint.
Easier and Reduced Cost of Operations:
Often, the company’s data are fragmented and widespread across various divisions. This increases the headache of channelling the data meaningfully and in a wholesome manner.
Further to this, preparing reports using this data becomes a cumbersome job for the IT department or the department, which is serving such request. Hence, it may lead to increased cost of time or decreased quality of efficiency at which the operations have to run. However, many a times, these reports fail to give an overview of the operations in an organisation.
Self-service BI integrates data from different systems and delivers a “Single Version of Truth”. Accessing this data and running computations on it requires only a browser for access and eliminates the need to install, maintain and administer large-footprint software clients on each user’s workstation.
If Self Service Analytics is hosted on SaaS, it will further reduce the cost of machinery and maintenance associated with it. The provision for usage can be increased or decreased in no time according to the usage pattern. This really means that Self Service Analytics helps you adapt with time and Pay-Per-Use model, which is a leading trend in most of the industries.
Resolving the conflict over accuracy:
Typically, a business user using Excel would have a local copy of data and run computations on it. He can merge and transform it by using various formulas and finally derive a conclusion.
This is dangerous because in live operations, data keeps changing and data integrity is at stake by working on local copies. Thus, accuracy in decision-making becomes a game of luck.
In Self Service BI, the data from the source is extracted, transformed and loaded into a unique data model, which goes with all operations. In this case, data integrity is assured. In addition, all business users have the same source of data, removing the risk that working with different local copies have.
Therefore, from the above stated facts, we can conclude that Self Service Analytics is a need for today’s businesses.
However, there are a few risks involved in Self Service Business Analytics:
Loose corporate governance and make data available to business users directly may be taken advantage of in an undue manner.
Business users may not be properly trained or skilled to make decisions.
Relying heavily on any tool without some real life experience and insight into the background of that data can result into an impaired decision-making.
If all the above-mentioned risks are mitigated and proper corporate governance structure is in place, Self Service Analytics can be very beneficial for the success of any organization.
To learn more about Data Analyst with Advanced excel course – Enrol Now. To learn more about Data Analyst with R Course – Enrol Now. To learn more about Big Data Course – Enrol Now.
To learn more about Machine Learning Using Python and Spark – Enrol Now. To learn more about Data Analyst with SAS Course – Enrol Now. To learn more about Data Analyst with Apache Spark Course – Enrol Now. To learn more about Data Analyst with Market Risk Analytics and Modelling Course – Enrol Now.
Considering the complex competitive global environment, the world business today is witnessing a paradigm shift from mere data storage to data mining and other subsequent activities.
Thus, from a managerial perspective it is of prime importance to develop a psyche, which can interpret the collection of data. This psyche cannot be theoretically learnt from books, as it requires a knack to make data talk. Data is no more evaluated independently. Today, a cross-domain relationship between data exists, which on analysis depicts patterns, responsible enough to do wonders for the organization.
The question is how can we connect the dots? Following the recent trends, developers are grabbing every opportunity to break a huge chunk of data into meaningful relevant information. From the standpoint of technical professionals, along with an analytical mindset, they need to get hands on experience on the technological perspective to understand the real significance of data evaluation.
The data not only aligns with the internal activity of the business but also is an integral part for consumer servicing. There is an intense need to study the needs of consumer and every decision he makes, which broadens the outlook of a business on how he/she is using their product. What are the expectations of the customer from an existing product? What more my customer needs? The answers to these questions cannot always be mapped quantitatively but a qualitative approach towards data is one of the key aspects of data analytics.
In this digital era, slightest technological ripples are going to reshuffle the whole industry scenario. And, that is why the omnipresence of data will aid businesses in setting new benchmarks in consumer and market findings. Growing pace of social media would open a Pandora’s Box for companies, who have their right audience in this particular domain.
The emergence of IOT, which primarily thrives on data, will cause disruption in the current business orientation. The data producing sensor architecture directly connected to the company can help the business to be fast and robust, which is the need of an hour. In addition, this analytics might influence mid-size distribution largely.
Simple example of this model: Sensors attached to tyres could sense data, and alert a tyre manufacturer about the usage of a consumer, which will help in servicing their customer at the right moment.
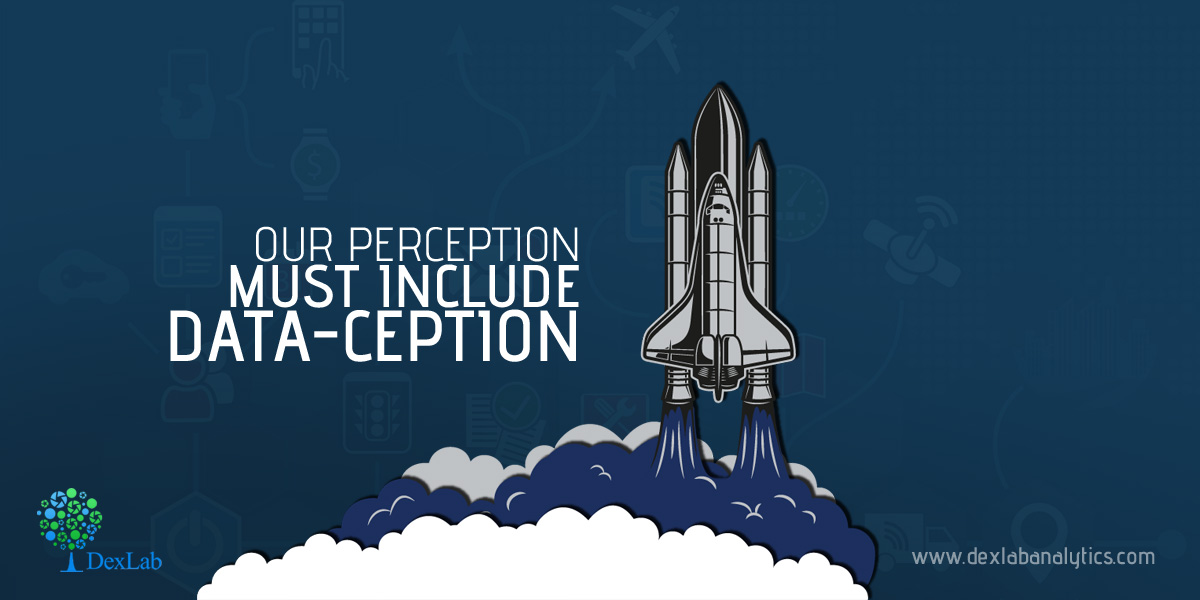
Thus, on an individualistic note there is need to develop a data analytical mindset and include data-ception in perception.
To learn more about Data Analyst with Advanced excel course – Enrol Now. To learn more about Data Analyst with R Course – Enrol Now. To learn more about Big Data Course – Enrol Now.
To learn more about Machine Learning Using Python and Spark – Enrol Now. To learn more about Data Analyst with SAS Course – Enrol Now. To learn more about Data Analyst with Apache Spark Course – Enrol Now. To learn more about Data Analyst with Market Risk Analytics and Modelling Course – Enrol Now.
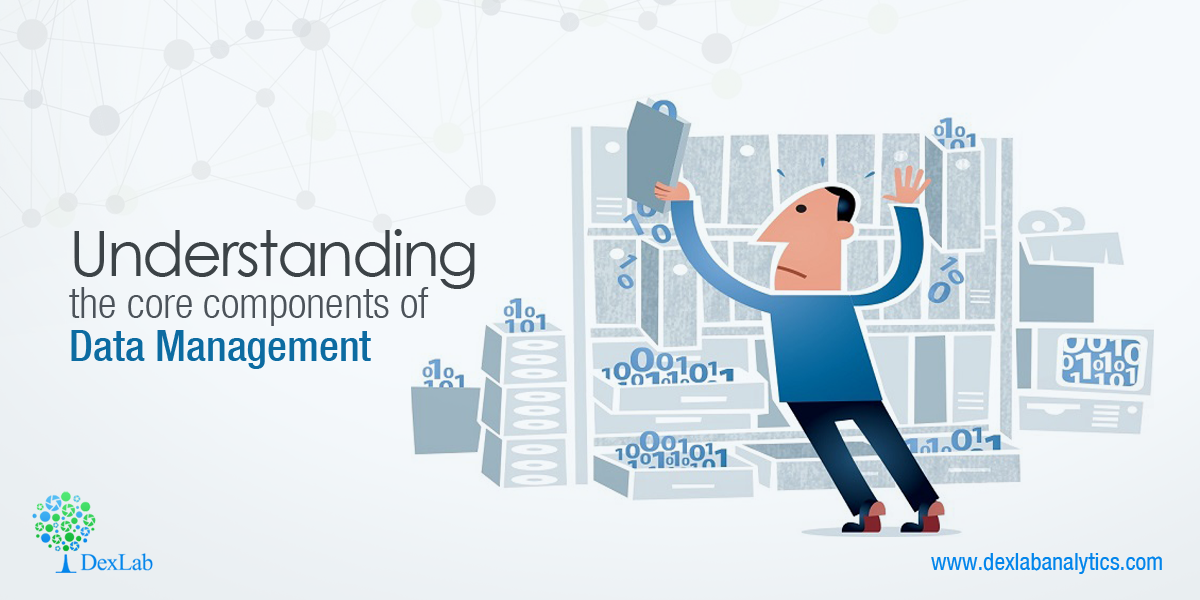
Ever wondered why many organizations often find it hard to implement Big Data? The reason often is poor or non-existent data management strategies which works counterproductive.
Data cannot be delivered or analysed without proper technology systems and procedural flows data can never be analysed or delivered. And without an expert team to manage and maintain the setup, errors, and backlogs will be frequent.
Before we make a plan of the data management strategies we must consider what systems and technologies one may need to add and what improvements can be made to an existing processes; and what do these roles bring about in terms of effects with changes.
However, a much as is possible any type of changes should be done by making sure a strategy is going to be integrated with the existing business process.
And it is also important to take a holistic point of view, for data management. After all, a strategy that does not work for its users will never function effectively for any organization.
With all these things in mind, in this article we will examine each of the three most important non-data components for a successful data management strategy – this should include the process, the technology and the people.
Recognizing the right data systems:
There is a lot of technology implemented into the Big Data industry, and a lot of it is in the form of a highly specific tool system. Almost all of the enterprises do need the following types of tech:
Data mining:
This will isolate specific information from a large data sets and transform it into usable metrics. Some o the familiar data mining tools are SAS, R and KXEN.
Automated ETL:
The process of ETL is used to extract, transform, and also will load data so that it can be used. ETL tools also automate this process so that human users will not have to request data manually. Moreover, the automated process is way more consistent.
Enterprise data warehouse:
A centralised data warehouse will be able to store all of an organization’s data and also integrate a related data from other sources, this is an indispensible part of any data management plan. It also keeps data accessible, and associates a lot of kinds of customer data for a complete view.
Enterprise monitoring:
These are tools, which provide a layer of security and quality assurance by monitoring some critical environments, with problem diagnosing, whenever they arise, and also to quickly notify the team behind analytics.
Business intelligence and reporting, Analytics:
These are tools that turn processed data into insights, that are tailored to extract roles along with users. Data must go to the right people and in the right format for it to be useful.
Analytics:
And in analytics highly specific metrics are combined like customer acquisition data, product life cycle, and tracking details, with intuitive user friendly interfaces. They often integrate with some non-analytics tools to ensure the best possible user experience.
So, it is important to not think of the above technologies as simply isolated elements but instead consider them as a part of a team. Which must work together as an organized unit.
To learn more about Data Analyst with Advanced excel course – Enrol Now. To learn more about Data Analyst with R Course – Enrol Now. To learn more about Big Data Course – Enrol Now.
To learn more about Machine Learning Using Python and Spark – Enrol Now. To learn more about Data Analyst with SAS Course – Enrol Now. To learn more about Data Analyst with Apache Spark Course – Enrol Now. To learn more about Data Analyst with Market Risk Analytics and Modelling Course – Enrol Now.
When you work in the SEO and PPC industry it is a giveaway that you will be handing a large amount of data. While there are several ways you can utilize this data and manage it with Excel functions, and several tutorials are available online to talk about them. But what if you do not have the functions on Excel to do what you have to do with the data. You can use the Visual Basic for Applications (VBA) feature in MS Excel and write your own functions to help Excel carry out the functions that you want it to.
So, here in this advanced Excel trainingblog post, we will discuss about how to write a simple custom Excel function and will also give you readers some general advice on how to get started with Excel VBA.
Getting started with the Excel VBA editor:
First in order to work with the VBA editor in Excel, you must open a new Excel workbook or document and then press the following keys on your keyboard – ALT + F11. This will open a new window on the screen which is the VBE (Visual Basic Editor). This is where you can write your own Excel functions to use with the spreadsheet you have opened in your Excel document. This will be highlighted on the top left corner of the window. The project explorer pane will have the icons for each sheet of the document and another one for the whole of the workbook itself.Then for the next step, right-click on the ‘ThisWorkbook’, and then go to ‘Insert’ and then ‘Module’ options. That will further add a code module along with a container for the code which we will learn to write here.
Now you are ready to write your first Excel function:
Data analysis will help you analyze the keywords:
Each element of the data gathered through the SEO and PPC will often have keywords and phrases and this can give birth to a large amount of data for people to work with. For a recent piece of analysis, our faculty member was asked to find a method for counting the number of words in a search term. In this way single keywords can be dealt with differently in comparison to phrases. Like for e.g. ‘dresses’ can be treated with a stark difference to the term ‘red party dresses’. But there are often 100s or even 1000s of keywords to work with and it will be too time consuming to manually count the number of words in each phrase. Also there are no in-built functions in MS Excel to do so for us. Hence, we must use VBA to write new functions for us.
Adding the code:
Function countWords(phrase as string) as Integer
This will be the first line of the function you are about to write, start by copying it into the module we just created. Copy it under the words ‘Option Explicit’ which should be anyway entered (if it is not then do not worry, just copy it at the top and we can come to this later). This sentence however, has a lot of important things to tell us about.
Function: this first word itself tells us about which code is going to follow. A function is simply a piece of code that takes one or more values, performs something with them and then returns a different value. For instance, there is a built-in function with Excel called SUM. This function may take some input values and add them together to return a different value which is the sum total of the inputs. Similarly the function we create will take the keywords or phrases as an input and then count the number of words in them, then return a value for that number.
CountWords: we have put this as the name of our function. The moment we wish to use it, we can simply input into the spreadsheet cell the words as ‘countWords’. Just like we would add ‘SUM’ to use the sum function.
Phrases as string: this is the input will be the one to be entered when we will need to search a keyword or phrase.
As integer: this is the type of information which will be returned by the function. We are only interested in the number of the whole words in the phrases and hence are aiming to return an integer value.
How to prepare the function:
The next thing to do is to prepare the function by declaring the variables. Here we will declare the variables in ‘countWords’ as integers because it is built to only take integers. This will allow Excel to warn us if anything unexpected happens. For example, if we want to use a function to count the words in ‘red party dresses’ and it only returns with party. This will mean that something has gone wrong for sure. So, with declaration of the variable we will be able to let Excel know that it is not an integer and hence it will return with an error warning.
The variables we will use in this function are going to be called as ‘I’ and ‘counter’, however, there is no hard and fast rule to name your variables this way, you can name it the way you like. But ‘I’ is usually used as an abbreviation for index and counter will just be used as counter. The next step will be to add this line into your code.
‘Counts number of occurrences of space character in a phraseDim i as integerDim counter as integer: counter = 1
Note that ‘dim’ here is short for dimension. This describes the data type of a variable. We have told Excel through our codes that the variable ‘counter’ will always be an integer. We have also given the initial value as 1. But currently ‘I’ has no value assigned to it. The first line should appear green in the code window, this is mostly because of the apostrophe that precedes it. This line in our code is merely a comment and does not do anything within the code. It only exists as a label to let us know what the use of the code is for. It is a good practice to comment your code as otherwise it often becomes very hard to understand it otherwise. Also feel free to add in your own comments throughout to help understand and all you have to do for it is to add an apostrophe before it.
How can you count the words?
You must understand that Excel has no preconceived notions about what a word is. So to count them the concept has to be broken down for it to understand in a few short steps. One of the key features of a word is that it has a space either after or before or even at times in between it, and often both.
So we can start by simply telling Excel to count these spaces:
For i = 1 To Len(phrase)
If Mid(phrase, i, 1) = ” ” Thencounter =
counter + 1
End If
Next i
This is one of the key areas of this function, you must paste it or type it out in the code module. You can do so line-by-line as well. But here is an explanation of what is happening with each step:
For i = 1 To Len(phrase)
Here we have given ‘i’ a value, in fact not just one value but a range of values from 1 to Len (phrase). This is a built-in function with Excel that may return the number of characters (letters + spaces) in the phrase we pass it in. f Mid(phrase, i, 1) = ” ” Then
With this line of the code we are using the ‘Mid’ function in excel. This will ask excel to look into each character in the phrases in turn. This function takes 3 inputs which is – the phrases to be looked at, the character to begin comparison on, and the number of characters to compare with. We aim to compare every letter with one at a time approach. So, we would pass on ‘I’ and 1. And then finally the ‘If’ statement which says that if a character uses spaces, then excel should proceed to the next line of code. Or pass it over to the ‘End If’ statement.
counter = counter + 1
This line is only activated when a space is discovered. So, we increase our counter variables by 1 every time to count the number of spaces in the phrase.
End If Next i
With the above two lines, we are able to let Excel know where the If statement ends and to go back to the top and the start again for the next value of ‘i’. This is called as a ‘For Loop’ as we letting Excel know that it must repeat this task for a certain number of iterations.
There is also one last piece of code which we will make use of in order to handle a particular situation. When the phrase is passed in is blank. Then copy the following with what you already have:
If phrase = “” Then
countWords = 0
Else
countWords = counter
End If
Here is another statement that we have. If the phrase we input is blank, countWords takes the value 0, or else it will take the value of the ‘counter’ variable. After setting the ‘counter’ to 1 initially, we ensure the code will work for single words. However, it may also return 1 for blank phrases, and this prevents errors from occurring.
End Function
Finally with that we tell excel that we have finished defining our function. Here is the full code as mentioned below, check if yours looks the same or not:
Image Source: us.searchlaboratory.com
After you are done, you can close the VBE by clicking on the ‘X’ in the corner and then going back to the spreadsheet. Once done type in some words in a few cells and then type ‘countWords’ in another cell. And then click one of your cells containing the texts and then close the parenthesis. This cell can now contain the number of words in the cell that we have input. If it doesn’t, then we can set it to ‘automatic’ (Formulas > Calculations Options > Automatic in Excel 2010.
This simple function works best to save time as it can be dragged down over as many cells as you’d like, with hundreds of keywords and phrases. However, you must keep its limitations in mind. We are counting the spaces and not just words.
Interested in a career in Data Analyst?
To learn more about Data Analyst with Advanced excel course – Enrol Now. To learn more about Data Analyst with R Course – Enrol Now. To learn more about Big Data Course – Enrol Now.
To learn more about Machine Learning Using Python and Spark – Enrol Now. To learn more about Data Analyst with SAS Course – Enrol Now. To learn more about Data Analyst with Apache Spark Course – Enrol Now. To learn more about Data Analyst with Market Risk Analytics and Modelling Course – Enrol Now.
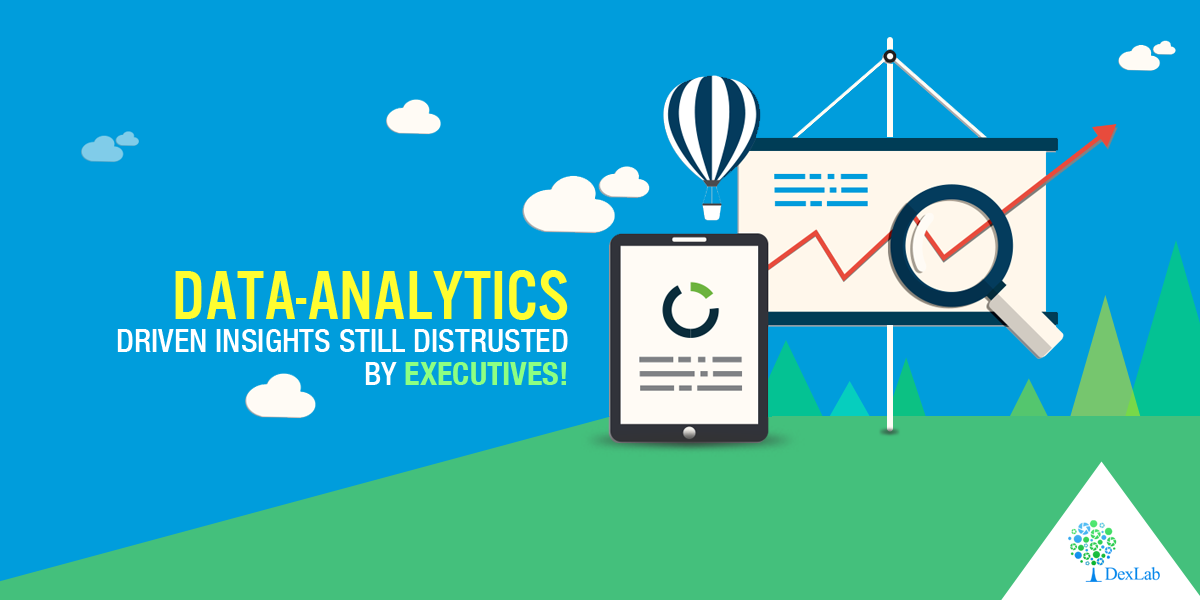
While organizations are all words about having data driven decision making to drive their businesses, but maximum of business leaders seem to lack confidence in the information generated from data analytics. But in the rest of the world, demand for analytics training institute is on the rise with every passing day…
Data analysis is increasingly becoming central to decision-making in companies, especially in departments where people work towards increasing customer growth, improving productivity, and risk management. But although companies push to make their decision making process more data dependent, it seems business leaders are still more accustomed to taking serious business based on gut instincts and experiences. They still seem to have trouble trusting the insights shared from meticulous data analysis processes.Continue reading “Data-Analytics Driven Insights Still Distrusted By Executives!”