analytics training institute in Delhi Archives - DexLab Analytics | Big Data Hadoop SAS R Analytics Predictive Modeling & Excel VBA

What are the Job Opportunities Available in the Field of AI?

What are the Job Opportunities Available in the Field of AI?

Artificial Intelligence or, AI is an advanced technology that is busy taking the world in its strides. With virtual assistants, face recognition, NLP, object detection, data crunching becoming familiar terms it is no wonder that this dynamic technology is being integrated into the very fabric of our society. Almost every sector is now adopting AI technology, be it running business operations or, ensuring error-free diagnosis in the healthcare domain, the exponential growth of this technology is pushing the demand for skilled AI professionals who can monitor and manage the AI operations of an organization.

Since AI is an expansive term and branches off in multiple directions, the job opportunities available in this field are also diverse. According to recent studies, AI jobs are going to be the most in-demand jobs in the near future.  Multiple job roles are available that come with specific job responsibilities. So, let’s have a look at some of these.

Machine Learning Engineer

An machine learning engineer is supposed to be one of the most in-demand jobs available in this field, the basic job of an ML engineer center round working on self-running software, and they need to work with a huge pile of data. In an organization, the machine learning engineers need to collaborate with data scientists and ensure that real-time data is being put to use for churning out accurate results. They need to work with data science models and develop algorithms that can process the data and offer insight. Mostly their job responsibility revolves around working with current machine learning frameworks and working on it to make it better. Re-training machine learning models is another significant responsibility they need to shoulder.

If recent statistics are to be believed the salary of a machine learning hovers around ₹681,881 in India.

Artificial Intelligence Engineer

AI engineers are indeed a specialized breed of professionals who are in charge of AI infrastructure and work on AI models. They work on designing models and then test and finally, they need to deploy these models. Automating functionalities is also important and most importantly they must understand the key problems that need AI solutions. AI engineers need to write programs, so they need to be familiar with several programming languages, having a background in Machine Learning Using Python could be a big help. Another important responsibility is creating smart AI algorithms for developing an AI system, as per the specific requirement that needs to be solved using that system. 

In India, an AI engineer could expect the salary to be around ₹7,86,105 per year, as per Glassdoor figures.

Data Scientist

A data scientist is going to be in charge of the data science team and need to work on the huge volumes of data to analyze and extract information, build and combine models and employ machine learning, data mining, techniques along with utilizing numerous tools including visualization tools to help an organization reach its business goals. The data scientists need to work with raw data and he needs to be in charge of automating the collection procedure and most importantly they need to process and prepare data for further analysis, and present the insight to the stakeholders.

A data scientist could earn around ₹ 7,41,962 per year in India as per the numbers found on Indeed.

Data Science Machine Learning Certification

AI Architect

An AI architect needs to work with the AI architecture and assess the current status in order to ensure that the solutions are fulfilling the current requirements and would be ready to scale up to adapt to the changing set of requirements that would arise in the future. They must be familiar with the current AI framework that they need to employ to develop an AI infrastructure that is sustainable. Along with working with a large amount of data, an AI architect must be employing machine learning algorithms and posses a thorough knowledge of the product development, and suggest suitable applications and solutions.

In India an AI architect could expect to make around ₹3,567K  per year as per Glassdoor statistics is concerned.

There are so many job opportunities available in the AI domain, and here only a few job roles have been described. There are plenty more diverse job opportunities await you out there, grab those, just get artificial intelligence certification in delhi ncr and be future-ready.


.

A Guide To Different Types Of Business Analytics

A Guide To Different Types Of  Business Analytics

Businesses today can no longer afford to run based on assumptions, they need actionable intel which can help them formulate sharper business strategies. Big data holds the key to all the information they need and the application of business analytics strategies can help businesses realize their goals. Business analytics is about collecting data and processing it to glean valuable business information. Business analytics puts statistical models to use to access business insight. It is a crucial branch of business intelligence that applies cutting edge tools to dissect available data and detect the patterns to predict market trends and doing business analysis training in delhi can help a professional in this field in a big way.

Different types of business analytics:

Business analytics could be broken down into four different segments all of which perform different tasks yet all of these are interrelated. The types are namely Descriptive Analytics, Diagnostic Analytics, Predictive Analytics, and Prescriptive Analytics. The role of each is to offer a thorough understanding of the data to predict future solutions. Find out how these different types of analytics work.

Descriptive Analytics: Descriptive analytics is the simplest form of analytics and the term itself is self-explanatory enough. Descriptive analytics is all about presenting a summary of the data a particular business organization has to create a clear picture of the past trends and also capturing the present situation. It helps an organization to understand what are the areas that need attention and what are their strengths. Analyzing historical data the existence of certain trends could be identified and most importantly could also offer some valuable insight towards developing some plan. Usually, the size of the data both structured and unstructured are beyond our comprehension unless it is presented in some coherent format, something that could be easily ingested. Descriptive analytics performs that function with the help of data aggregation and data mining techniques. For improving communication descriptive analytics helps in summarizing data that needs to be accessible to employees as well as to investors.

Diagnostic Analytics: Diagnostic analytics plays the role of detecting issues a company might be facing. When the entire data set is presented comprehensively, it is time for diagnosis of the patterns detected and detecting issues that might be causing harm. Now, this business analytics dives down deeper into the problem and offers an in-depth analysis to bring out the root cause of the problem. The diagnostic analytics concerns itself with the problem finding aspect by reading data and extracting information to find out why something is not working or, working in a way that is giving considerable trouble. Usually, principle components analysis, conjoint analysis, drill-down, are some of the techniques employed in this specific branch of analytics. Diagnostic analytics takes a critical look at issues and allows the management to identify the reasons so that they can work on that.

Predictive Analytics:  Predictive analytics is sophisticated analytics that is concerned about taking the results of descriptive analytics and working on that to forecast probabilities. It does not predict an outcome but, it suggests probabilities by combining statistics and machine learning. It takes a look at the past data mainly the history of the organization, past performances, and also takes into account the current state and on the basis of that analysis it suggests future trends. However, predictive analytics does not work like magic, it does its job based on the data provided and so, data quality matters here. High quality, complete data ensures accurate prediction, because the data is analyzed to find patterns and further prediction takes off from there. This type of analytics plays a key role in strategizing, based on the forecasts the company can change the sales and marketing strategy and set a new goal.

Prescriptive Analytics: With prescriptive analytics, an organization can find a direction as it is about suggesting solutions for the future. So, it suggests the possible trends or, outcomes, and based on that this analytics can also suggest actions that could be taken to achieve desired results. It employs simulation and optimization modeling to predict which should be the ideal course of action to reach a certain goal. This form of analytics offers recommendations in real-time, it could be thought of as the next step of predictive analytics. Here not just the data previously stored is put to use, but, real-time data is also utilized, in fact, this type of analytics also takes into account data coming from external sources to offer better results.

Data Science Machine Learning Certification

Those were the four types of business analytics that are employed by data analysts to offer sharp business insight to an organization. However, there needs to be skilled people who have done Business analyst training courses in Gurgaon to be able to carry out business analytics procedure to drive organizations towards a brighter future.


.

A Quick Guide to Data Visualization

A Quick Guide to Data Visualization

The growing significance of big data and the insight it imparts is of utmost significance. Data scientists are working round the clock to process the massive amount of data generated every day. However, unless you have been through Data Science training, it would be impossible for you to grasp even an iota of what is being communicated through data.

The patterns, outliers every single important factor that emerged through decoding must be presented in a coherent format for the untrained eyes. Data visualization enables the researchers to present data findings visually via different techniques and tools to enable people to grasp that information easily.

Why data visualization is so vital?

The complicated nuances of data analysis is not easier for anybody to understand. As we humans are programmed to gravitate towards a visual representation of any information, it makes sense to convey the findings through charts, graphs, or, some other way. This way it takes only a couple of moments for the marketing heads to process what is the trend to watch out for. 

We are used to seeing and processing the information presented through bars and pie charts in company board meetings, people use these conventional models to represent company sales data.

It only makes sense to narrate what the scientists have gathered from analyzing complex raw data sets, via visual techniques to an audience who needs that information to form data-driven decisions for the future.

So what are the different formats and tools of data visualization?

Data visualization can take myriad forms which may vary in the format but, these all have one purpose to serve representing data in an easy to grasp manner. The data scientist must be able to choose the right technique to relate his data discovery which should not only enlighten the audience but, also entertain them.

The popular data visualization formats are as follows

Area Chart
Bubble Cloud/Chart
 Scatter Plot
Funnel Chart
Heat Map
The formats should be adopted in accordance with the information to be communicated

Data scientists also have access to smart visualization tools which are

  • Qlikview
  • Datawrapper
  • Sisense
  • FusionCharts
  • Plotly
  • Looker
  • Tableau

A data scientist must be familiar with the tools available and be able to decide on which suits his line of work better.

What are the advantages of data visualization?

Data visualization is a tricky process while ensuring that the audience does not fall asleep during a presentation, data scientists also need to identify the best visualization techniques, which they can learn during big data training in gurgaon to represent the relationship, comparison or, some other data dynamic.
If and when done right data visualization  has several benefits to offer

Enables efficient analysis of data

In business, efficient data interpretation can help companies understand trends. Data visualization allows them quickly identify and grasp the information regarding company performance hidden in the data and enables them to make necessary changes to the strategy.

Identify connections faster

While representing information regarding the operational issues of an organization,  data visualization technique can be of immense help as it allows to show connections among different data sets with more clarity. Thereby enabling the management to quickly identify the connecting factors. 

Better performance analysis

Using certain visualizing techniques it is easier to present a product or, customer-related data in a multi-dimensional manner. This could provide the marketing team with the insight to understand the obstacles they are facing. Such as the reaction of a certain demographic to a particular product, or, it could also be the demand for certain products in different areas.  They are able to act faster to solve the niggling issues this way.

Adopt the latest trends

 Data processing can quickly identify the emerging trends, and with the help of data visualization techniques, the findings could be quickly represented in an appealing manner to the team. The visual element can immediately communicate which trends are to watch out for and which might no longer work.

Data Science Machine Learning Certification

 Encourages interaction

Visual representation of data allows the strategists to not just look at numbers but, actually understand the story being told through the patterns. It encourages interaction and allows them to delve deeper into the patterns, instead of just merely looking at some numbers and making assumptions.

Data visualization is certainly aiding the businesses to gain an insight that was lost to them earlier. A data scientist needs to be familiar with the sophisticated data visualization tools and must strike a balance between the data and its representation. Identifying what is unimportant and which needs to be communicated as well as finding an engaging visual technique to quickly narrate the story is what makes him an asset for the company.  A premier Data analyst training institute can help hone the skills of an aspiring data scientist through carefully designed courses.


.

How Legal Analytics Can Benefit Law Firms?

How Legal Analytics Can Benefit Law Firms?

As different sectors are waking up to realize the significance of big data, the law firms are also catching up. After all it is one of the sectors that have to deal with literally massive amounts of data.

The popularity of legal analytics software like Premonition is a pointer to the fact that even though the industry was initially slow on the uptake, it is now ready to harness the power of big data to derive profit.

 So what exactly is legal analytics?

Legal analytics involves application of data analysis to mine legal documents and dockets to derive valuable insight. Now there is no need to confuse it with legal research or, to think that it is an alternative to the popular practice. Legal analytics is all about detecting patterns in past case records to enable firms strategize better in future. It basically aims to offer aid in legal research. Training received in an analytics lab could help a professional achieve proficiency.

Legal analytics platform combines sophisticated technologies of machine learning, NLP. It goes through past unstructured data and via cleaning and organizing that data into a coherent structure it analyzes the data to detect patterns.

How law firms can benefit from legal analytics?

Law firms having to deal with exhaustive data holding key information can truly gain advantage with the application of legal analytics. Primarily because of the fact it would enable them to anticipate what the possible outcome might be in order to strategize better and increase their chances of turning a case in their favor. Data Science training could be of immense value for firms willing to adopt this technology.

Not just that but implementation of legal analytics could also help the law firms whether big or, small run their operations and market their service in a more efficient manner and thereby increasing the percentage of ROI.

The key advantages of legal analytics could be as followed

  • The chances of winning a case could be better as by analyzing the data of past litigations, useful insight could be derived regarding the key issues like duration, judge’s decision and also certain trends that might help the firm develop a smarter strategy to win a particular case.
  • Cases often continue for a long period before resulting in a loss. To save money and time spent on a particular case, legal analytics could help lawyers decide whether to continue on or, to settle.
  • Often legal firms need to hire outside expertise to help with their case, the decision being costly in nature must be backed by data. With legal analytics it would be easier to go through data regarding a particular candidate and his performance in similar cases in the past.
  • There could be a significant improvement in the field of operational efficiency. In most of the situations lawyers spend huge amount of time in sorting through case documents and other data. This way they are wasting their time in finding background information when they could be spending time in offering consultation to a potential client and securing another case thereby adding financial benefit to the firm. The task of data analysis should better be handled by the legal analytics software.  
  • At the end of the day a law firm is just another business, so, to ensure that the business operations of the firm are being managed with efficiency, legal analytics software could come in handy. Whether it’s budgeting or, recruiting or retaining old staff valuable insight could be gained, which could be channeled to rake in more profit.

Data Science Machine Learning Certification

There has been an increase in the percentage of law firms which have adopted legal analytics, but, overall this industry is still showing reluctance in fully embracing the power. The professionals who have apprehension they need to set aside the bias they have and recognize the potential of this technology. May be they should consider enrolling in a Data analyst training institute to gain sharper business insight.


.

The Data Science Life Cycle

The Data Science Life Cycle

Data Science has undergone a tremendous change since the 1990s when the term was first coined. With data as its pivotal element, we need to ask valid questions like why we need data and what we can do with the data in hand.

The Data Scientist is supposed to ask these questions to determine how data can be useful in today’s world of change and flux. The steps taken to determine the outcome of processes applied to data is known as Data Science project lifecycle. These steps are enumerated here.

  • Business Understanding

Business Understanding is a key player in the success of any data science project. Despite the prevalence of technology in today’s scenario it can safely be said that the “success of any project depends on the quality of questions asked of the dataset.”One has to properly understand the business model he is working under to be able to effectively work on the obtained data.

  • Data Collection

Data is the raison detre of data science. It is the pivot on which data science functions. Data can be collected from numerous sources – logs from webservers, data from online repositories, data from databases, social media data, data in excel sheet format. Data is everywhere. If the right questions are asked of data in the first step of a project life cycle, then data collection will follow naturally.

  • Data Preparation

The available Data set might not be in the desired format and suitable enough to perform analysis upon readily. So the data set will have to be cleaned or scrubbed so to say before it can be analyzed. It will have to be structured in a format that can be analyzed scientifically. This process is also known as Data cleaning or data wrangling. As the case might be, data can be obtained from various sources but it will need to be combined so it can be analyzed.

For this, data structuring is required. Also, there might me some elements missing in the data set in which case model building becomes a problem. There are various methods to conduct missing value and duplicate value treatment.

“Exploratory Data Analysis (EDA) plays an important role at this stage as summarization of clean data helps in identifying the structure, outliers, anomalies and patterns in the data.

These insights could help in building the model.”

  • Data Modelling

This stage is the most, we can say, magical of all. But ensure you have thoroughly gone through the previous processes before you begin building your model. “Feature selection is one of the first things that you would like to do in this stage. Not all features might be essential for making the predictions. What needs to be done here is to reduce the dimensionality of the dataset. It should be done such that features contributing to the prediction results should be selected.”

“Based on the business problem models could be selected. It is essential to identify what is the task, is it a classification problem, regression or prediction problem, time series forecasting or a clustering problem.” Once problem type is sorted out the model can be implemented.

“After the modelling process, model performance measurement is required. For this precision, recall, F1-score for classification problem could be used. For regression problem R2, MAPE (Moving Average Percentage Error) or RMSE (Root Mean Square Error) could be used.”The model should be a robust one and not an overfitted model that will not be accurate.

Data Science Machine Learning Certification

  • Interpreting Data

This is the last and most important step of any Data Science project. Execution of this step should be as good and robust as to produce what a layman can understand in terms of the outcome of the project.“The predictive power of the model lies in its ability to generalise.” 


.

A Deep Dive Into The US Healthcare System in New York

A Deep Dive Into The US Healthcare System in New York

Unlike India’s healthcare system wherein both public and private entities deliver healthcare facilities to citizens, in the US, the healthcare sector is completely privatised.

The aim of this notebook is to study some of the numerical data we have for the US and especially data for New York. Most of us know about New York’s situation that is one of the worst in the world.

Therefore, analysing data may clarify a few things. We will be using three sets of data – urgent care facilities, US county healthcare rankings 2020 and Covid sources for counties.

For the data and codesheet click below.


Now pick key column names for your study with ‘.keys’ as the function name. We are interested in a few variables from health rankings so we take only the ones we think will be useful in a new data frame.

We will study each data set one by one so that we can get an understanding of the data before combining them. For this we call the plotly library that has very interactive graphs. We use the choropleth to generate a heat map over the country in question.

Fig. 1.

It is clear form the heat map that New York has a very high incidence of infections vis a vis other states. We then begin working with data on the number of ICU beds in each state. Since each state will have different populations, we cannot compare the absolute number of ICU beds. We need the ratio of ICU beds per a given number of inhabitants.

Fig. 2.

The generated heat map (Fig. 2.) shows the ICU density per state in the US. For more on this do watch the complete video tutorial attached herewith.

This tutorial was brought to you by DexLab Analytics. DexLab Analytics is a premiere data analyst training institute in Gurgaon.


.

Covid-19 – Key Insights through Exploration of Data (Part – II)

Covid-19 - Key Insights through Exploration of Data (Part - II)

This video tutorial is on exploratory data analysis. The data is on COVID-19 cases and it has been taken from Kaggle. This tutorial is based on simple visualization of COVID-19 cases.

For code sheet and data click below.


Firstly, we must call whatever libraries we need in Python. Then we must import the data we will be working on onto our platform.

Now, we must explore PANDAS. For this it is important to know that there are three types of data structures – Series, Data Frame and Panel Data. In our tutorial we will be using data frames. 

Fig. 1.

Fig. 1

Now we will plot the data we have onto a graph. When we run the program, we get a graph that shows total hospital beds, potentially available hospital beds and available hospital beds.

Fig. 2.

Fig. 2

While visualizing data we must remember to keep the data as simple as possible and not make it complex. If there are too many data columns the interpretation will be a very complex one, something we do not want.

Fig. 3.

Fig. 3

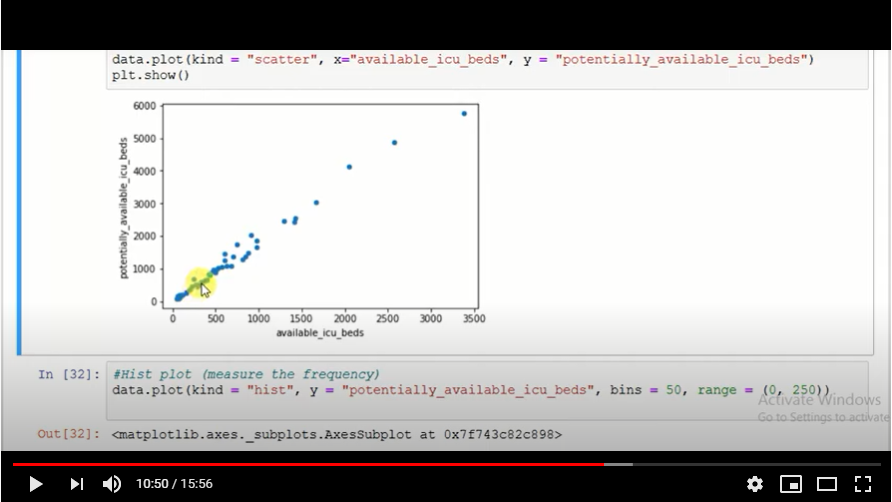
A scatter plot (Fig. 3.) is also generated to show the reading of the data available.  We study the behaviour of the data on the plot.

For more on this, view the video attached herewith. And practise more and more with data from Kaggle. This tutorial was brought to you by DexLab Analytics. DexLab Analytics is a premiere data analyst training institute in Gurgaon.


.

How Company Leaders and Data Scientists Work Together

How Company Leaders and Data Scientists Work Together

Business leaders across platforms are hungrily eyeing data-driven decision making for its ability to transform businesses. But what needs to be taken into account is the opinion of data scientists in the core company teams for they are the experts in the field and whatever they have to say regarding data driven decisions should be the final word in these matters.

“The ideal scenario is all parties in complete alignment. This can be envisioned as a perfect rectangle, with business leaders’ expectations at the top, fully supported by a foundation of data science capabilities — for example, when data science and AI can achieve management’s goal of reducing customer retention costs by automating identification and outreach to at-risk customers,”says a report.

The much sought after rectangle, however, is rarely achieved. “A more workable shape is the rhombus, depicting the push-and-pull of expectations and deliverables.”

Using the power of your company’s data.

Business leaders must have patience with developments on the part of data scientists for what they expect is usually not in sync with the deliverables on the ground.

“Over the last few years, an automaker, for example, dove into data science on leadership’s blind faith that analytics could revolutionize the driver experience. After much trial and error, the results fell far short of adding anything meaningful to what drivers found valuable behind the wheel of a car.”

Appreciate Small Improvements

Also, what must be appreciated are small improvements made impactful. For instance, “slight increases in profitability per customer or conversion rates” are things that should be taken into account despite the fact that they might be modest gains in comparison to what business leaders had invested in analytics. “Applied over a large population of customers, however, those small improvements can yield big results. Moreover, these improvements can lead to gains elsewhere, such as eliminating ineffective business initiatives.”

Healthy Competition

However, it is advisable for business leaders to constantly push their data scientists to strive for more deliverables and improve their tally with a framework of healthy competition in place. In fact, big companies form data science centers of excellence, “while also creating a healthy competitive atmosphere that encourages data scientists to push each other to find the best tools, strategies, and techniques for solving problems and implementing solutions.”

Data Science Machine Learning Certification

Here are three ways to inspire data scientists

  1. Both sides must work togetherTake the example of a data science team with expertise in building models to improve customers’ shopping experiences. “Business leaders might assume that a natural next step is to use AI to enhance all customer service needs.”However, AI and machine learning cannot answer the ‘why’ or ‘how’ of the data insights. Human beings have to delve into those aspects by studying the AI output. And on the other hand, data scientists also must understand why business leaders expect so much from them and how to achieve a middle path with regard to expectations and deliverables.
  2. Gain from past successes and achievements – “There is value in small data projects to build capabilities and understanding and to help foster a data-driven culture.”The best policy for firms to follow is to initially keep modest expectations. After executing and implementing the analytics projects, they should conduct a brutally honest anatomy of the successes and failures, and then build business expectations at the same time as analytics investment.
  3. Let data scientists spell out the delivery of analytics results “Communication around what is reasonable and deliverable given current capabilities must come from the data scientists — not the frontline marketing person in an agency or the business unit leader.” Before signing any contract or deal with a client, it is advisable to allow the client to have a discussion with the data scientists so that there is no conflict of ideas between what the data science team spells out and what the marketing team has in mind. For this, data scientists will have to work on their soft skills and improve their ability to “speak business” regarding specific projects.


.

Ms Excel is All-Powerful: Some Tasks You Never Know You Could Do With Excel!

Ms Excel is All-Powerful: Some Tasks You Never Know You Could Do With Excel!

Data is everywhere and evident. With the multiplication of data and the increasing need to preserve it, we must always organise data. A properly organised data not only makes it easier to analyse data in the future, but it also makes everything clear and presentable. 

Though we had some initial difficulties of maintaining data right at the beginning, MS Excel has surely been making our tasks easier ever since it was discovered. Therefore, it is not a shock that Microsoft Excel is one of the most demanding skills in the present age we are living. However, you should always choose the Advanced excel institute in Gurgaon, if you are interested in learning MS Excel in a top-notch environment, from the experts. 

Microsoft Excel and its Advantages

Microsoft Excel has come a long way from helping us in the basic tasks of keeping things comprehensible and organised. Many of our daily chores of simple arithmetic calculations, interactive representation of data in the form of tables, charts and statistical representation of data via bar graphs, line graphs and pie charts are easier than ever with MS Excel. Besides, with the progressive age, it is remarkable how Excel is keeping up with the dizzying pace and the rising demands of the technological advancements we are experiencing a day in and day out.

Business Intelligence and location intelligence are the new trends of the hour and you can count on MS Excel to help you out with them as well. If you find us asking for too much here, then check some compelling tasks which you can perform via MS Excel.

Data Science Machine Learning Certification

You can Wield the Spreadsheet as a Map

Did you know that you can gain a deep insight into the location just through your spreadsheets? Well, perhaps you can! 

Though your spreadsheet appears to be all tables, they can eventually fetch you important information on the location. Moreover, you can also look at MS Excel as a spatial dataset bringing you spatial relationships, which is similar to a GML or an Esri Shapefile. Besides, with the introduction of innovative FME technology, you can:

  1. Convert the existing coordinates into geometrical representations of latitudes and longitudes.
  2. Geocode the available addresses on your spreadsheet to spatialize them automatically. ArcGIS Online and Google are some of the popular options òf geocoding services that you can avail.
  3. Associate your spreadsheet to an existing geometry stored somewhere else. 

Merge all into One with Ms Excel

You might gather data in a wide range of available formats but you need not be confused with MS Excel. Whether your data is in complex spreadsheets, represented by GIS and CAD drawings or etched in the form of orthophotos, you can import them all and most importantly, merge them with your current MS Excel worksheet. Moreover, FME also enables you to integrate your spreadsheet with data in variegated formats. Therefore, you just need to build a workflow initially and you can import a convincing amount of data and merge them just as you want to.

To Sum Up!

Apart from these, you can also load all your data; manage and analyse data effectively and generate lengthy reports and summaries without any hassles. Therefore, it is important to grasp all the latest skills of MS Excel to be updated with the age. Here’s where Dexlab Analytics stands by you as a compelling companion with Advanced Excel course in Gurgaon

Automation is seeping into every other discipline and the same goes for Excel as well. So, if you are interested to explore the world of automation in relation to MS Excel, then check out the upcoming workshop scheduled by Dexlab on 28th and 29th of December, 2019, promising you intensive training on Automation in Ms Excel.

If you also want to be a part of this all-inclusive training, then


This blog is sourced from www.safe.com/blog/2015/03/5-automated-excel-tasks


Interested in a career in Data Analyst?

To learn more about Data Analyst with Advanced excel course – Enrol Now.
To learn more about Data Analyst with R Course – Enrol Now.
To learn more about Big Data Course – Enrol Now.

To learn more about Machine Learning Using Python and Spark – Enrol Now.
To learn more about Data Analyst with SAS Course – Enrol Now.
To learn more about Data Analyst with Apache Spark Course – Enrol Now.
To learn more about Data Analyst with Market Risk Analytics and Modelling Course – Enrol Now.

Call us to know more