analyst courses in delhi Archives - Page 4 of 5 - DexLab Analytics | Big Data Hadoop SAS R Analytics Predictive Modeling & Excel VBA

How Data Analytics Influences Holiday Retail Experience [Video]

Thanksgiving was right here! Half of the globe witnessed some crazy shopping kicking off the entire holiday season, and retailers had a whale of a time, offering luscious discounts and consumer gifts at half the prices.

 
How Data Analytics Influences Holiday Retail Experience
 

Before the weekend Thanksgiving sale, 69% of Americans, close to 164 million people across the US were estimated to shop– and they had planned to shell out up to 3.4% more money as compared to last year’s Black Friday and Cyber Monday sale. The forecasts came from National Retail Federation’s annual survey, headed by Prosper Insights & Analytics.

Continue reading “How Data Analytics Influences Holiday Retail Experience [Video]”

Keep Pace with Automation: Emerging Data Science Jobs in India

Indian IT market is not yet doomed. In fact, if you look at the larger picture, you will find India is expected to face a shortage of 200000 data scientists by 2020. Where traditional IT jobs are going through a rough patch, new age jobs are surfacing up, according to market reports. Big Data, Artificial Intelligence, the Internet of Things, Cloud Computing, and Cybersecurity are new digital domains that are replacing the old school jobs, like data entry and server maintenance, which are expected to reduce more over the next five years.
The next decade is going to witness most vacancies in these job posts:

However, just because there is a wide array of openings for a web services consultant doesn’t make it the most lucrative job position. Big Data architect job openings are much less in number, but offer handsome pays, according to reports.

A median salary of a web services consultant is Rs 9.27 lakh ($14,461) annually

A median salary of a big data architect is Rs 20.67 lakh ($32,234) annually

Now, tell me, which is better?

As technologies evolve so drastically, it becomes an absolute imperative for the techies to update their skills through short learning programs and crash courses. Data analyst courses will help them to sync in with the latest technological developments, which happens every day, something or the other. Moreover, it’s like a constant process, where they have to learn something every year to succeed in this rat race of technological superiority. Every employee needs to make some time, as well as the companies. The companies also need to facilitate these newer technologies in their systems to keep moving ahead of their tailing rivals.

Re-skill or perish – is the new slogan going around. The urgency to re-skill is creating a spur among employees with mid-level experience. If you check the surveys, you will find around 57% of the 7000 IT professionals looking forward to enroll for a short time learning course have at least 4 to 10 years of work experience. Meanwhile, a mere 11% of those who are under 4 years of experience are looking out for such online courses. It happens because, primary-stage employees are mostly fresh graduates, who receives in-house training from their respective companies, hence they don’t feel the urge to scrounge through myriad learning resources, unlike their experienced counterparts.


Today, all big companies across sectors are focusing their attention on data science and analytics, triggering major reinventions in the job profile of a data analyst. Owing to technology updates, “The role of a data analyst is itself undergoing a sea change, primarily because better technology is available now to aid in decision-making,” said Sumit Mitra, head of group human resources and corporate services at GILAC. To draw a closure, data science is the new kid in the block, and IT professionals are imbibing related skills to shine bright in this domain. Contact DexLab Analytics for data analyst course in Delhi. They offer high-in demand data analyst certification courses at the most affordable prices.


More Than Fifty Percent Companies Lack Required Tools and Investment for Efficient Business Analytics

More Than Fifty Percent Companies Lack Required Tools and Investment for Efficient Business Analytics

Fifty-nine percent of the companies around the world are not using Predictive Models or Advanced Analytics – says Forbes Insights/Dun & Bradstreet Study.

A recent study by Forbes Insights and Dun & Bradstreet, “Analytics Accelerates Into the Mainstream: 2017 Enterprise Analytics Study,” elucidates the ever-increasing indispensable role that analytics play in today’s business world, all the way from devising strategies to operations. The gloomy Forbes study highlights the crucial need for immediate investment, implementation and prioritization of analytics within companies.

5

The survey was carried on more than 300 senior executives in Britain, Ireland and North America and the report illuminates that the leading corporate giants need to invest more on the people, the processes they use and technologies that authorize decision support and decision automation.

Bruce Rogers, chief insights officer at Forbes Media was found quoting, “This study underlines the need for continued focus and investment,” he further added, “Without sophisticated analysis of quality data, companies risk falling behind.”

“All analytics are not created equal,” said Nipa Basu, chief analytics officer, Dun & Bradstreet.  She explained, “This report shows a critical opportunity for companies to both create a solid foundation of comprehensive business data – master data – and to utilize the right kind of advanced analytics. Those that haven’t yet begun to prioritize implementation of advanced analytics within their organizations will be playing catch-up for a long while, and may never fully recover.”


Key findings revealed:

Need for tools and best practices

Though data usage and consumption growth brags about success, little sophistication is observed in how data are analysed. Only 23% of the surveyed candidates are found to be using spreadsheets for all sorts of data work, while another 17% uses dashboards that are a little more efficient than spreadsheets.

The survey says mere 41% rely on predictive models and/or advanced analytical and forecasting techniques, and 19% of the respondents implement no analytical tools that are more complicated than fundamental data models and regressions.

Skill deficiency stalling analytics success

Twenty seven percent of respondents diagnosed with skill gaps as a major blocker between current data and analytics efforts. Fifty two percent were found to be working with third-party data vendors to tackle such lacks of skills. Moreover, 55% of the surveyed contestants said that third-party analytics partners performs better than those who works in-house, exhibiting both a shortage of analytics capabilities among in-house analysts and a dearth in skilled workers.

Investment crunch

Survey respondents ticked lack of investment and problems with technology as the top hindrances to fulfilling their data strategy goals. Despite the increasing use of data, investment in deft personnel and technology is lagging behind.

CFO’s introspect into data for careful insights

According to the survey, 63% of those who are in the financial domains shared they are using data and analytics to discover opportunities to fund business growth. Further, 60% of the survey respondents revealed they rely on data to boost long-term strategic planning.

For more interesting blogs and data-related stuffs, follow us on DexLab Analytics. We are a leading Data Science training institute in Delhi offering high-in demand Business analyst training courses in Gurgaon. Reach us today!


Interested in a career in Data Analyst?

To learn more about Data Analyst with Advanced excel course – Enrol Now.
To learn more about Data Analyst with R Course – Enrol Now.
To learn more about Big Data Course – Enrol Now.

To learn more about Machine Learning Using Python and Spark – Enrol Now.
To learn more about Data Analyst with SAS Course – Enrol Now.
To learn more about Data Analyst with Apache Spark Course – Enrol Now.
To learn more about Data Analyst with Market Risk Analytics and Modelling Course – Enrol Now.

Role of Self Service Analytics in Businesses

Role of Self Service Analytics in Businesses

Self Service Analytics is proving useful for business users, who are working on business data without necessarily having a background in technology and statistics. It is essentially bridging the gap between trained data analysts and normal business users.

Following are the characteristics of Self Service Analytics:

  1. Business Users Independence:

Self Service Analytics reduces dependency on IT and Data warehousing teams, thereby reducing the turnaround time for a request made by a business user.

It does so by continuously collating and loading real time data into a singular stream without disparity, which is easily accessible through browsers. Thus, it helps business users in taking decisions on Real-Time basis.

This feature benefits organizations because vital decisions made within time can be more profitable as compared to the traditional way of analysing data, which may not be a good idea in respect to the urgency constraint.

2

  1. Easier and Reduced Cost of Operations:

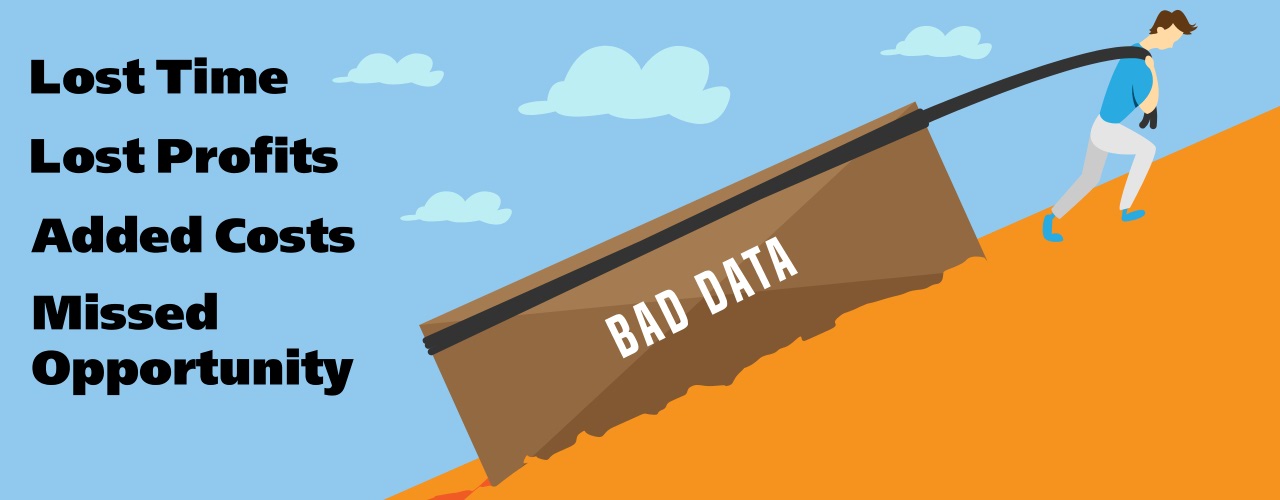
Often, the company’s data are fragmented and widespread across various divisions. This increases the headache of channelling the data meaningfully and in a wholesome manner.

Further to this, preparing reports using this data becomes a cumbersome job for the IT department or the department, which is serving such request. Hence, it may lead to increased cost of time or decreased quality of efficiency at which the operations have to run. However, many a times, these reports fail to give an overview of the operations in an organisation.

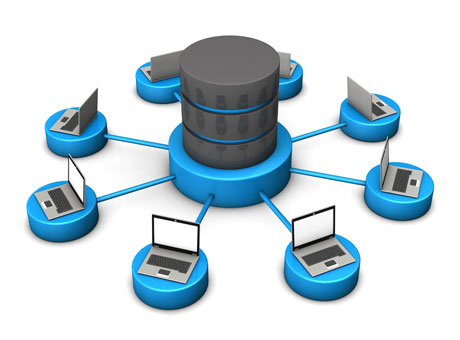
Self-service BI integrates data from different systems and delivers a “Single Version of Truth”. Accessing this data and running computations on it requires only a browser for access and eliminates the need to install, maintain and administer large-footprint software clients on each user’s workstation.

If Self Service Analytics is hosted on SaaS, it will further reduce the cost of machinery and maintenance associated with it. The provision for usage can be increased or decreased in no time according to the usage pattern. This really means that Self Service Analytics helps you adapt with time and Pay-Per-Use model, which is a leading trend in most of the industries.

  1. Resolving the conflict over accuracy:

Typically, a business user using Excel would have a local copy of data and run computations on it. He can merge and transform it by using various formulas and finally derive a conclusion.

This is dangerous because in live operations, data keeps changing and data integrity is at stake by working on local copies. Thus, accuracy in decision-making becomes a game of luck.

In Self Service BI, the data from the source is extracted, transformed and loaded into a unique data model, which goes with all operations. In this case, data integrity is assured. In addition, all business users have the same source of data, removing the risk that working with different local copies have.

Therefore, from the above stated facts, we can conclude that Self Service Analytics is a need for today’s businesses.

However, there are a few risks involved in Self Service Business Analytics:

  1. Loose corporate governance and make data available to business users directly may be taken advantage of in an undue manner.
  2. Business users may not be properly trained or skilled to make decisions.
  3. Relying heavily on any tool without some real life experience and insight into the background of that data can result into an impaired decision-making.

If all the above-mentioned risks are mitigated and proper corporate governance structure is in place, Self Service Analytics can be very beneficial for the success of any organization.

To excel in Self-Service Analytics, why not take up Machine Learning courses in Delhi from DexLab Analytics! They are informative, interesting and elaborate.


Interested in a career in Data Analyst?

To learn more about Data Analyst with Advanced excel course – Enrol Now.
To learn more about Data Analyst with R Course – Enrol Now.
To learn more about Big Data Course – Enrol Now.

To learn more about Machine Learning Using Python and Spark – Enrol Now.
To learn more about Data Analyst with SAS Course – Enrol Now.
To learn more about Data Analyst with Apache Spark Course – Enrol Now.
To learn more about Data Analyst with Market Risk Analytics and Modelling Course – Enrol Now.

Knock! Knock! It’s Time to Change Your Bad Data Habits

Knock! Knock! It’s Time to Change Your Bad Data Habits

Do you follow your instincts instead of data and insights?

Do you prefer storing data in different databases, in separate formats with varying values?

Habits are subject to change. Though it may take some time, but eventually it evolves. Good and bad habits make a person. Good habits don’t demand attention, but bad habits often need to be looked into.

If you suffer from bad data habits, then you must make sure you deal with it. It has to be a thing from your past rather than a dominating present. After all, data is incredibly important for business organizations to proliferate and generate decent revenues.


As per Experian’s Data Quality Report, 83% of companies consider their revenue suffers from inaccurate and insufficient customer data. It happens because of time and money wastage on insubstantial resources, which leads to a humungous loss of productivity and profit.

Bad Data Habits: The Ugly Truth

Data is the essence of business. From email delivery to customer feedback to profit generation, the impact of data trickles from strata to strata.

1280-blog-bad-data2

Sadly, many companies fail to fathom the significance of data and continue storing data on multiple systems, instead of a single location, in various formats without actually knowing ways to handle it. This eventually results into huge data pile-ups, where the entire data silo becomes difficult to manage.

However, if you have the right tools and a zeal to ensure data quality, you can confidently manage your data, eradicate duplications and fix errors before they inflict damage to your fundamentals. Besides, prudent strategies, time-to-time reviews and absolute determination are necessary; read this article to gain more insights about how to work on your bad data habits.

Let awareness do the work

Detailed information about customers is crucial for better assistance and quicker efficiency. So, you should always tell your customer support team to derive more information about their customers in order to serve better.

Understand your data needs

What data is important for your business? Once you know that, you will be able to apprehend your customer’s needs and expectations more effectively. Moreover, be sure that the data is accessible to all those who really needs it, otherwise it won’t be fruitful.

Introduce Standardised Data Quality Policies

images

For high quality data, make sure you introduce standard data policies and procedures. Also, ensure that the people working in your organization are acquainted with the ways of recording and storing it.

Initiate Regular Reviews

Data degradation is common. Human beings commit mistakes. Hence, it is important to regularly review and cleanse data in order to avoid future discrepancies.

Integration and Installation of the Right Tools

boxbarimage5

Integrate your network to ensure the data is stored on one server, but accessible from multiple locations. This will help you get an entire picture of your company’s business performance over varied mediums. Install any of the improved Data Cleaning Software to make sure your data is free of duplicates and perfectly formatted right from the start.


To brush up your analytics skills, get enrolled in a Data analyst course. Visit DexLab Analytics.


Interested in a career in Data Analyst?

To learn more about Machine Learning Using Python and Spark – click here.
To learn more about Data Analyst with Advanced excel course – click here.
To learn more about Data Analyst with SAS Course – click here.
To learn more about Data Analyst with R Course – click here.
To learn more about Big Data Course – click here.

Our Perception Must Include Data-Ception

Our Perception Must Include Data-Ception

Considering the complex competitive global environment, the world business today is witnessing a paradigm shift from mere data storage to data mining and other subsequent activities.

Thus, from a managerial perspective it is of prime importance to develop a psyche, which can interpret the collection of data. This psyche cannot be theoretically learnt from books, as it requires a knack to make data talk. Data is no more evaluated independently. Today, a cross-domain relationship between data exists, which on analysis depicts patterns, responsible enough to do wonders for the organization.

The question is how can we connect the dots? Following the recent trends, developers are grabbing every opportunity to break a huge chunk of data into meaningful relevant information. From the standpoint of technical professionals, along with an analytical mindset, they need to get hands on experience on the technological perspective to understand the real significance of data evaluation.

 Read Also : DexLab Analytics – Training the Future to be Big Data Analytics Fluent

The data not only aligns with the internal activity of the business but also is an integral part for consumer servicing. There is an intense need to study the needs of consumer and every decision he makes, which broadens the outlook of a business on how he/she is using their product. What are the expectations of the customer from an existing product? What more my customer needs? The answers to these questions cannot always be mapped quantitatively but a qualitative approach towards data is one of the key aspects of data analytics.

In this digital era, slightest technological ripples are going to reshuffle the whole industry scenario. And, that is why the omnipresence of data will aid businesses in setting new benchmarks in consumer and market findings. Growing pace of social media would open a Pandora’s Box for companies, who have their right audience in this particular domain.

The emergence of IOT, which primarily thrives on data, will cause disruption in the current business orientation. The data producing sensor architecture directly connected to the company can help the business to be fast and robust, which is the need of an hour. In addition, this analytics might influence mid-size distribution largely.

Simple example of this model: Sensors attached to tyres could sense data, and alert a tyre manufacturer about the usage of a consumer, which will help in servicing their customer at the right moment.

Thus, on an individualistic note there is need to develop a data analytical mindset and include data-ception in perception.

This blog has been contributed by Team Frontrunners, comprising members Ria Shah, Dishank Palan, Sanjay Sonwani from Welingkar College.


Interested in a career in Data Analyst?

To learn more about Data Analyst with Advanced excel course – Enrol Now.
To learn more about Data Analyst with R Course – Enrol Now.
To learn more about Big Data Course – Enrol Now.

To learn more about Machine Learning Using Python and Spark – Enrol Now.
To learn more about Data Analyst with SAS Course – Enrol Now.
To learn more about Data Analyst with Apache Spark Course – Enrol Now.
To learn more about Data Analyst with Market Risk Analytics and Modelling Course – Enrol Now.

Power BI is The New Revolutionary Tool For Business! This is Why

Power BI is The New Revolutionary Tool For Business! This is Why

Microsoft launched its Power BI tool quite some time ago now, and the way things seem to advance is pretty amazing to say the least. This is a great Business Intelligence and analytics tool and it seems it is only a matter of time before the Power BI becomes the tool of choice for Business Intelligence and analytical works in almost all of the foresighted corporations.

This is a powerful BI tool now available in the hands of enterprises, who are looking to extract data from multiple disparate sources in order to derive meaningful insights from it. The tool offers unprecedented interactive visualization opportunities along with true self-servicing analytical capacities.

With all of these it helps the whole look of the same data to appear from varying angles and also allows the reports and dashboards to be made by anybody within the organization without assistance from IT administrators and developers.

The international analytics and BI market is to reach the mark of  USD 16.9 Billion in 2016 says Gartner!

Are you keen on acquiring a Big Data certification then check out DexLab Analytic’s Machine Learning courses in Delhi now!

Power BI is leading the way in cloud business analytics and intelligence. It offers the services, which can directly be harnessed from the cloud, and it is a huge advantage when it comes to how BI can be utilized. The desktop version of power BI is also available and is known as the Power BI desktop.

The entire range of ordinary tasks can be performed with this Power BI like – data discovery, data preparation, designing of the interactive dashboards. Microsoft also went a step ahead by putting up the embedded version of Power BI in its highly revered Azure cloud platform.

The company already has a pretty good presence in the analytics environment with its popular products like SSAS – SQL Server Analysis Service. However, it did not have any strong presence in the BI delivery system and OLAP segment i.e. Online Analytical Processing.

Excel for a long time has been Microsoft’s attempt at being a presentation layer for its data analysis tools. However, Excel has a lot of disadvantages like limited memory, integrity issues with data which are the main reasons why it is often not very appealing to the corporate clients who want something more malleable for business analytics.

You can give your career a powerful boost with Big Data training from the leading Big Data training institute in Delhi NCR.

Data Science Machine Learning Certification

However, a really powerful BI tool is what takes Excel to a great new level; it helps to offer a whole new experience to working with tools like Power Query for data extraction and its transformation. The Power Pivot tool which, is deployed for data analysis and modelling and lastly, the Power View which, is used to map the data and visualize it distinctly in unprecedented ways. With Power Bi one can put all of these tools into a consolidated manner and will make it easier to work without having to depend on to MS Office solely.

In closing thoughts, thus, it is safe to say that Power Bi is putting the right use of power in the right hands of the customers. so, a power BI training can be a good decision for one’s career at this point, for those who consider themselves as a forward-thinking IT professional.  


.

A few easy steps to be a SUCCESSFUL Data Scientist

A-few-easy-steps-to-be-a-successful-data-scientist (1)

Data science has soared high for the past few years now; sending the job market into turbo pace where organizations are opening up their C-suite positions for unicorns to take their mountainous heap of data and make sense of it all to generate the big bucks. And professionals from a variety of fields are now eyeing the attractive position of data analyst as a possible profitable career move.

We went about questioning the faculty at our premiere data science and excel dashboard training institute to know how one can emerge as a successful data scientist, in this fast expanding field. We wanted to take an objective position from a recruiter’s point of view and create a list of technical and non-technical skills which are essential to be deemed an asset employee in the field of data science.

Keep Pace with Automation: Emerging Data Science Jobs in India – @Dexlabanalytics.

A noteworthy point to be mentioned here is that every other organization will evaluate skills and knowledge in different tools with varying perspectives. Thus, this list in no way is an exhaustive one. But if a candidate has these songs then he/she will make a strong case in their favor as a potential data scientist.

The technical aspects:

Academia:

Most data scientists are highly educated professionals with more than 88 percent of them having a Master’s degree and 46 percent of them have a PhD degree. There are exceptions to these generalized figures but a strong educational background is necessary for aspiring data scientists to understand the complex subject of data science in depth. The field of data science can be seen in the middle of a Venn diagram with intersecting circles of subjects like Mathematics and Statistics 32%, Engineering 16% and Computer Science and Programming 19%.

Knowledge in applications like SAS and/or R Programming:

In depth knowledge in any one of the above tools is absolutely necessary for aspiring data scientists as these form the foundation of data analysis and predictive modeling. Different companies give preference to different analysis tools from R and SAS, a relatively new open source program that is also slowly being incorporated into companies is Hadoop.

2

For those from a computer science background:

  • Coding skills in Python – the most common coding language currently in use in Python. But some companies may also demand their data scientists to know Perl, C++, Java or C.
  • Understanding of Hadoop environment – not always an absolute necessity but can prove to be advantageous in most cases. Another strong selling point may be experience in Pig or Hive. Acquaintance with cloud based tools like Amazon S3 may also be advantageous.
  • Must have the ability to work with unstructured data with knowledge in NoSQL and must be proficient in executing complex queries in SQL.

Non-technical skills:

  • Impeccable communicational skills so that data personnel can translate their technical findings into non-technical inputs comprehensible by the non-techies like sales and marketing.
  • A strong understanding of the business or the industry the company operates in. leverage the company’s data to achieve its business objectives with strong business acumen.
  • Must have profound intellectual curiosity to filter out the problem areas and find solutions against the same.


Interested in a career in Data Analyst?

To learn more about Data Analyst with Advanced excel course – Enrol Now.
To learn more about Data Analyst with R Course – Enrol Now.
To learn more about Big Data Course – Enrol Now.

To learn more about Machine Learning Using Python and Spark – Enrol Now.
To learn more about Data Analyst with SAS Course – Enrol Now.
To learn more about Data Analyst with Apache Spark Course – Enrol Now.
To learn more about Data Analyst with Market Risk Analytics and Modelling Course – Enrol Now.

Are You a Student of Statistics? – You must know these 3 things

Are you a student of statistics?

We a premiere statistical and data analysis training institute offering courses on Big Data Hadoop, Business intelligence and Ai. We asked our faculty to tell us the three most important things that every student of elementary statistics should know.

So, let us get on with it:

  1. The notion that statistics is about numbers, is in the context only: statistics involves a rich treasure trove of numeric and graphical representation of displaying data to quantify them also it is very important to be capable of generating graphs along with numbers. But that is not the half part of statistics and the main interesting aspect is related to making the big leap from numbers and graphs to the realistic worldly interpretations. Uncannily statistics also poses to be a fascinating philosophical tension raising the question and healthy skepticism about we believe in and what we do not.
  2. The analysis part is not the most crucial part of a statistical study, the most important part lies with the when, where and how of gathering the data. We must not forget when we enter each number or data, calculate and plot the strategies we build on our understanding, but many a times at the time of interpretation that each every graph, data or number is a product of a fallible machine, be it organic or mechanical. If we are able to take proper care at the stage of sampling and observation we will be able to obtain great dividends at the final stage of interpretation and analysis of all our statistical efforts.
  3. All statistical functions off all kinds of mathematical sciences are based on a two-way communication system. This communication system should be between the statistician and non-statistician end. The main aim of statistical analysis is to put forward important social, public and scientific questions. A good statistician knows how to communicate with the public especially with those who are by and large not statisticians. Also the public here plays an important role and must possess simple idea of statistical conclusions to grasp what the statisticians have to say to them. This is an important criterion to be incorporated in the K-12 and college curriculum for elementary statistical students.

Data Science Machine Learning Certification

If you agree with our views and would like to discuss further on statistics and its application on data analysis then feel free drop by DexLab Analytics and stay updated on the latest trends in data management and mining.


Interested in a career in Data Analyst?

To learn more about Data Analyst with Advanced excel course – Enrol Now.
To learn more about Data Analyst with R Course – Enrol Now.
To learn more about Big Data Course – Enrol Now.

To learn more about Machine Learning Using Python and Spark – Enrol Now.
To learn more about Data Analyst with SAS Course – Enrol Now.
To learn more about Data Analyst with Apache Spark Course – Enrol Now.
To learn more about Data Analyst with Market Risk Analytics and Modelling Course – Enrol Now.

Call us to know more