analyst courses in delhi Archives - DexLab Analytics | Big Data Hadoop SAS R Analytics Predictive Modeling & Excel VBA

A Guide To Different Types Of Business Analytics

A Guide To Different Types Of  Business Analytics

Businesses today can no longer afford to run based on assumptions, they need actionable intel which can help them formulate sharper business strategies. Big data holds the key to all the information they need and the application of business analytics strategies can help businesses realize their goals. Business analytics is about collecting data and processing it to glean valuable business information. Business analytics puts statistical models to use to access business insight. It is a crucial branch of business intelligence that applies cutting edge tools to dissect available data and detect the patterns to predict market trends and doing business analysis training in delhi can help a professional in this field in a big way.

Different types of business analytics:

Business analytics could be broken down into four different segments all of which perform different tasks yet all of these are interrelated. The types are namely Descriptive Analytics, Diagnostic Analytics, Predictive Analytics, and Prescriptive Analytics. The role of each is to offer a thorough understanding of the data to predict future solutions. Find out how these different types of analytics work.

Descriptive Analytics: Descriptive analytics is the simplest form of analytics and the term itself is self-explanatory enough. Descriptive analytics is all about presenting a summary of the data a particular business organization has to create a clear picture of the past trends and also capturing the present situation. It helps an organization to understand what are the areas that need attention and what are their strengths. Analyzing historical data the existence of certain trends could be identified and most importantly could also offer some valuable insight towards developing some plan. Usually, the size of the data both structured and unstructured are beyond our comprehension unless it is presented in some coherent format, something that could be easily ingested. Descriptive analytics performs that function with the help of data aggregation and data mining techniques. For improving communication descriptive analytics helps in summarizing data that needs to be accessible to employees as well as to investors.

Diagnostic Analytics: Diagnostic analytics plays the role of detecting issues a company might be facing. When the entire data set is presented comprehensively, it is time for diagnosis of the patterns detected and detecting issues that might be causing harm. Now, this business analytics dives down deeper into the problem and offers an in-depth analysis to bring out the root cause of the problem. The diagnostic analytics concerns itself with the problem finding aspect by reading data and extracting information to find out why something is not working or, working in a way that is giving considerable trouble. Usually, principle components analysis, conjoint analysis, drill-down, are some of the techniques employed in this specific branch of analytics. Diagnostic analytics takes a critical look at issues and allows the management to identify the reasons so that they can work on that.

Predictive Analytics:  Predictive analytics is sophisticated analytics that is concerned about taking the results of descriptive analytics and working on that to forecast probabilities. It does not predict an outcome but, it suggests probabilities by combining statistics and machine learning. It takes a look at the past data mainly the history of the organization, past performances, and also takes into account the current state and on the basis of that analysis it suggests future trends. However, predictive analytics does not work like magic, it does its job based on the data provided and so, data quality matters here. High quality, complete data ensures accurate prediction, because the data is analyzed to find patterns and further prediction takes off from there. This type of analytics plays a key role in strategizing, based on the forecasts the company can change the sales and marketing strategy and set a new goal.

Prescriptive Analytics: With prescriptive analytics, an organization can find a direction as it is about suggesting solutions for the future. So, it suggests the possible trends or, outcomes, and based on that this analytics can also suggest actions that could be taken to achieve desired results. It employs simulation and optimization modeling to predict which should be the ideal course of action to reach a certain goal. This form of analytics offers recommendations in real-time, it could be thought of as the next step of predictive analytics. Here not just the data previously stored is put to use, but, real-time data is also utilized, in fact, this type of analytics also takes into account data coming from external sources to offer better results.

Data Science Machine Learning Certification

Those were the four types of business analytics that are employed by data analysts to offer sharp business insight to an organization. However, there needs to be skilled people who have done Business analyst training courses in Gurgaon to be able to carry out business analytics procedure to drive organizations towards a brighter future.


.
A Quick Guide To Predictive Analytics

A Quick Guide To Predictive Analytics

Ever since the world woke up to discover the significance of data, there has been tremendous advancement in this field each taking us further towards the utilization of accumulated data to achieve a higher level of efficiency. Predictive analytics is all about extracting hidden information in data and combining technologies like machine learning, artificial intelligence, data analysis, statistical modeling to predict future trends.

Sifting through stored datasets comprising structured and unstructured data, predictive analytics identifies the patterns hidden and analyzes those patterns to make predictions about trends and thereby helps to identify opportunities as well as risk factors. Not just forecasting, but predictive analytics also helps you find associations that could lead you to a new breakthrough. Having undergone big data training in gurgaon, could actually prove to be a big boost for someone planning on working in this specialized field. Now, when you have access to data-based forecasting, it is easy for you to identify both negative and positive trends and in turn, it helps you take the right decisions.

Businesses especially rely heavily on predictive analytics for market analysis, targeting their customers, and assessing risk factors. Unlike before when these business strategies were based on mere guesswork, now the think-tank has access to data to anticipate an outcome.

Predictive analytics models: Predictive analytics models could be classified into two broad categories as follows

Classification models: In this model data is categorized on the basis of some specified criterion. 

Regression models: Regression models focus on identifying patterns that already exist, or, that has been continuing for a while.

So, what are the processes involved in Predictive analytics?

Predictive analytics process could be broken down to different stages and let’s take a look at what the steps are

Defining the Project: This is the first stage when you decide what kind of outcome you are expecting. Besides setting out clear business objectives you also need to be clear about the deliverables as these will have a bearing on your data collection.

Collecting all Data: This is the second stage where data from different sources are collected.

Analyzing Data: In this stage, the data collected is cleaned and gets structured and also gets transformed and modeled.

Statistics: A statistical model is used to test the assumptions, hypotheses, as well as findings.

Modeling: Through multi-model evaluation best option is chosen from an array of available options.  So, the idea is to create an accurate predictive model.

Deployment: This is the stage of deploying the predictive model and create an option for deploying the results for productive purposes in reality.

monitoring: the final and an important stage where the models created are monitored and tested with new data sets to check whether the models still have relevance.

The applications of predictive analytics

Predictive analytics models have found usage across industries

  • In the financial sector, predictive analytics could be used for credit risk measurement, detecting fraud as well as for minimizing the risk, and also for retaining customers.
  • In the field of healthcare predictive analytics could be used for detecting severe health complications that might develop in a patient in the future.
  • In business predictive analytics could be used for short-term or, long-term sales forecasting. In fact, the reaction of the customer could be anticipated and changes could be made accordingly.
  • When a huge investment is involved predictive analytics could help to identify the problematic areas that could pose risk. Accurate risk assessment could help a company secure a better ROI.
  • Predictive analytics could help companies with their customer service, marketing campaigns, sales goals. Companies can strategize better to retain customers and improve their relations with them.
  • With predictive analytics in place, it would be easier to predict equipment maintenance needs and it could also be used for forecasting an equipment failure.

Data Science Machine Learning Certification

Predictive analytics is being adopted in a number of industries ranging from insurance to healthcare. The forecasting that one gets is highly accurate. However, building a reliable dataset and building a reliable model is essential. Having trained personnel on the team who have done data analyst course in delhi, could be helpful.


.

A Quick Guide to Data Visualization

A Quick Guide to Data Visualization

The growing significance of big data and the insight it imparts is of utmost significance. Data scientists are working round the clock to process the massive amount of data generated every day. However, unless you have been through Data Science training, it would be impossible for you to grasp even an iota of what is being communicated through data.

The patterns, outliers every single important factor that emerged through decoding must be presented in a coherent format for the untrained eyes. Data visualization enables the researchers to present data findings visually via different techniques and tools to enable people to grasp that information easily.

Why data visualization is so vital?

The complicated nuances of data analysis is not easier for anybody to understand. As we humans are programmed to gravitate towards a visual representation of any information, it makes sense to convey the findings through charts, graphs, or, some other way. This way it takes only a couple of moments for the marketing heads to process what is the trend to watch out for. 

We are used to seeing and processing the information presented through bars and pie charts in company board meetings, people use these conventional models to represent company sales data.

It only makes sense to narrate what the scientists have gathered from analyzing complex raw data sets, via visual techniques to an audience who needs that information to form data-driven decisions for the future.

So what are the different formats and tools of data visualization?

Data visualization can take myriad forms which may vary in the format but, these all have one purpose to serve representing data in an easy to grasp manner. The data scientist must be able to choose the right technique to relate his data discovery which should not only enlighten the audience but, also entertain them.

The popular data visualization formats are as follows

Area Chart
Bubble Cloud/Chart
 Scatter Plot
Funnel Chart
Heat Map
The formats should be adopted in accordance with the information to be communicated

Data scientists also have access to smart visualization tools which are

  • Qlikview
  • Datawrapper
  • Sisense
  • FusionCharts
  • Plotly
  • Looker
  • Tableau

A data scientist must be familiar with the tools available and be able to decide on which suits his line of work better.

What are the advantages of data visualization?

Data visualization is a tricky process while ensuring that the audience does not fall asleep during a presentation, data scientists also need to identify the best visualization techniques, which they can learn during big data training in gurgaon to represent the relationship, comparison or, some other data dynamic.
If and when done right data visualization  has several benefits to offer

Enables efficient analysis of data

In business, efficient data interpretation can help companies understand trends. Data visualization allows them quickly identify and grasp the information regarding company performance hidden in the data and enables them to make necessary changes to the strategy.

Identify connections faster

While representing information regarding the operational issues of an organization,  data visualization technique can be of immense help as it allows to show connections among different data sets with more clarity. Thereby enabling the management to quickly identify the connecting factors. 

Better performance analysis

Using certain visualizing techniques it is easier to present a product or, customer-related data in a multi-dimensional manner. This could provide the marketing team with the insight to understand the obstacles they are facing. Such as the reaction of a certain demographic to a particular product, or, it could also be the demand for certain products in different areas.  They are able to act faster to solve the niggling issues this way.

Adopt the latest trends

 Data processing can quickly identify the emerging trends, and with the help of data visualization techniques, the findings could be quickly represented in an appealing manner to the team. The visual element can immediately communicate which trends are to watch out for and which might no longer work.

Data Science Machine Learning Certification

 Encourages interaction

Visual representation of data allows the strategists to not just look at numbers but, actually understand the story being told through the patterns. It encourages interaction and allows them to delve deeper into the patterns, instead of just merely looking at some numbers and making assumptions.

Data visualization is certainly aiding the businesses to gain an insight that was lost to them earlier. A data scientist needs to be familiar with the sophisticated data visualization tools and must strike a balance between the data and its representation. Identifying what is unimportant and which needs to be communicated as well as finding an engaging visual technique to quickly narrate the story is what makes him an asset for the company.  A premier Data analyst training institute can help hone the skills of an aspiring data scientist through carefully designed courses.


.

A Deep Dive Into The US Healthcare System in New York

A Deep Dive Into The US Healthcare System in New York

Unlike India’s healthcare system wherein both public and private entities deliver healthcare facilities to citizens, in the US, the healthcare sector is completely privatised.

The aim of this notebook is to study some of the numerical data we have for the US and especially data for New York. Most of us know about New York’s situation that is one of the worst in the world.

Therefore, analysing data may clarify a few things. We will be using three sets of data – urgent care facilities, US county healthcare rankings 2020 and Covid sources for counties.

For the data and codesheet click below.


Now pick key column names for your study with ‘.keys’ as the function name. We are interested in a few variables from health rankings so we take only the ones we think will be useful in a new data frame.

We will study each data set one by one so that we can get an understanding of the data before combining them. For this we call the plotly library that has very interactive graphs. We use the choropleth to generate a heat map over the country in question.

Fig. 1.

It is clear form the heat map that New York has a very high incidence of infections vis a vis other states. We then begin working with data on the number of ICU beds in each state. Since each state will have different populations, we cannot compare the absolute number of ICU beds. We need the ratio of ICU beds per a given number of inhabitants.

Fig. 2.

The generated heat map (Fig. 2.) shows the ICU density per state in the US. For more on this do watch the complete video tutorial attached herewith.

This tutorial was brought to you by DexLab Analytics. DexLab Analytics is a premiere data analyst training institute in Gurgaon.


.

Covid-19 – Key Insights through Exploration of Data (Part – II)

Covid-19 - Key Insights through Exploration of Data (Part - II)

This video tutorial is on exploratory data analysis. The data is on COVID-19 cases and it has been taken from Kaggle. This tutorial is based on simple visualization of COVID-19 cases.

For code sheet and data click below.


Firstly, we must call whatever libraries we need in Python. Then we must import the data we will be working on onto our platform.

Now, we must explore PANDAS. For this it is important to know that there are three types of data structures – Series, Data Frame and Panel Data. In our tutorial we will be using data frames. 

Fig. 1.

Fig. 1

Now we will plot the data we have onto a graph. When we run the program, we get a graph that shows total hospital beds, potentially available hospital beds and available hospital beds.

Fig. 2.

Fig. 2

While visualizing data we must remember to keep the data as simple as possible and not make it complex. If there are too many data columns the interpretation will be a very complex one, something we do not want.

Fig. 3.

Fig. 3

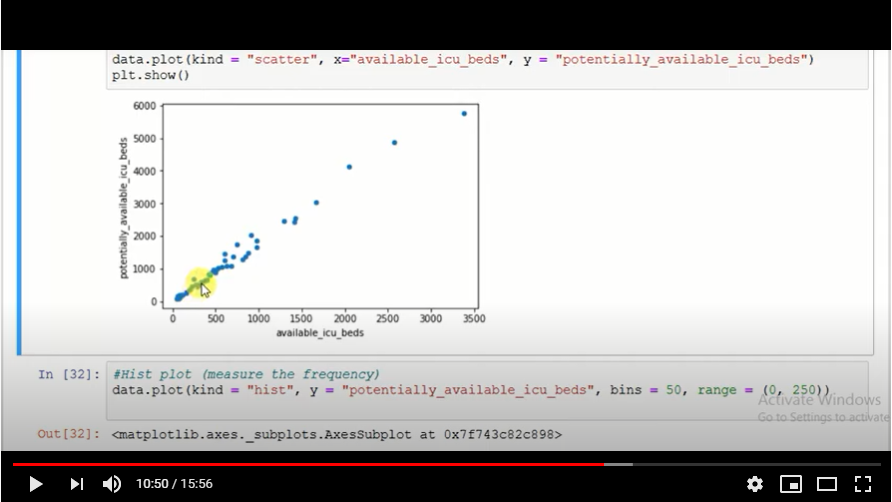
A scatter plot (Fig. 3.) is also generated to show the reading of the data available.  We study the behaviour of the data on the plot.

For more on this, view the video attached herewith. And practise more and more with data from Kaggle. This tutorial was brought to you by DexLab Analytics. DexLab Analytics is a premiere data analyst training institute in Gurgaon.


.

Statistical Application in R & Python: EXPONENTIAL DISTRIBUTION

Statistical Application in R & Python: EXPONENTIAL DISTRIBUTIONStatistical Application in R & Python: EXPONENTIAL DISTRIBUTION

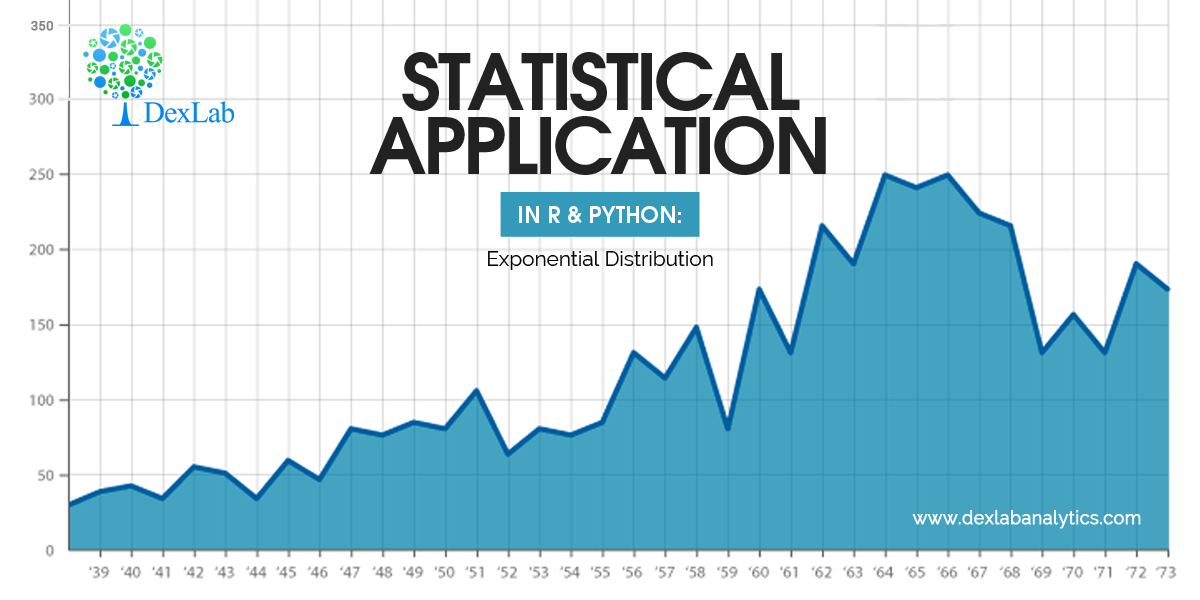
In this blog, we will explore the Exponential distribution. We will begin by questioning the “why” behind the exponential distribution instead of just looking at its PDF formula to calculate probabilities. If we can understand the “why” behind every distribution, we will have a head start in figuring out its practical uses in our everyday business situations.

Much could be said about the Exponential distribution. It is an important distribution used quite frequently in data science and analytics. Besides, it is also a continuous distribution with one parameter “λ” (Lambda). Lambda as a parameter in the case of the exponential distribution represents the “rate of something”. Essentially, the exponential distribution is used to model the decay rate of something or “waiting times”.

Data Science Machine Learning Certification

For instance, you might be interested in predicting answers to the below-mentioned situations:

  • The amount of time until the customer finishes browsing and actually purchases something in your store (success).
  • The amount of time until the hardware on AWS EC2 fails (failure).
  • The amount of time you need to wait until the bus arrives (arrival).

In all of the above cases if we can estimate a robust value for the parameter lambda, then we can make the predictions using the probability density function for the distribution given below:

Application:-

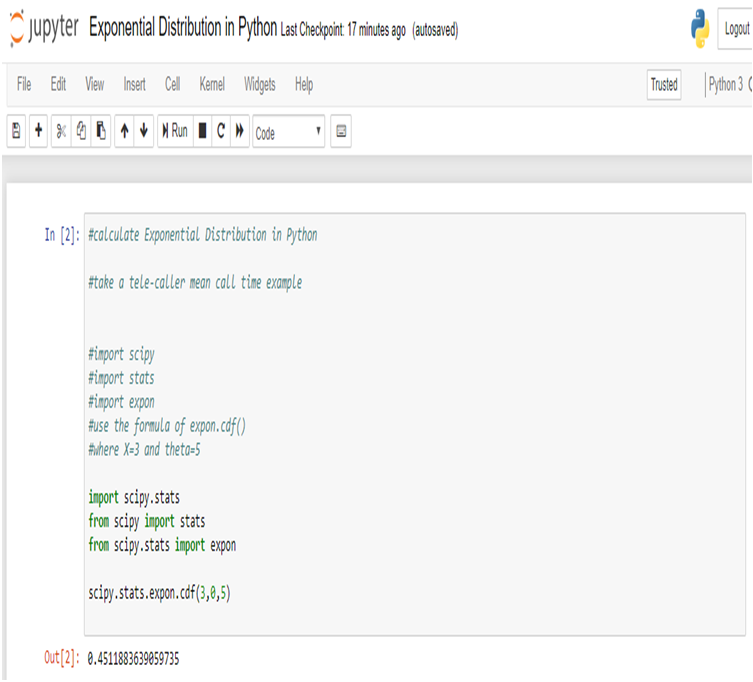
Assume that a telemarketer spends on “average” roughly 5 minutes on a call. Imagine they are on a call right now. You are asked to find out the probability that this particular call will last for 3 minutes or less.


Below we have illustrated how to calculate this probability using Python and R.

Calculate Exponential Distribution in R:

In R we calculate exponential distribution and get the probability of mean call time of the tele-caller will be less than 3 minutes instead of 5 minutes for one call is 45.11%.This is to say that there is a fairly good chance for the call to end before it hits the 3 minute mark.

Calculate Exponential Distribution in Python:

We get the same result using Python.

Conclusion:

We use exponential distribution to predict the amount of waiting time until the next event (i.e., success, failure, arrival, etc).

Here we try to predict that the probability of the mean call time of the telemarketer will be less than 3 minutes instead of 5 minutes for one call, with the help of Exponential Distribution. Similarly, the exponential distribution is of particular relevance when faced with business problems that involve the continuous rate of decay of something. For instance, when attempting to model the rate with which the batteries will run out. 

Data Science & Machine Learning Certification

Hopefully, this blog has enabled you to gather a better understanding of the exponential distribution. For more such interesting blogs and useful insights into the technologies of the age, check out the best Analytics Training institute Gurgaon, with extensive Data Science Courses in Gurgaon and Data analyst course in Delhi NCR.

Lastly, let us know your opinions about this blog through your comments below and we will meet you with another blog in our series on data science blogs soon.


Interested in a career in Data Analyst?

To learn more about Data Analyst with Advanced excel course – Enrol Now.
To learn more about Data Analyst with R Course – Enrol Now.
To learn more about Big Data Course – Enrol Now.

To learn more about Machine Learning Using Python and Spark – Enrol Now.
To learn more about Data Analyst with SAS Course – Enrol Now.
To learn more about Data Analyst with Apache Spark Course – Enrol Now.
To learn more about Data Analyst with Market Risk Analytics and Modelling Course – Enrol Now.

Alteryx is Inclined to Make Things Easy

Alteryx is Inclined to Make Things Easy

Alteryx Analytics is primarily looking to ease the usability of the platform in all of the updates that are yet to come. The esteemed data analytics platform is concentrating on reducing the complexities to attract more users and thus, widen their age-old user base beyond that of the data scientists and data analytics professionals.

Alteryx is headquartered in Irvine, California. It was founded as SRC LLC in 1997 and comes with a suite of four tools to help the world of data scientists and data analysts to manage and interpret data easily. Alteryx Connect, Alteryx Designer, Alteryx Promote and Alteryx Server are the main components of the analytics platform of Alteryx. Thus, it is worth mentioning that the Alteryx Certification Course is a must if you are looking to make a career out of data science/data analytics.

Deep Learning and AI using Python

A Quick Glance at the Recent Updates 

The reputed firm launched a recent version of Alteryx 2019.3, in October, and is likely to release the Alteryx 2019.4 as a successor to it. The latter is scheduled for a December release.

What’s in the Update?

Talking about the all-new version Alteryx 2019.3, Ashley Kramer, senior vice president of product management at Alteryx, said that the latest version promises 25 new and upgraded features, all of them focussing on the user-friendliness of the platform at large.

One of the prominent features of the new version is a significant decrease in the total number of clicks that a user will take to arrive at the option of visualizing data to make analytic decisions.

Data profiling helps the users to visualize the data while they are working with it. Here, Alteryx discovered a painless way to work with data by modeling the bottom of the screen in a format similar to that of MS Excel.

All of these changes and additions are done keeping in mind the features that the “customers had been asking for,” according to Kramer.

Now, with the December update, which will come with an enhanced mapping tool, the Alteryx analytics will strive to further lower the difficulties surrounding the platform.

2

If you are interested in knowing all the latest features, it is better to join one of the finest AlterYX Training institutes in Delhi NCR, with exhaustive Analytics Courses in Delhi NCRalong with other demanding courses like Python for Data Analysis, R programming courses in Gurgaonmatchless course of Big Data, Data Analytics and more.

 
The blog has been sourced fromsearchbusinessanalytics.techtarget.com/news/252474294/Alteryx-analytics-platform-focuses-on-ease-of-use
 

Interested in a career in Data Analyst?

To learn more about Data Analyst with Advanced excel course – Enrol Now.
To learn more about Data Analyst with R Course – Enrol Now.
To learn more about Big Data Course – Enrol Now.

To learn more about Machine Learning Using Python and Spark – Enrol Now.
To learn more about Data Analyst with SAS Course – Enrol Now.
To learn more about Data Analyst with Apache Spark Course – Enrol Now.
To learn more about Data Analyst with Market Risk Analytics and Modelling Course – Enrol Now.

How to Start a Successful Data Science Career?

How to Start a Successful Data Science Career?

The most common question we come across in DexLab Analytics HQ is how to take a step into the world of analytics and data science. Of course, grabbing a data science job isn’t easy, especially when there is so much hype going around. This is why we have put together top 5 ways to bag the hottest job in town. Follow these points and swerve towards your dream career.

Deep Learning and AI using Python

Enhance Your Skills

At present, LinkedIn in the US alone have 24,697 vacant data scientist positions. Python, SQL and R are the most common skills in demand followed by Tensorflow, Jupyter Notebooks and AWS. Gaining statistical literacy is the best way to grab these hot positions but for that, you need hands-on training from an expert institute.

If interested, you can check out analytics courses in Delhi NCR delivered by DexLab Analytics. They can help you stay ahead of the curve.

Create an Interesting Portfolio

A portfolio filled with machine learning projects is the best bet. Companies look for candidates who have prior work experience or are involved in data science projects. Your portfolio is the potential proof that you are capable enough to be hired. Thus, make it as attractive as possible.

Include projects that qualify you to be a successful data scientist. We would recommend including a programming language of your choice, your data visualization skill and your ability to employ SQL.

Get Yourself a Website

Want to standout from the rest? Build up your website, create a strong online presence and continuously add and update your Kaggle and GitHub profile to exhibit your skills and command over the language. Profile showcasing is of utmost importance to get recognized by the recruiters. A strong online presence will not only help you fetch the best jobs but also garner the attention of the leads of various freelance projects.

Be Confident and Apply for Jobs You Are Interested In

It doesn’t matter if you possess the skills or meet the job requirements mentioned on the post, don’t stop applying for the jobs that interest you. You might not know every skill given on a job description. Follow a general rule, if you qualify even half of the skills, you should apply.

However, while job hunting, make sure you contact recruiters, well-versed in data science and boost your networking skills. We would recommend you visit career fairs, approach family, friends or colleagues and scroll through company websites. These are the best ways to look for data science jobs. 

2

Improve Your Communication Skills

One of the key skills of data scientists is to communicate insights to different users and stakeholders. Since data science projects run across numerous teams and insights are often shared across a large domain, hence superior communication skill is an absolute must-have.

Want more information on how to become a data scientist? Follow DexLab Analytics. We are a leading data analyst training institute in Delhi offering in-demand skill training courses at affordable prices.


The blog has been sourced fromwww.forbes.com/sites/louiscolumbus/2019/04/14/how-to-get-your-data-scientist-career-started/#67fdbc0e7e5c


Interested in a career in Data Analyst?

To learn more about Data Analyst with Advanced excel course – Enrol Now.
To learn more about Data Analyst with R Course – Enrol Now.
To learn more about Big Data Course – Enrol Now.

To learn more about Machine Learning Using Python and Spark – Enrol Now.
To learn more about Data Analyst with SAS Course – Enrol Now.
To learn more about Data Analyst with Apache Spark Course – Enrol Now.
To learn more about Data Analyst with Market Risk Analytics and Modelling Course – Enrol Now.

5 Full-Stack Data Science Projects You Need to Add to Your Resume Now

5 Full-Stack Data Science Projects You Need to Add to Your Resume Now

Small or big, most of the organizations seek aspiring data scientists. The reason being this new breed of data experts helps them stay ahead of the curve and churns out industry-relevant insights.

It hardly matters if you are a fresher or a college dropout, with the right skill-set and basic understanding of nuanced concepts of machine learning, you are good to go and pursue a lucrative career in data science with a decent pay scale.

However, whenever a company hires a new data scientist, the former expects that the candidate had some prior work experience or at least have been a part in a few data science-related projects. Projects are the gateway to hone your skills and expertise in any realm.  In such projects, a budding data scientist not only learns how to develop a successful machine learning model but also solves an array of critical tasks, which needs to be fulfilled single-handedly. The tasks include preparing a problem sheet, crafting a suitable solution to the problem, collect and clean data and finally evaluate the quality of the model.

Below, we have charted down top 5 full-stack data science projects that will boost your efforts of preparing an interesting resume.

Deep Learning and AI using Python

Face Detection

In the last decade, face detection gained prominence and popularity across myriad industry domains. From smartphones to digitally unlocking your house door, this robust technology is being used at homes, offices and everywhere.

Project: Real-Time Face Recognition

Tools: OpenCV, Python

Algorithms: Convolution Neural Network and other facial detection algorithms

Spam Detection

Today, the internet plays a crucial role in our lives. Nevertheless, sharing information across the internet is no mean feat. Communication systems, such as emails, at times, contain spam, which results in decreased employee productivity and needs to be avoided.

Project: Spam Classification

Tools: Python, Matplotlib

Algorithm: NLTK

Sentiment Analysis

If you are from the Natural Language Processing and Machine Learning domain, sentiment analysis must have been the hot-trend topic. All kinds of organizations use this technology to understand customer behaviors and frame strategies. It works by combining NLP and suave machine learning technologies.

Project: Twitter Sentiment Analysis

Tools: NLTK, Python

Algorithms: Sentiment Analysis 

Time Series Prediction

Making predictions regarding the future is known as extrapolation in the classical handling of time series data. Modern researchers, however, prefer to call it time series forecasting. It is a revolutionary phenomenon of taking models perfect on historical data and using them for future prediction of observations.

Project: Web Traffic Time Series Forecasting

Tools: GCP

Algorithms: Long short-term memory (LSTM), Recurrent Neural Networks (RNN) and ARIMA-based techniques

2

Recommender Systems

Bigwigs, such as Netflix, Pandora, Amazon and LinkedIn rely on recommender systems. The latter helps users find out new and relevant content and items. In simple terms, recommender systems are algorithms that suggest users meaningful items based on his preferences and requirements.

Project: Youtube Video Recommendation System

Tools: Python, sklearn

Algorithms: Deep Neural Networks, classification algorithms

If you are a budding data scientist, follow DexLab Analytics. We are a premier data science training platform specialized in a wide array of in-demand skill training courses. For more information on data science courses in Gurgaon, feel free to drop by our website today.


The blog has been sourced fromwww.analyticsindiamag.com/5-simple-full-stack-data-science-projects-to-put-on-your-resume


Interested in a career in Data Analyst?

To learn more about Data Analyst with Advanced excel course – Enrol Now.
To learn more about Data Analyst with R Course – Enrol Now.
To learn more about Big Data Course – Enrol Now.

To learn more about Machine Learning Using Python and Spark – Enrol Now.
To learn more about Data Analyst with SAS Course – Enrol Now.
To learn more about Data Analyst with Apache Spark Course – Enrol Now.
To learn more about Data Analyst with Market Risk Analytics and Modelling Course – Enrol Now.

Call us to know more