While dealing with data distribution, Skewness and Kurtosis are the two vital concepts that you need to be aware of. Today, we will be discussing both the concepts to help your gain new perspective.
Skewness gives an idea about the shape of the distribution of your data. It helps you identify the side towards which your data is inclined. In such a case, the plot of the distribution is stretched to one side than to the other. This means in case of skewness we can say that the mean, median and mode of your dataset are not equal and does not follow the assumptions of a normally distributed curve.
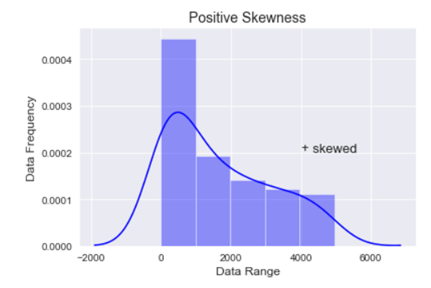
Positive skewness:- When the curve is stretched towards the right side more it is called a positively skewed curve. In this case mean is greater than median and median is the greater mode
(Mean>Median>Mode)
Let’s see how we can plot a positively skewed graph using python programming language.
- First we will have to import all the necessary libraries.

- Then let’s create a data using the following code:-

In the above code we first created an empty list and then created a loop where we are generating a data of 100 observations. The initial value is raised by 0.1 and then each observation is raised by the loop count.
- To get a visual representation of the above data we will be using the Seaborn library and to add more attributes to our graph we will use the Matplotlib methods.

In the above graph you can see that the data is stretched towards right, hence the data is positively skewed.
Since each observation in the dataset is unique mode cannot be calculated.
Calculation of skewness:
Formula:-
- In case we have the value of mode then skewness can be measured by Mode ─ Mean
- In case mode is ill-defined then skewness can be measured by 3(Mean ─ Median)
- To obtain relative measures of skewness, as in dispersion we use the following formula:-
When mode is defined:-
 When mode is ill-defined:-
To calculate positive skewness using Python programming language we use the following code:-
Negative skewness:- When the curve is stretched towards left side more it is called a negatively skewed curve. In this case mean is less than median and median is mode.
(Mean<Median<Mode)
Now let’s see how we can plot a negatively skewed graph using python programming language.
Since we have already imported all the necessary libraries we can head towards generating the data.|
In the above code instead of raising the value of observation we are reducing it.
The above graph is stretched towards left, hence it is negatively skewed.
The above result shows that the value of mean is less than mode and since each observation is unique mode cannot be calculated.
Kurtosis
Kurtosis is nothing but the flatness or the peakness of a distribution curve.
- Platykurtic :- This kind of distribution has the smallest or the flattest peak.
- Misokurtic:- This kind of distribution has a medium peak.
- Leptokurtic:- This kind of distribution has the highest peak.
The video attached below will help you clear any query you might have.
So, this was the discussion on the Skewness and Kurtosis, at the end of this you have definitely become familiar with both concepts. Dexlab Analytics blog has informative posts on diverse topics such as neural network machine learning python which you need to explore to update yourself. Dexlab Analytics offers cutting edge courses like machine learning certification courses in gurgaon.
.
Machine Learning Certification, Machine Learning course, Machine Learning course in Gurgaon, Machine Learning course online, Machine Learning Courses, Machine Learning Training, Machine Learning Using Python, neural network course, Neural Networks, Neural Networks Training, Uncategorized


