It seems some good news is waiting for you – honing your data for effective reports are easier now with the 8.1 release of SAS Visual Analytics. In this technical blog, we will understand the structure of data pane, how it exhibits data from an active data source, and a handful number of tasks, which you might want to perform – like viewing measure details, adjusting data item properties and fabricating geographic data items, custom categories and hierarchies.
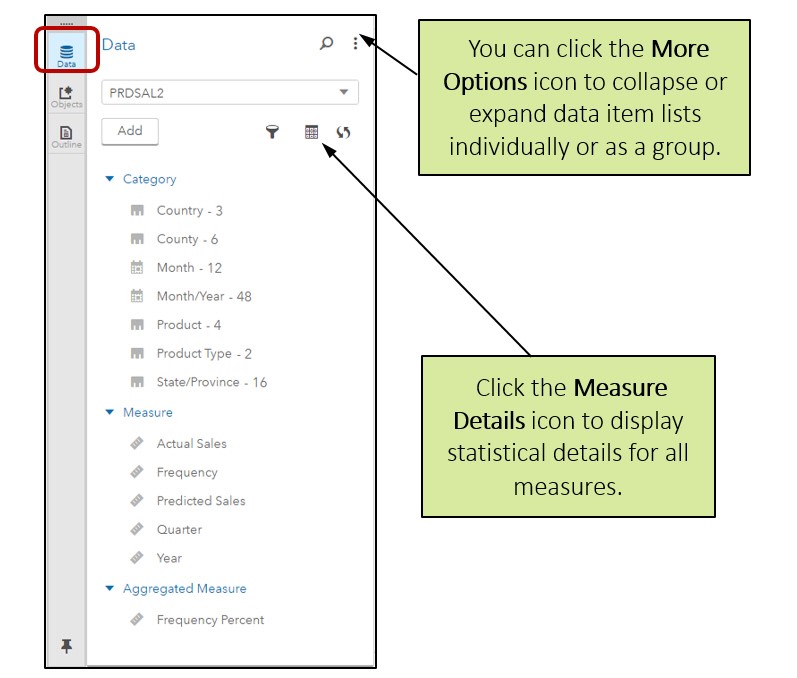
Click the Data icon on the left menu and display the Data pane, in the SAS Visual Analytics interface:
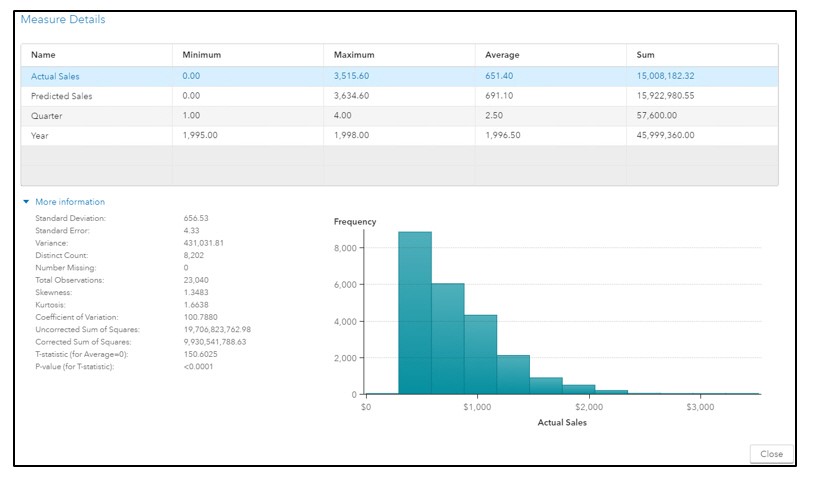
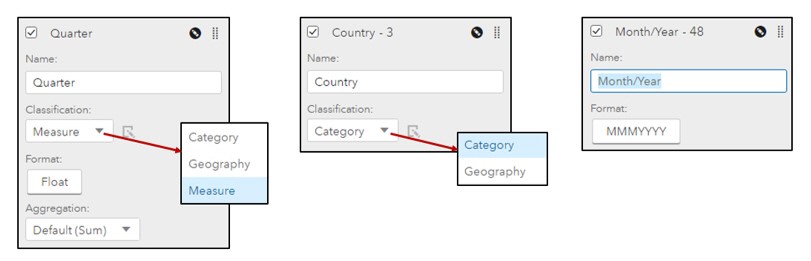
Measure details:
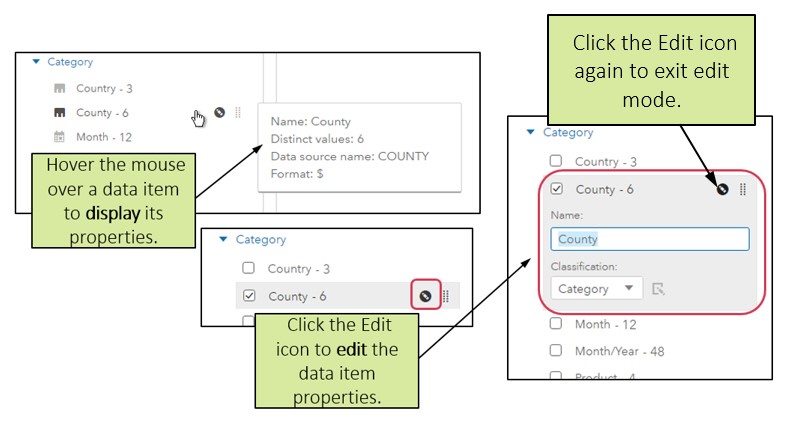
After viewing the following data item properties, these are the following changes you can make:
- The name of a data item
- The category data item or classification of measure
- Date/time/datetime data item or the format of a Measure
- The agglomeration of a Measure data item
A measure classification can be altered to Geography or Category. A Category classification can be changed to Geography. However, Date and Time classification cannot be changed.
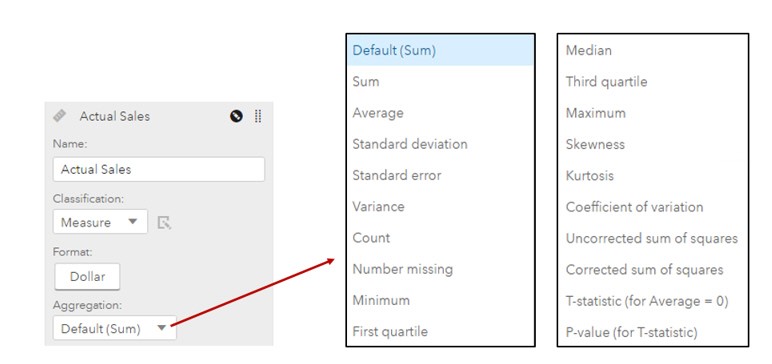
The aggregation for a Measure data item can be modified:
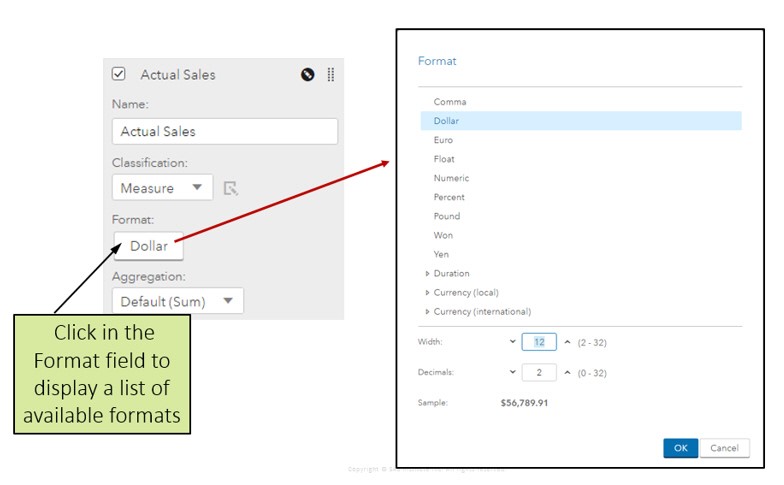
Measure formats can be modified:
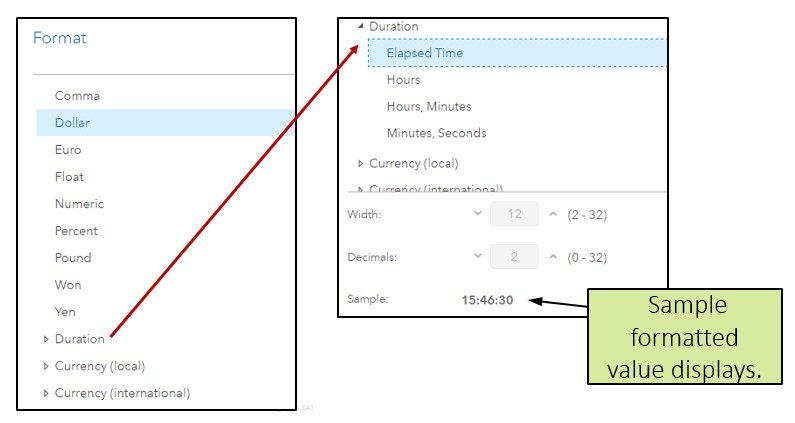
Expand to display available Duration and Currency formats:
Geography data items recognise a geographic spot, and are mostly used to visualize data on a geographic map.
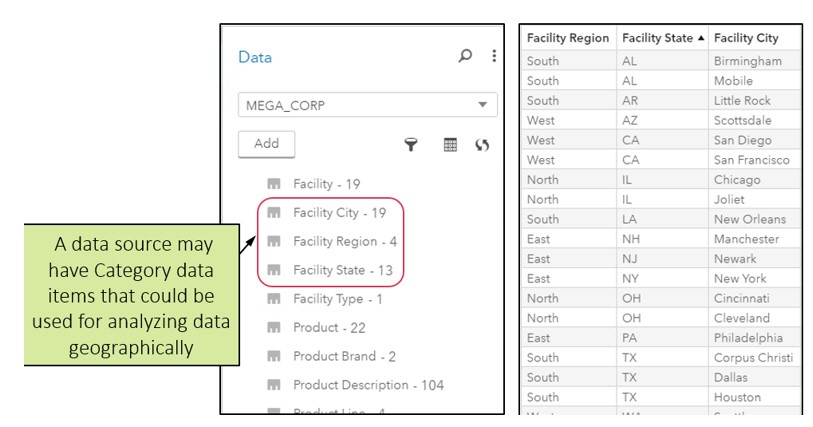
Assigning a Geography data item:

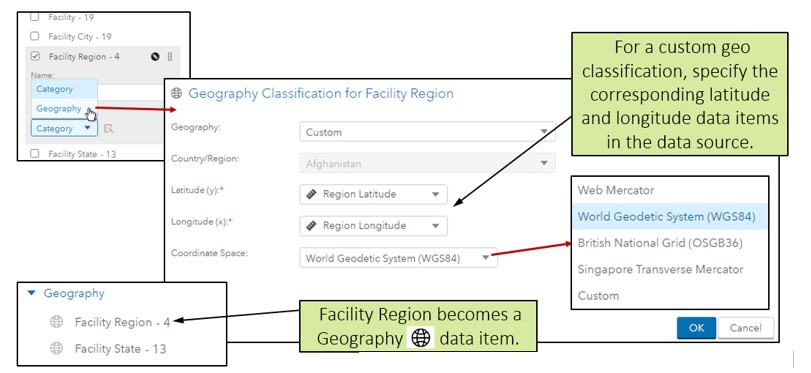
Classifying a custom Geography data item:
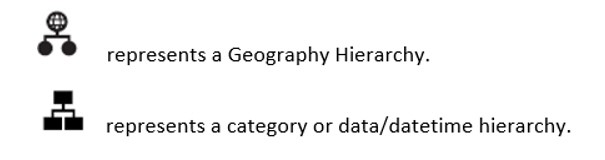
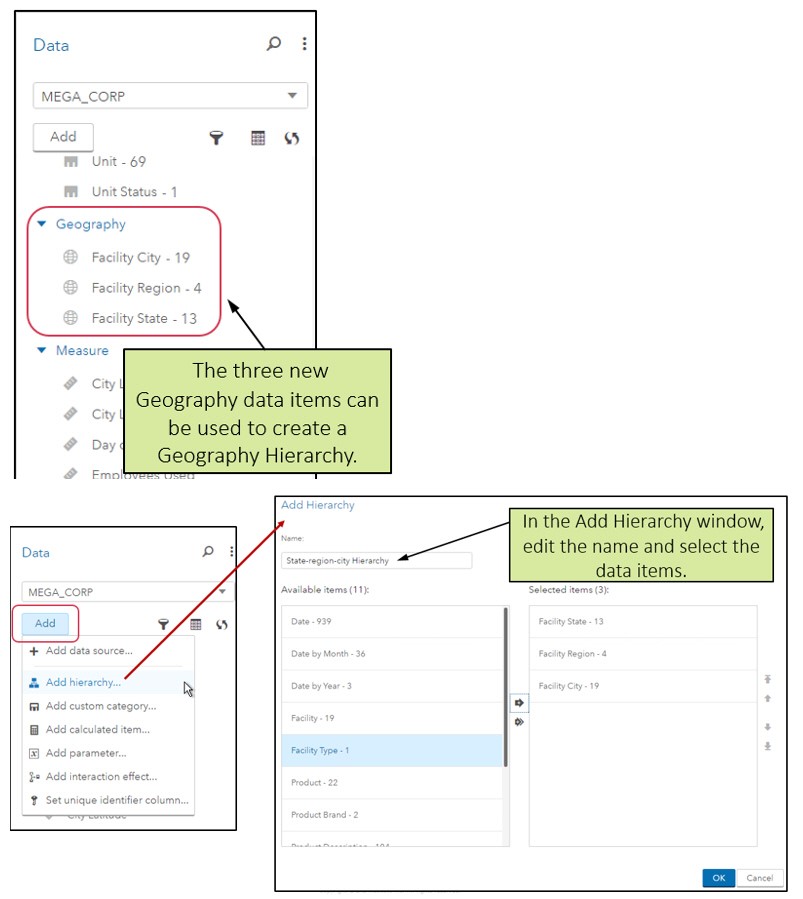
Take the help of hierarchy as it helps you to add drill-down functionality to a report.
- A hierarchy displays information from general to specific
- Creates category, date/datetime or geography hierarchies
- Don’t expect that all report objects will support all types of hierarchies
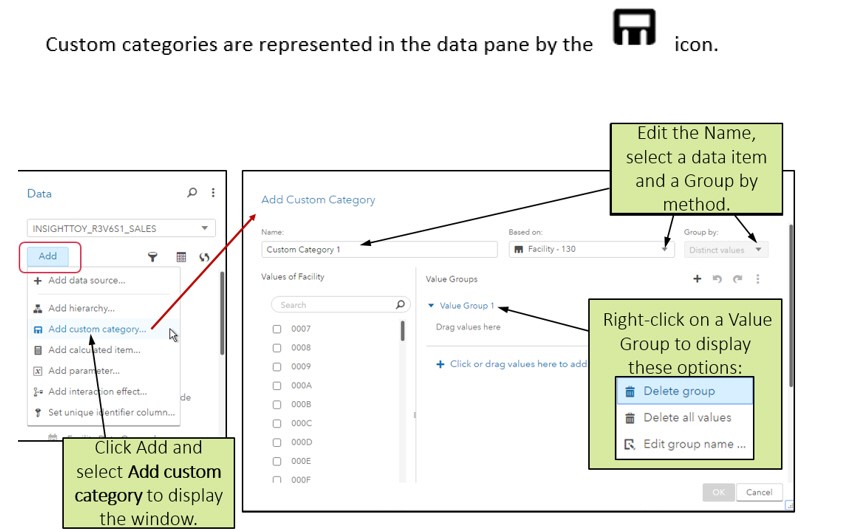
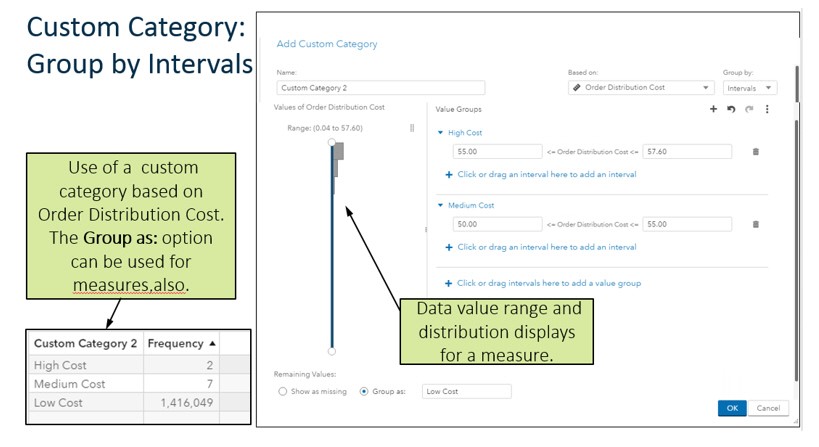
- A custom category associates with a set of alphanumeric values with ranges, intervals or specific values of a data item.
- It is based on a category or a measure data item.
- It offers functionality in a report in a same way a user-defined format provides.
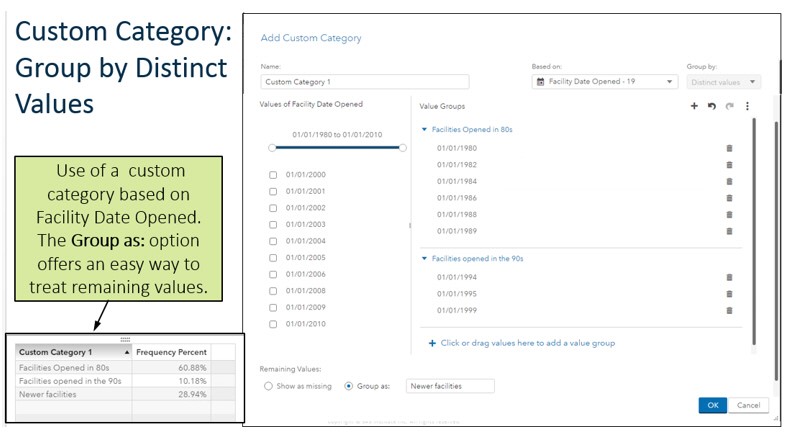
Example:
1-20 = ‘First group’
21-30 = ‘Second group’
31-40 = ‘Third group’
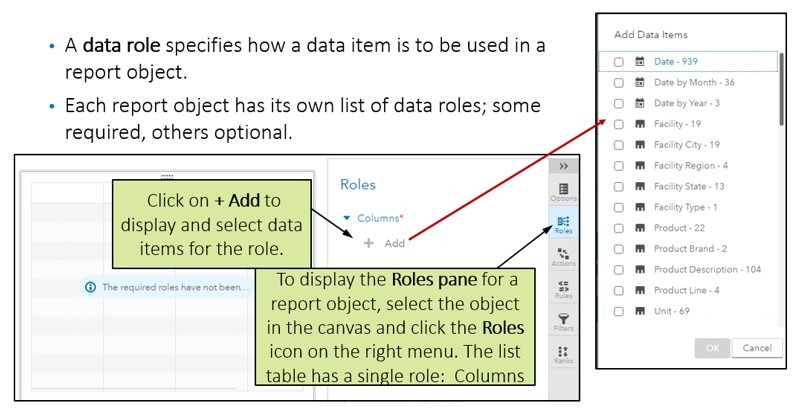
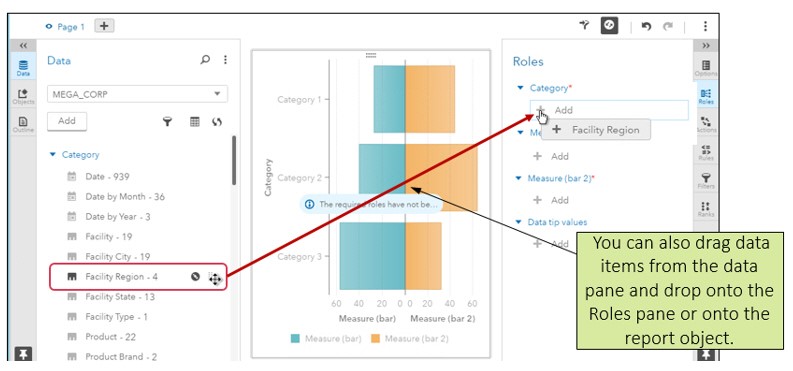
Based on the report object, some roles are in need of one value, while other roles demand multiple values.
Right click on a data item in the Roles pane to eliminate the data item from a role.
Duplicating a data item may end up in exhibiting data in two different ways.
Duplicating a Measure data item can also allow you to use the column as a category data item in reports too.
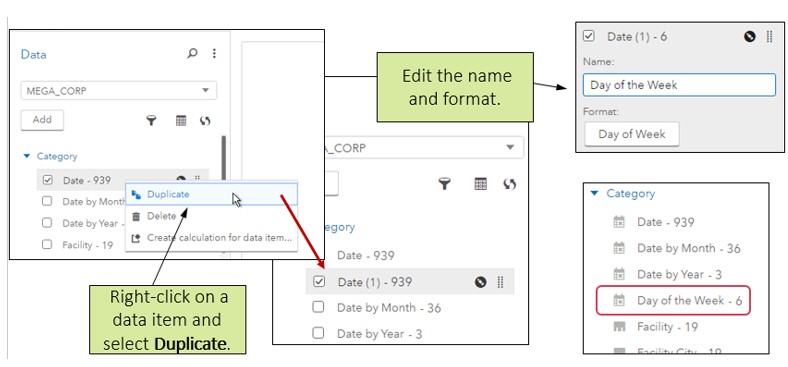
NOTA BENE – You would be able to delete data items that you have generated, like duplicated data items or calculated data items.
Want to get enrolled in a SAS certification for predictive modelling course? Look no further, DexLab Analytics is here with a range of highly intensive SAS analytics courses in Pune and Gurgaon. Scan your eyes through our encompassing courses and suit yourself well!
Interested in a career in Data Analyst?
To learn more about Machine Learning Using Python and Spark – click here.
To learn more about Data Analyst with Advanced excel course – click here.
To learn more about Data Analyst with SAS Course – click here.
To learn more about Data Analyst with R Course – click here.
To learn more about Big Data Course – click here.