For creating brilliant data visualization, first you need to know which visual chart type would be ideal for the data story you want to tell. In this post, we will explore maps in Tableau, when and where they seem to be appropriate for particular data visualization, and how to make them more productive. If you want to use a map, make sure you know the reason why.
Maps help you attain, authenticate, or communicate spatial patterns with data. With these maps, you should start your presentation with a spatial question. This spatial question ensures that your map will perfectly find you an answer in the best way possible.
For example, answer this question using a data map:
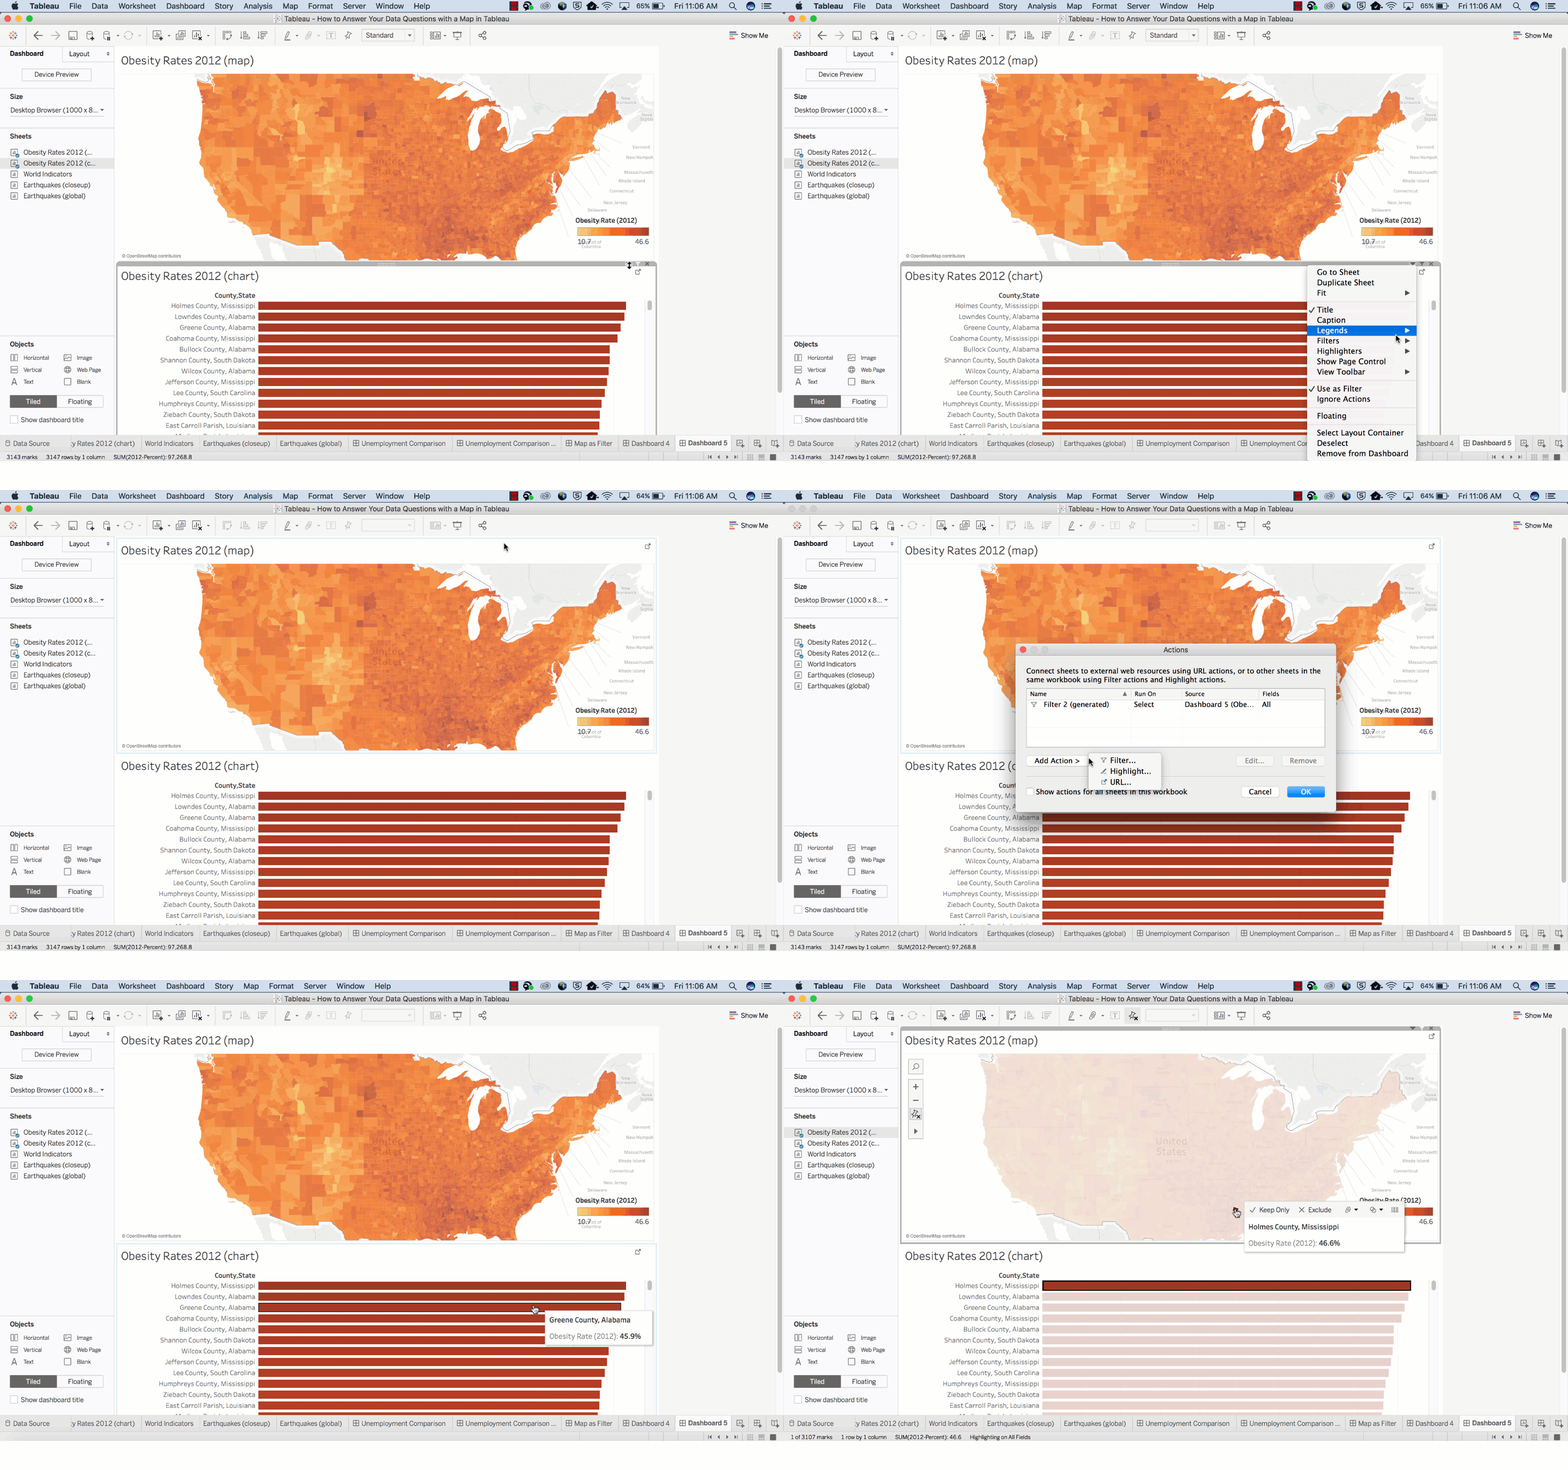
Which country in the US suffers from the highest obesity rate?
How much time did it take to answer that question? Did you quickly find the actual location without fuddling too much over the darker-colored country? I guess not. However, this map might not be the best path to answer this spatial question.
Now, let’s use the bar chart below to answer the same question.

It is easier to discover the answer here.
By combining the map and bar chart together, the answer to your spatial question can easily be derived.

Basically, maps are great for answering these two types of spatial questions:
- What is the value for a specific location or mark on the map?
- How do patterns compare between locations, regions, or attributes?
Go through the following tips to answer these questions better.
How to determine the value for a specific location or a mark on map?
Tooltips are the perfect way to move your mouse over a mark and observe a list of all the underlying dimensions and measures present.
You can easily edit a tooltip to include both dynamic and static text.
For example, identify which of these tooltips reveals a story about earthquakes in Japan.
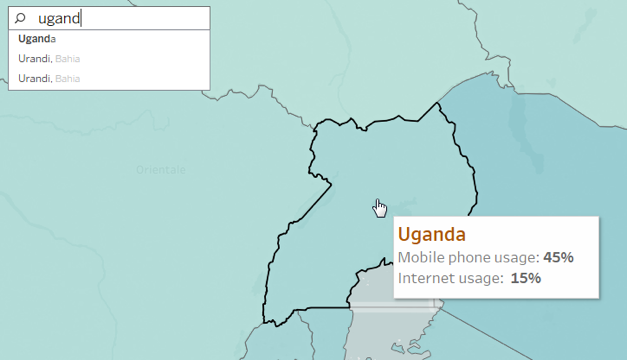
Also, the Tooltip improves speed-to-insight because the viewers of the map can easily find individual locations they want to find.
For example, find out the internet usage percentage in Uganda.
How do patterns compare between regions, locations or attributes?
To give answer to this question with a map, you must allow a direct comparison to be established between the data, symbols and even colors.
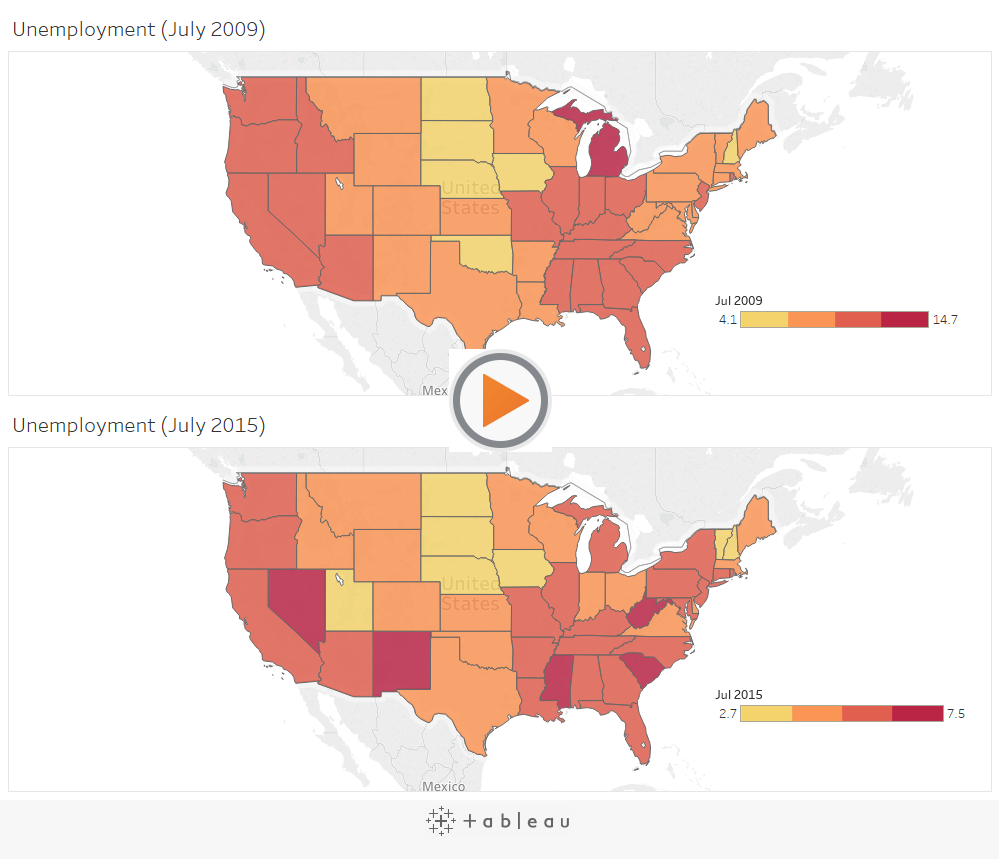
For example, while establishing a comparison between these two sets of unemployment data, the default color encoding doesn’t add any value for making direct comparisons. The reason being: the dark red doesn’t stand for the same value in both maps.
In turn, this situation can be very confusing for users who have no idea about the details of the data.
The best way to deal with the problem is by getting an assurance that the color ramps in both maps use the same range.
Also, you can make your date easier for comparison by adjusting the color scheme, so that different color groups exude similar semantic meaning. Semantically-resonant colors help in processing information faster.
In case, you want to learn more about Tableau, check out our blogs published on DexLab Analytics. We offer state-of-the-art Tableau training courses in Delhi, for any assistance reach out to us.
Interested in a career in Data Analyst?
To learn more about Data Analyst with Advanced excel course – Enrol Now.
To learn more about Data Analyst with R Course – Enrol Now.
To learn more about Big Data Course – Enrol Now.To learn more about Machine Learning Using Python and Spark – Enrol Now.
To learn more about Data Analyst with SAS Course – Enrol Now.
To learn more about Data Analyst with Apache Spark Course – Enrol Now.
To learn more about Data Analyst with Market Risk Analytics and Modelling Course – Enrol Now.


