On 10th January, 2018 Tableau 10.5 was launched!
Once you upgrade yourself to Tableau’s latest version, you will automatically get access to Hyper, Tableau’s new, licensed data engine technology. Hyper harbors the cutting edge technology to deliver up to 3x enhanced extract creation speed and up to 5x improved query performance.
And it’s just the beginning. Tableau 10.5 brings forth Tableau Server on Linux, nested projects, viz in the tooltip, and lot more.
We will discuss about Tableau Server on Linux in a latter post.
This post will solely focus on other noted Tableau features, especially Hyper.
Ensuring Analytics at Hyper Speed
For faster data ingestion and smoother analytical query processing of huge, intricate data sets, Hyper is the new kid in the block. It is Tableau’s latest, in-memory data engine technology, which works on substantially huge data sets to ensure you fresh and crisp data within unimaginable time period. By being at the heart of Tableau, it encounters faster query response times to keep the flow of analysis intact and help enterprises scale extracts for wider usage. Organizationally, it bolsters larger deployments by leveraging the latest hardware developments and new query parallelization.
How does it work?
Designed for analytical and transactional data workloads, Hyper is a fast in-memory framework from the house of Tableau. Without compromising performance, it leverages data-centric code generation mechanisms and stands strong on a single columnar storage space for all workloads. All this, helps Hyper take visual analytics a step closer to the transactional systems that exists in most of the businesses. While the working mechanism of Hyper may sound complicated, the user experience remains largely simple for Tableau users.
Upgrade to Tableau 10.5 is seamless. No migration is required. You just need to simply upgrade to the new version of Tableau and kickstart with Hyper!
Once you do that, your existing extracts will instantly get converted to the new .hyper format during a manual or scheduled refresh.
Engaging Vizzes With Viz In Tooltip
In Tableau 10.5, you will get to create amazing vizzes and dashboards with Viz in Tooltip. This robust new feature lets you interact with your data in an intense manner and enhance dashboard real estate. This is done by embedding contextual visualizations through a tooltip, without penning a single line of code.
Go streamline your stories and dashboards or watch new insights within context, while saving up space and keeping designs starkly clean, all with an incredible tool Viz in Tooltip!
Flexible Content Management and Sharing
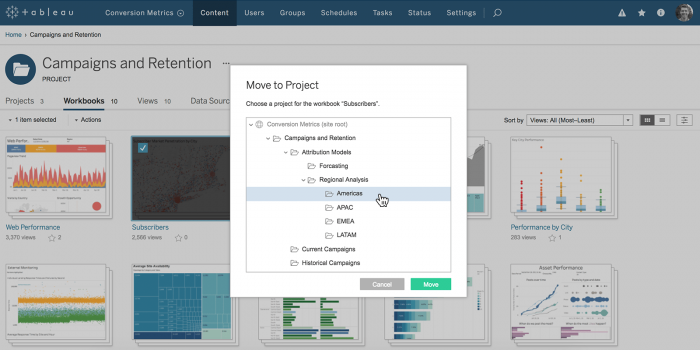
Thanks to nested projects, you can now simply nest projects within projects – it makes organizing workbooks as easy as pie, ensuring everyone in your organization find what they are looking for.
To ensure security to your files, customize permissions at each level or go for a top down permissioning construction.
For better workbook compatibility, Tableau guys are trying their best to make it easier to work between different versions of Tableau.
Annotation and Sharing of Vizzes Were Never So Easy
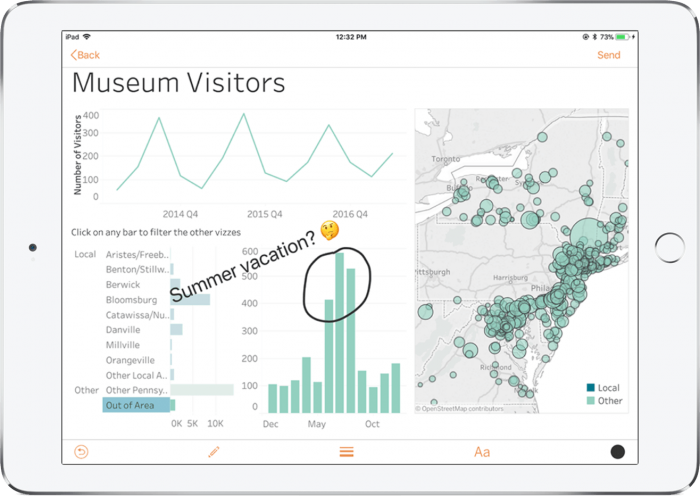
Annotate and Share option is now available. On Tableau Mobile for Ios. This striking feature has made it easier to send a note or highlight an intriguing data point. Just plot and add text on the viz snapshot and send it through Slack, email or simply text right away from your desk.
To learn more about Tableau features, try taking up Tableau BI training courses Delhi NCR from DexLab Analytics. Being one of the prime Tableau training institutes in Delhi, DexLab offers state-of-the-art kind of training facilities and course curriculum.
Interested in a career in Data Analyst?
To learn more about Machine Learning Using Python and Spark – click here.
To learn more about Data Analyst with Advanced excel course – click here.
To learn more about Data Analyst with SAS Course – click here.
To learn more about Data Analyst with R Course – click here.
To learn more about Big Data Course – click here.


