In this blog post, we will learn how to simulate multiple samples efficiently. In order to keep the discussion, easy we have simulated a single sample with ‘n’ number of observations, and ‘p’ amount of variables. But in order to use the Monte Carlo method to approximate the distribution sampling of statistics, one needs to simulate many specimens with the same regression model.
The data steps in SAS in most blogs have 4 steps mentioned for so. However, to simulate multiple samples, put DO loop around these steps that will generate, the error term and the response variable for very observation made in the model.
With this following program we can create a single data set that will include the following: NumSamples (=100) samples. Here every sample will be identified with an ordinal variable named SampleID.
Seeking SAS courses in Pune? DexLab Analytics is now in Pune, after Delhi NCR!
/* Simulate many samples from a  linear regression model */
%let N = 50;            /* N = sample size               */
%let nCont = 10;        /* p = number of continuous variables */
%let NumSamples = 100;  /* number of samples                  */
data SimReg(keep= SampleID i Y x:);
call streaminit(54321);
array x[&nCont];        /* explanatory variables are named x1-x&nCont */

/* 1. Specify model coefficients. You can hard-code values such as
array beta[0:&nCont] _temporary_ (-4 2 -1.33 1 -0.8 0.67 -0.57 0.5 -0.44 0.4 -0.36);
      or you can use a formula such as the following */
array beta[0:&nCont] _temporary_;
do j = 0 to &nCont;
   beta[j] = 4 * (-1)**(j+1) / (j+1);       /* formula for beta[j] */
end;

do i = 1 to &N;              /* for each observation in the sample */
   do j = 1 to &nCont;
      x[j] = rand("Normal"); /* 2. Simulate explanatory variables  */
   end;

   eta = beta[0];                       /* model = intercept term  */
   do j = 1 to &nCont;
      eta = eta + beta[j] * x[j];       /*     + sum(beta[j]*x[j]) */
   end;

   /* 5. simulate response for each sample */
   do SampleID = 1 to &NumSamples;      /* <== LOOP OVER SAMPLES   */
      epsilon = rand("Normal", 0, 1.5); /* 3. Specify error distrib*/
      Y = eta + epsilon;                /* 4. Y = model + error    */
      output;
   end;
end;
run;
The best way to do the analysis of the simulated samples with the use of SAS is by making use of the BY-group processing. With the aid of this BY-group processing, we can assess all samples with a single call procedure. The below mentioned process will sort the data with the SampleID variable and call PROC REG and conduct analysis of all the samples. With NOPRINT option, one can make sure the process does not spew out several thousand of graphs and tables. With the option OUTEST= option you can save the estimates of the parameters for every samples to a SAS data set.
proc sort data=SimReg;
   by SampleID i;
run;

proc reg data=SimReg outest=PE NOPRINT;
   by SampleID;
   model y = x:;
quit;
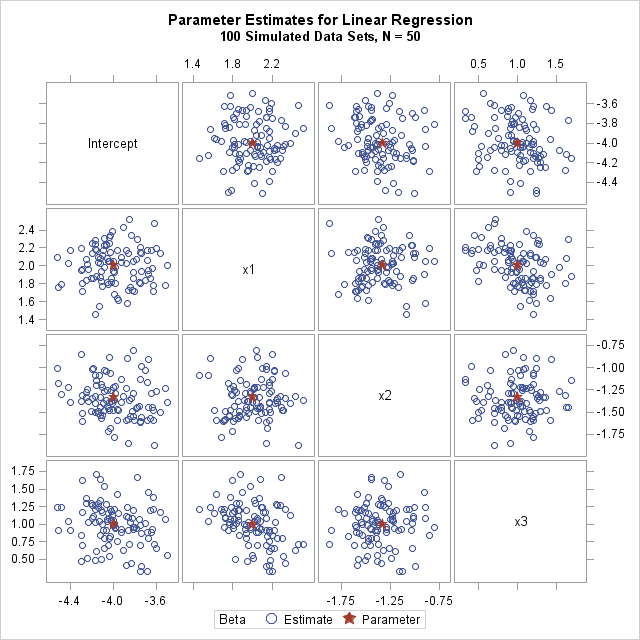
With the PE data set that includes the NumSamples, row. With each row having the p parameter will help to estimate for the assessment of one simulated sample. With the distribution of the estimate being an approximation which is closest to the theoretical sample distribution of statistics.
The below mentioned image visualization offers an exhibit of the joint distribution of the estimates for 4 coefficients of regression. As one can see that, the distribution of the estimates will appear to be centred normal and multivariate as the population parameter values.
With a proper SAS predictive modeling training one can learn to simulate the data, analyze it and produce insightful graphs. This is the most efficient and also highly in demand program, so hurry to take up a SAS training courses in Noida from industry leaders.
This post originally appeared on – blogs.sas.com/content/iml/2017/02/01/simulate-samples-linear-regression.html
Interested in a career in Data Analyst?
To learn more about Machine Learning Using Python and Spark – click here.
To learn more about Data Analyst with Advanced excel course – click here.
To learn more about Data Analyst with SAS Course – click here.
To learn more about Data Analyst with R Course – click here.
To learn more about Big Data Course – click here.
Institute, news, online certification, online courses, sas certification, Sas course, SAS Predictive Modelling, SAS training courses, Sas training institute