Are you bushed of creating reports in Excel? Do you feel annoyed every time you extract data from multiple platforms to develop website traffic reports?

Here we have some good news for y’all!
Two of Tableau’s own marketers have invented a next-level website analytics dashboard loaded with custom traffic metrics to turn reporting as easy as cake, and they are going to showcase it at TC17 in their breakout session Disparate measures: Tableau marketing’s DIY ethos and custom reporting.
Here’s a quick round-up of the upcoming session; come, take a look:
Tackling the issue of disparate data in website analytics reporting
Google Analytics is the cornerstone of majority of website analytics reports. Or else your customized web analytics software.
However, often there arises a problem of not having enough data for your report. This is when you need to start appending – recording data on a spreadsheet helps in viewing it side by side. For better reports, you may also introduce search console data, or Adwords data. Or else, if you are someone from the marketing department that relies on more cutting edge solutions for website traffic analysis, you might have to show your assertion towards some third party tool data, like Moz, Buzzsumo or others.
Now, a lot of data remains idle that is not being leveraged properly – though this data can solve various issues related to website’s health and traffic, but it can also complicate reporting.
So, have you thought how to complete reporting effectively in spite of having so much data at your disposal? We have the solution here – and that solution is Tableau.

How Tableau helps in solving the siloed website analytics trouble?
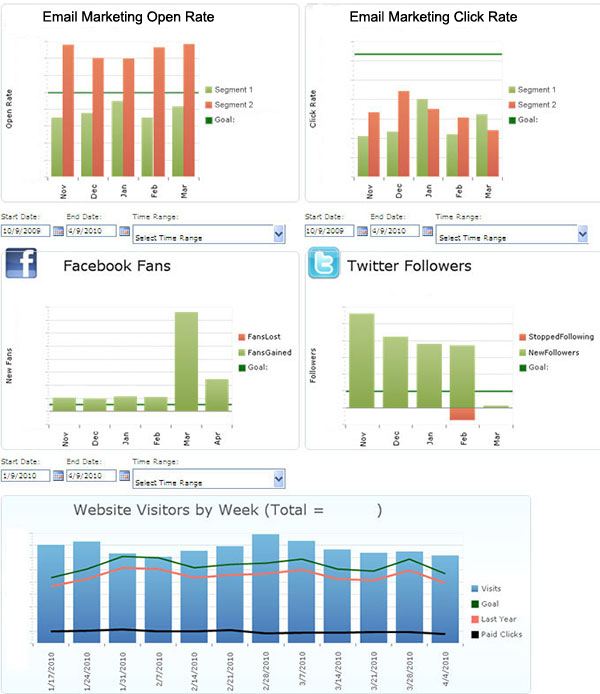
Data siloing is wreaking havoc in the marketing domain, and preventing marketers from understanding the sentiments of their audiences. This news is spilled over all the leading newspapers and digital tabloids. But of course, very few marketing departments discern that their entire website data is mostly siloed – a lot of company’s reports include paid search, PR, social, display advertising, and organic search traffic, and they are largely treated as separate channels. However, in reality each of these channels impacts the other, hence noteworthy.
Take part in this breakout session to grasp how Tableau is merging data sources and developing website traffic dashboards to reveal the true picture to specialists, directors, analysts, mangers and even CMOs along with the right amount of detailing.
In what ways Tableau is different from its counterparts?
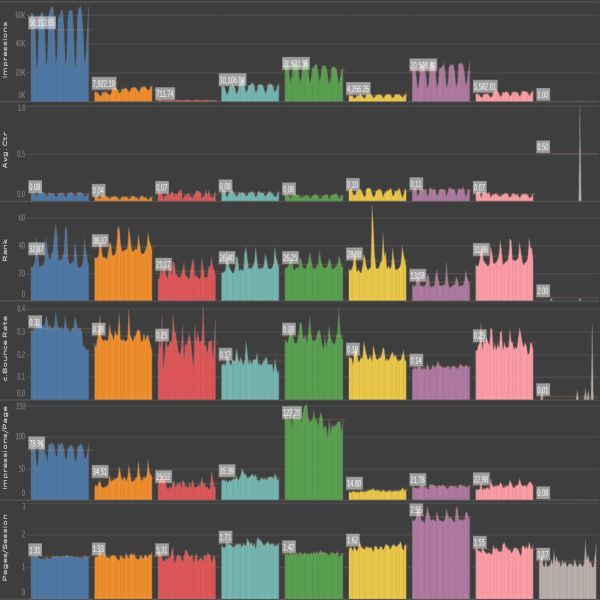
Generally, a majority of website analytics tools rely on hidden calculations to generate visualizations. And in most of the cases, they exude desired results, but in case of some metrics or departments or users the default setting may not be feasible for the results you want.
As a result, Tableau is the tool that offers flexibility to combine together some of the most common data sources and few of the least common data sources to derive real insights found clogged in our website traffic and CMS’.
Some of the most common data sources to use are:
- Google Analytics
- ScreamingFrog Web Crawler
- Under Search Consoles : Baidu, Naver, So.com, Bing
- Drupal Database
- Majestic backlink tool
Who are going to gain maximum from this breakout session?
Mainly the web marketers: such as SEOs, content marketers, content managers, webmasters, email marketers, PPC analysts, and anyone who hails from marketing division whose strokes on websites matters.
Are you someone who deals with data for website analytics? Then this is for you too.
To learn more about Tableau, opt for Tableau training courses in Pune. DexLab Analytics offers excellent Tableau bi training courses, get certified today!
Watch Tableau introduction video here
Interested in a career in Data Analyst?
To learn more about Machine Learning Using Python and Spark – click here.
To learn more about Data Analyst with Advanced excel course – click here.
To learn more about Data Analyst with SAS Course – click here.
To learn more about Data Analyst with R Course – click here.
To learn more about Big Data Course – click here.
Tableau, tableau certification, tableau certification delhi, tableau training in pune, tableau training institute