Before delving deeper into the analysis of bank data using R, let’s have a quick brush-up of R skills.
As you know, R is a well-structured functional suite of software for data estimation, manipulation and graphical representation.
Where to use R
Well, R is undeniably great software but it doesn’t suffices to be the key to every problem. It is very nifty to plot graphics, analyzing data and pinning statistical models, but it fails to perform when it comes to storing data in intricate structures, querying data accurately or playing with data that ill-fits computer memory.
How R enjoys a certain edge over its commercial counterparts
Capability
There are countless statistical and data analysis algorithms in R and none of its rivals offer this much diverseness in functionality that is accessible through CRAN.
Community
R users around the globe would be in millions, and the rate is still growing at an exponential rate. Owing to a huge community, anytime you will find someone eager to solve your problem. Visit forums or communities to keep updated always.
Performance
R’s performance always lies above the mark. R loads datasets into its memory before it starts processing. The most important thing is to have a reliable configuration machine so as to best use its functionality to the utmost level. And, we feel this is one of the biggest reasons for such huge expansion rates of R users.
Steps of Data Mining-Discover and interpret patterns from data with these following steps:
Step 1: Understanding the data, while loading and developing
Import the files that are saved in HDFS in Hadoop from Pig named “combined_out”
Set Hadoop variables for Hadoop in R environment
Sys.setenv(JAVA_HOME="/home/abhay/java")
Sys.setenv(HADOOP_HOME="/home/abhay/hadoop")
Sys.setenv(HADOOP_CMD="/home/abhay/hadoop/bin/hadoop")
Sys.setenv(HADOOP_STREAMING="/home/abhay/hadoop/share/hadoop/tools/lib/hadoop-streaming-2.2.0.jar")
Loading RHadoop packages
library(rmr2)
library(rhdfs)
hdfs.init()
Set up of Hadoop root path and read files from HDFS
hdfs.root <- '/bank_project'
hdfs.data <- file.path(hdfs.root, 'combined_out/part-r-00000')
final_bank_data <- hdfs.read.text.file(hdfs.data)
content<-hdfs.read.text.file(hdfs.data)
clickpath<-read.table(textConnection(content),sep=",")
Step 2: Develop a target dataset
Give names to all the columns picked from HDFS
colnames(clickpath) <- c("ac_id","disposal_type","age","sex","card_type","dist","avg_sal","unemp_rate","entrepreneur_no","trans_sum","loan_amount","loan_status")Step 3: Preprocessing and data cleaning procedure
Examining structure of the already fetched data
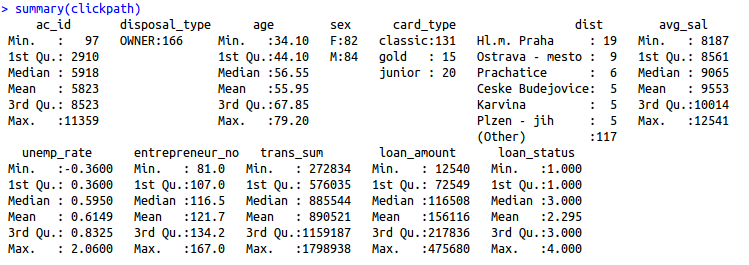
A compilation of missing values
list of rows with missing values
clickpath[!complete.cases(clickpath),]
list of columns with missing values
clickpath[,!complete.cases(clickpath)]
If you find any missing value, omit them
clickpath <- na.omit(clickpath,na.action=TRUE)
Step 4: Data reduction and projection
Choosing only numerical data and deleting ac_id column
mydata <- clickpath[,c(3,7:11)]
Check the comprehensive set of components for outliers
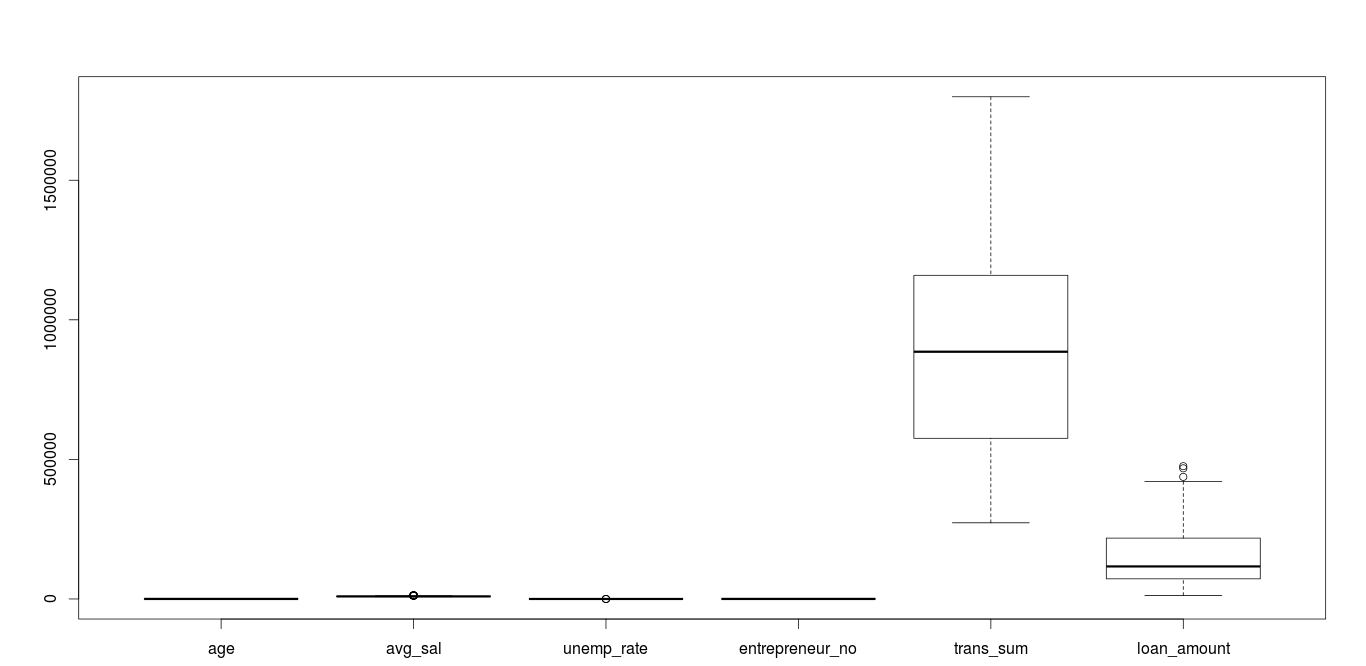
Avg_sal, unemp_rate and loan amount has some outliers in the data, come lets analyze them individually.
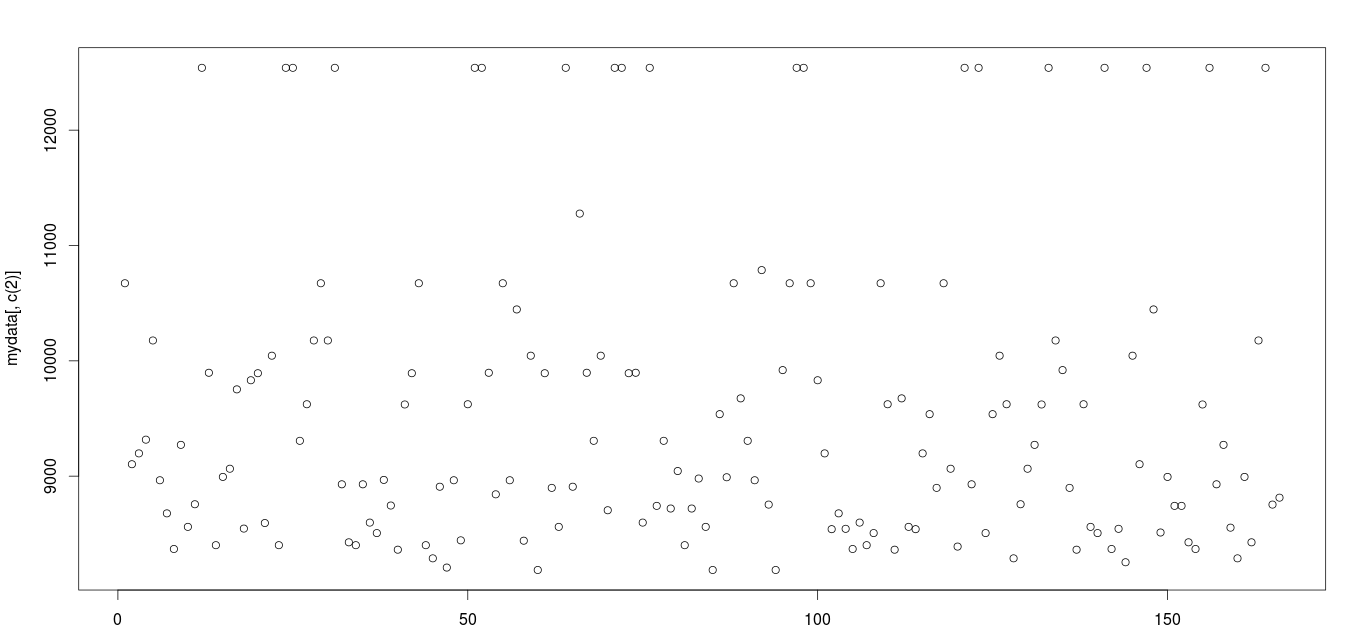
Outlier in avg_sal
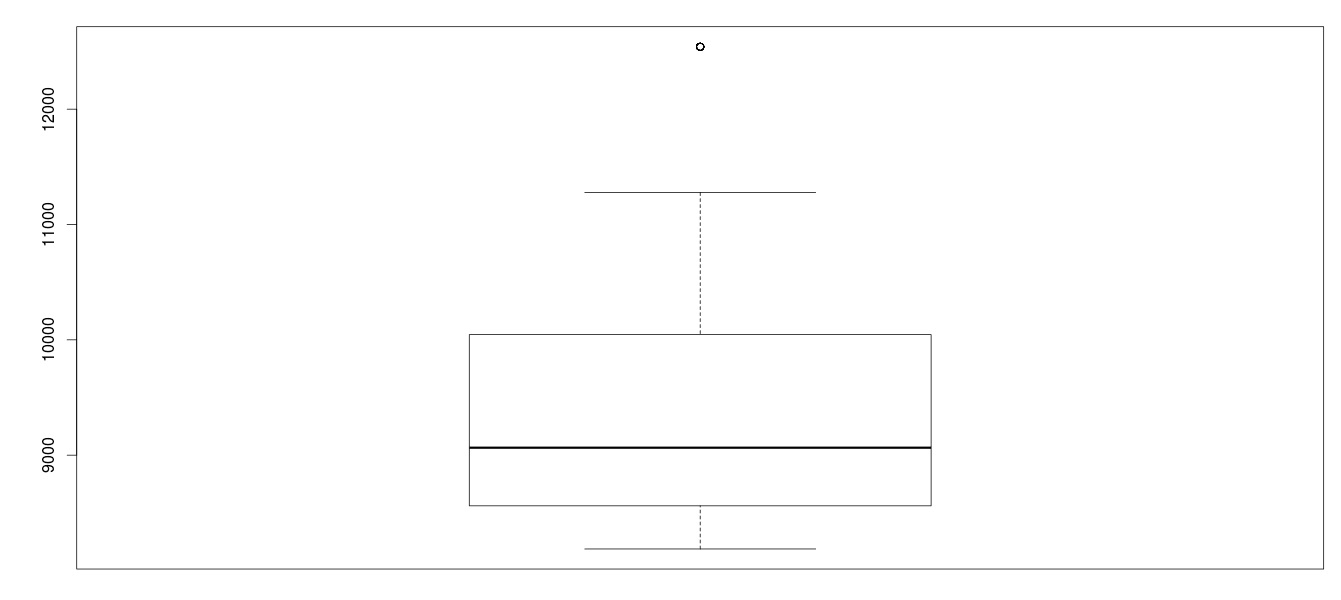
Check the scatterplot of this entry for more clarity.
plot(mydata[,c(2)])
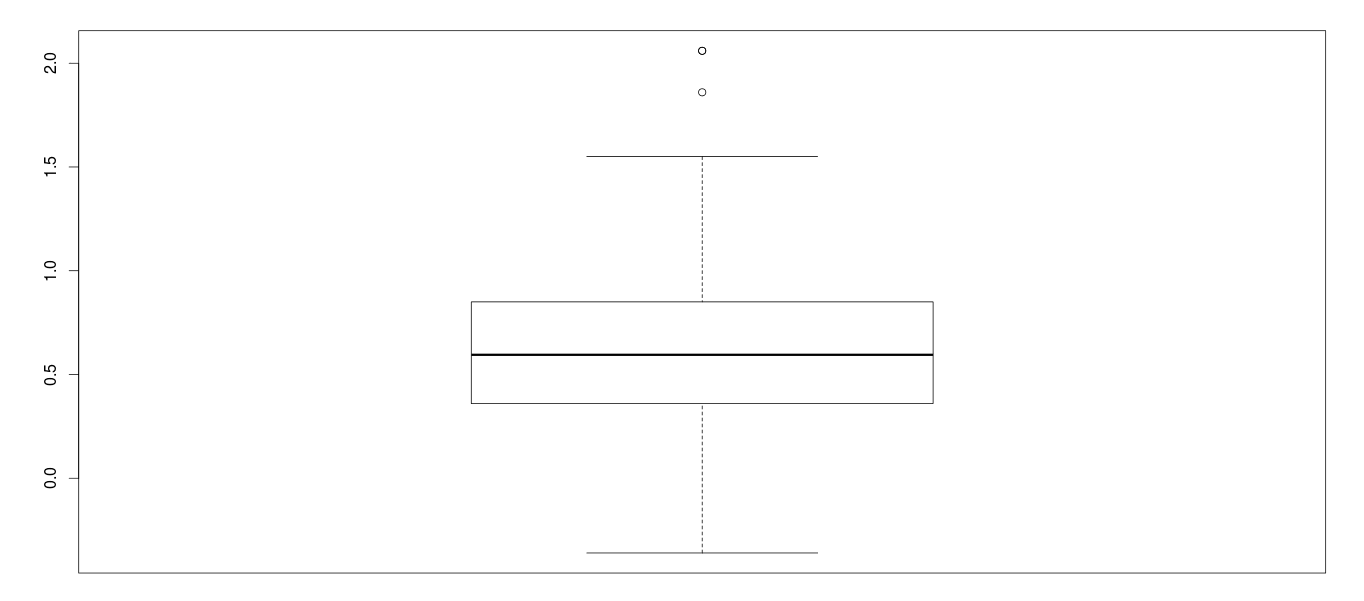
Outlier in Unemp_rate
In this graph, we can see there are few entries which lie as outliers. We have replaced outliers with highest values like ~1.5.
Defining function to replace outliers
library(data.table)
 outlierReplace = function(dataframe, cols, rows, newValue = NA) {
 if (any(rows)) {
 set(dataframe, rows, cols, newValue)
 }
 }
Step 5: Selecting data mining task
Determine variance and store at the first index in wss
wss <- (nrow(mydata)-1)*sum(apply(mydata,2,var))
Step 6: Pick a data mining algorithm
k-means algorithm has been used for this clustering.
## iterate through wss array 15 times and sum up all the variance in every iteration and store it in wss array
for(i in 2:15)wss[i]<- sum(fit=kmeans(mydata,centers=i,15)$withinss)
## plot each iteration to display the elbow graph
plot(1:15,wss,type="b",main="15 clusters",xlab="no. of cluster",ylab="with clsuter sum of squares")
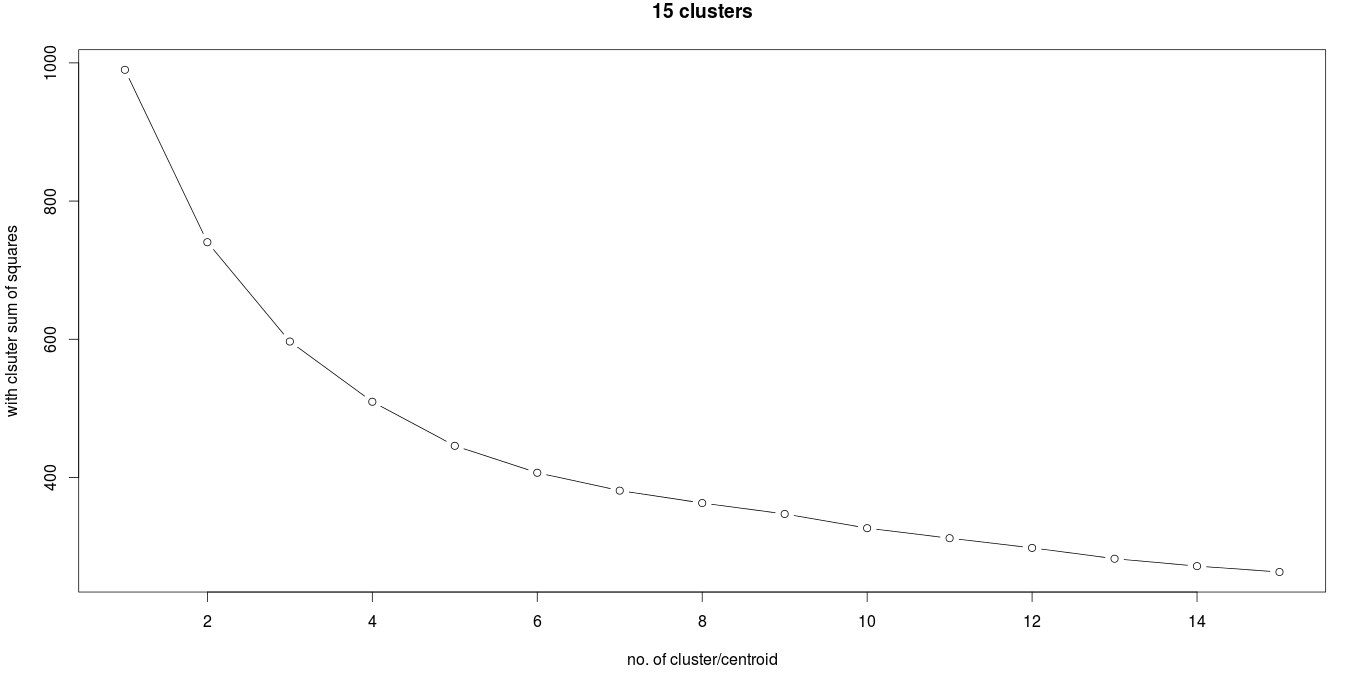
Step 7: Look for patterns of interest in a specific representational form
As major changes are in 3 iterations, we select the optimized number of cluster to be 3:
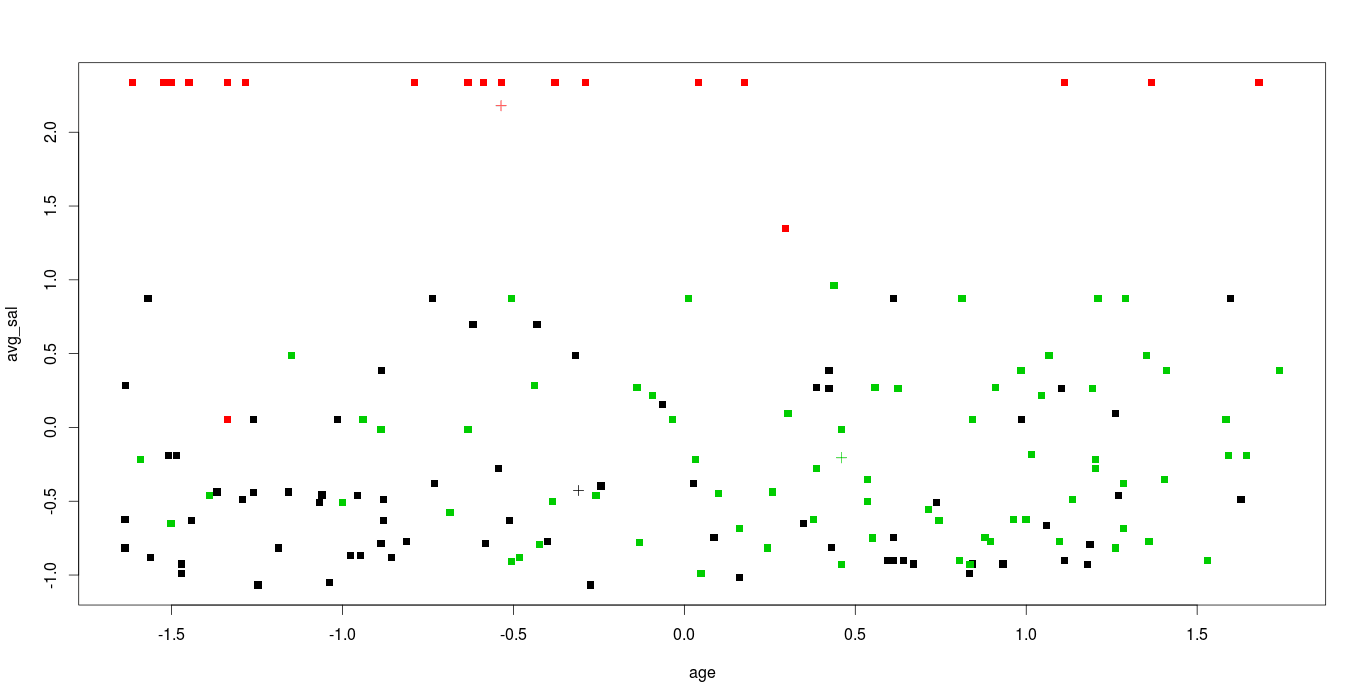
fit <- kmeans(mydata,3)
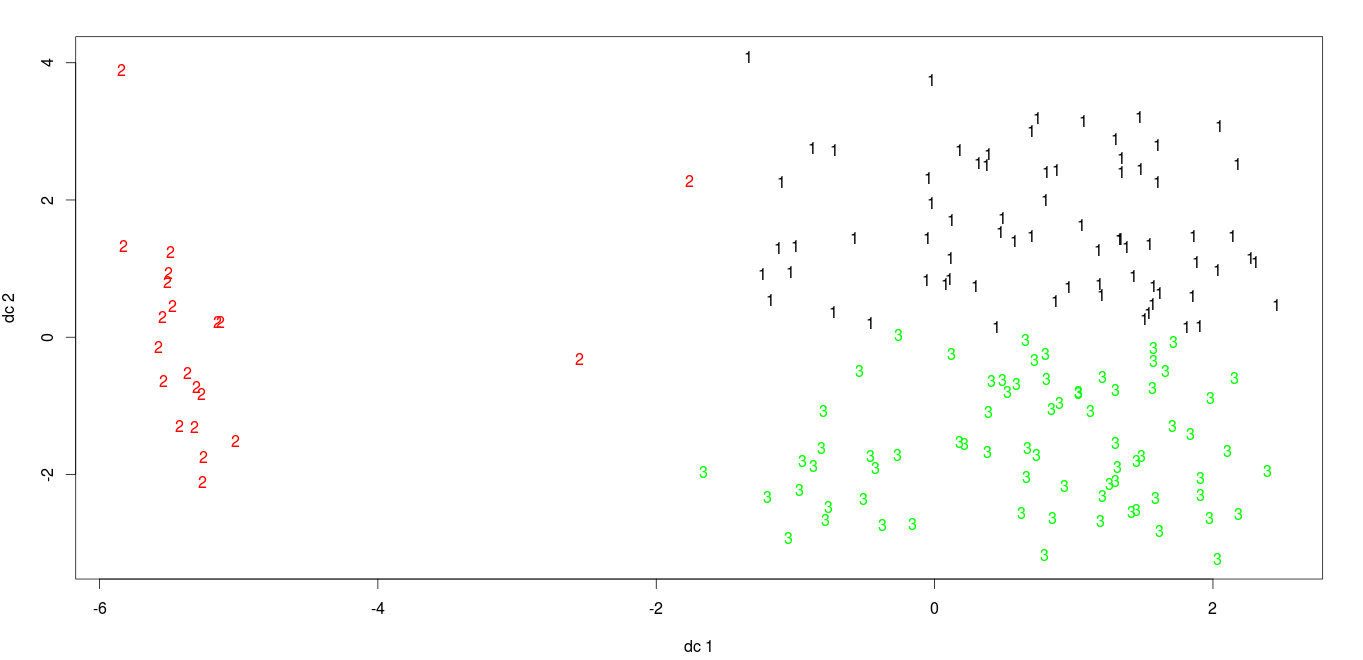
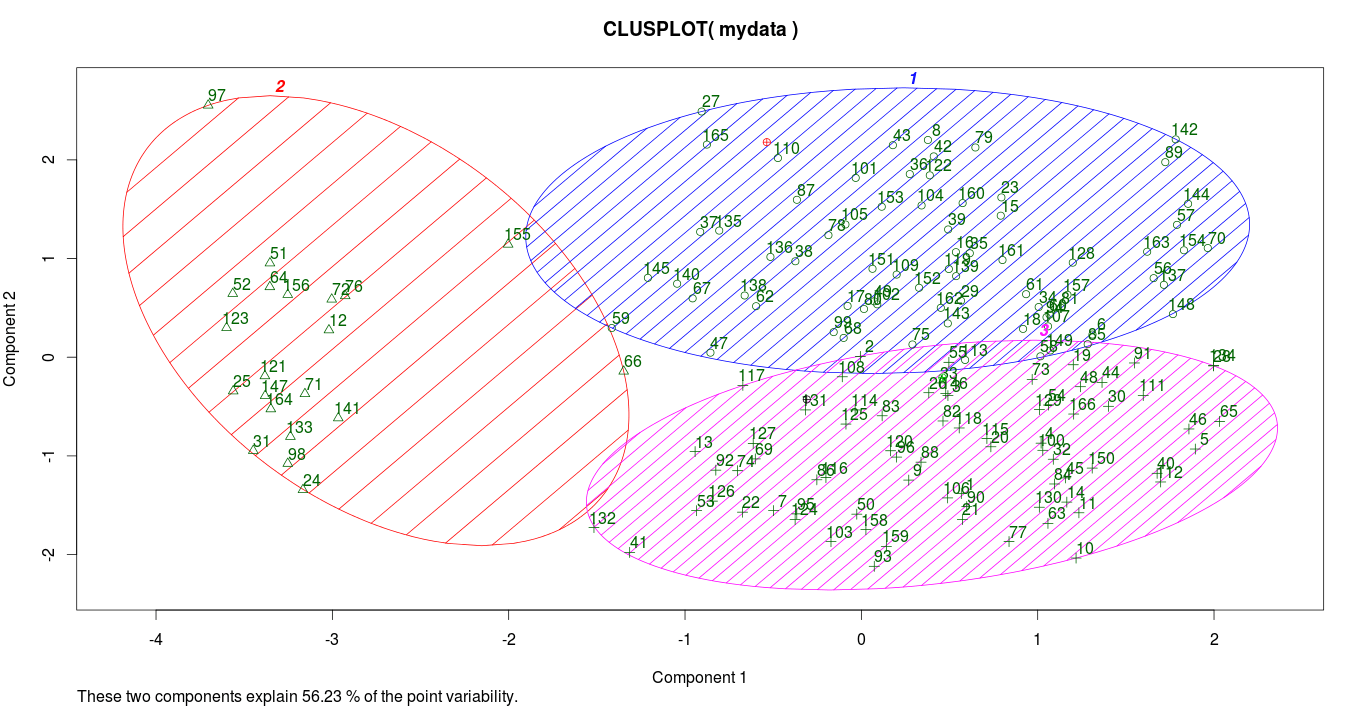
Step 8: Interpretation of mined patterns
plot(mydata,col=fit$cluster,pch=15)
 points(fit$centers,col=1:8,pch=3)
library(cluster)
 library(fpc)
 plotcluster(mydata,fit$cluster)
points(fit$centers,col=1:8,pch=16)
clusplot(mydata, fit$cluster, color=TRUE, shade=TRUE, labels=2, lines=0)
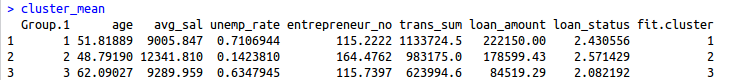
Check mean for each object in each cluster
mydata <- clickpath[,c(3,7:12)]
 mydata <- data.frame(mydata,fit$cluster)
 cluster_mean <- aggregate(mydata[,1:8],by = list(fit$cluster),FUN = mean)
 cluster_mean
K-means clustering is effortlessly easier to implement and is applicable on large datasets. It’s been a roaring success as it is implemented in numerous filed, like computer vision, geostatistics, market segmentation, astronomy and agriculture.
Learn Machine Learning using Python in Pune from DexLab Analytics. Machine learning has transpired to be the hottest job skill to possess by the Millennial. So, don’t lag behind!
This post originally appeared on – www.edureka.co/blog/clustering-on-bank-data-using-r
Interested in a career in Data Analyst?
To learn more about Machine Learning Using Python and Spark – click here.
To learn more about Data Analyst with Advanced excel course – click here.
To learn more about Data Analyst with SAS Course – click here.
To learn more about Data Analyst with R Course – click here.
To learn more about Big Data Course – click here.