The job of a data scientist is one that is challenging, exciting and crucial to an organization’s success. So, it’s no surprise that there is a rush to enroll in a Data Science course, to be eligible for the job. But, while you are at it, you also need to have the awareness regarding the job responsibilities usually bestowed upon the data scientists in a business organization and you would be surprised to learn that the responsibilities of a data scientist differs from that of a data analyst or, a data engineer.
So, what is the role and responsibility of a data scientist? Let’s take a look.
The common idea regarding a data scientist role is that they analyze huge volumes of data in order to find patterns and extract information that would help the organizations to move ahead by developing strategies accordingly. This surface level idea cannot sum up the way a data scientist navigates through the data field. The responsibilities could be broken down into segments and that would help you get the bigger picture.
Data management
The data scientist, post assuming the role, needs to be aware of the goal of the organization in order to proceed. He needs to stay aware of the top trends in the industry to guide his organization, and collect data and also decide which methods are to be used for the purpose. The most crucial part of the job is the developing the knowledge of the problems the business is trying solve and the data available that have relevance and could be used to achieve the goal. He has to collaborate with other departments such as analytics to get the job of extracting information from data.
Data analysis
Another vital responsibility of the data scientist is to assume the analytical role and build models and implement those models to solve issues that are best fit for the purpose. The data scientist has to resort to data mining, text mining techniques. Doing text mining with python course can really put you in an advantageous position when you actually get to handle complex dataset.
Developing strategies
The data scientists need to devote themselves to tasks like data cleaning, applying models, and wade through unstructured datasets to derive actionable insight in order to gauge the customer behavior, market trends. These insights help a business organization to decide its future course of action and also measure a product performance. A Data analyst training institute is the right place to pick up the skills required for performing such nuanced tasks.
Collaborating
Another vital task that a data scientist performs is collaborating with others such as stakeholders and data engineers, data analysts communicating with them in order to share their findings or, discussing certain issues. However, in order to communicate effectively the data scientists need to master the art of data visualization which they could learn while pursuing big data courses in delhi along with deep learning for computer vision course. The key issue here is to make the presentation simple yet effective enough so that people from any background can understand it.
The above mentioned responsibilities of a data scientist just scratch the surface because, a data scientist’s job role cannot be limited by or, defined by a couple of tasks. The data scientist needs to be in synch with the implementation process to understand and analyze further how the data driven insight is shaping strategies and to which effect. Most importantly, they need to evaluate the current data infrastructure of the company and advise regarding future improvement. A data scientist needs to have a keen knowledge of Machine Learning Using Python, to be able to perform the complex tasks their job demands.
While dealing with data distribution, Skewness and Kurtosis are the two vital concepts that you need to be aware of. Today, we will be discussing both the concepts to help your gain new perspective.
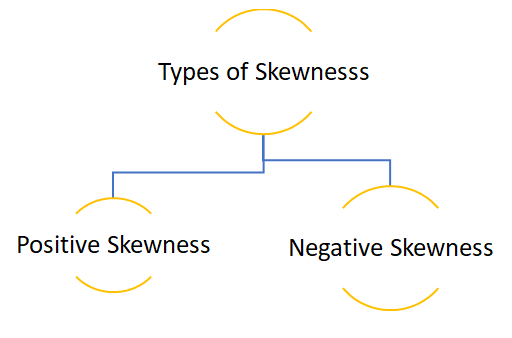
Skewness gives an idea about the shape of the distribution of your data. It helps you identify the side towards which your data is inclined. In such a case, the plot of the distribution is stretched to one side than to the other. This means in case of skewness we can say that the mean, median and mode of your dataset are not equal and does not follow the assumptions of a normally distributed curve.
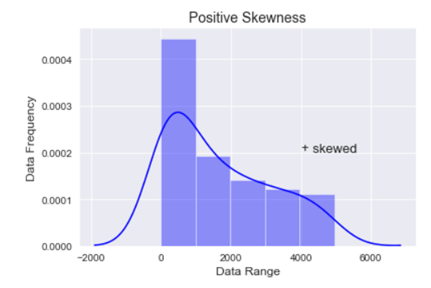
Positive skewness:- When the curve is stretched towards the right side more it is called a positively skewed curve. In this case mean is greater than median and median is the greater mode
(Mean>Median>Mode)
Let’s see how we can plot a positively skewed graph using python programming language.
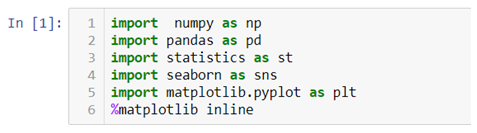
First we will have to import all the necessary libraries.
Then let’s create a data using the following code:-
In the above code we first created an empty list and then created a loop where we are generating a data of 100 observations. The initial value is raised by 0.1 and then each observation is raised by the loop count.
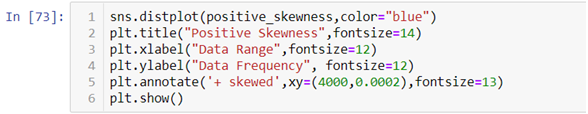
To get a visual representation of the above data we will be using the Seaborn library and to add more attributes to our graph we will use the Matplotlib methods.
In the above graph you can see that the data is stretched towards right, hence the data is positively skewed.
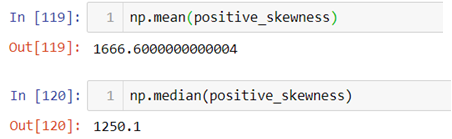
Now let’s cross validate the notion that whether Mean>Median>Mode or not.
Since each observation in the dataset is unique mode cannot be calculated.
Calculation of skewness:
Formula:-
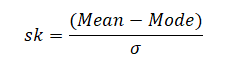
In case we have the value of mode then skewness can be measured by Mode ─ Mean
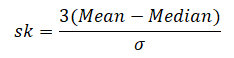
In case mode is ill-defined then skewness can be measured by 3(Mean ─ Median)
To obtain relative measures of skewness, as in dispersion we use the following formula:-
When mode is defined:- When mode is ill-defined:-
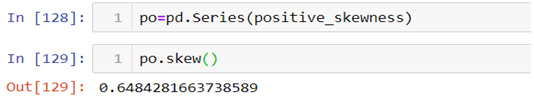
To calculate positive skewness using Python programming language we use the following code:-
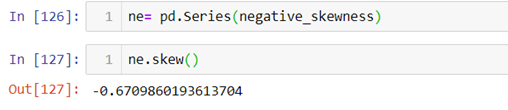
Negative skewness:- When the curve is stretched towards left side more it is called a negatively skewed curve. In this case mean is less than median and median is mode.
(Mean<Median<Mode)
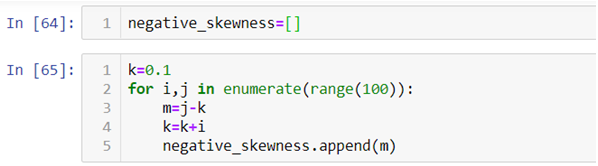
Now let’s see how we can plot a negatively skewed graph using python programming language.
Since we have already imported all the necessary libraries we can head towards generating the data.|
In the above code instead of raising the value of observation we are reducing it.
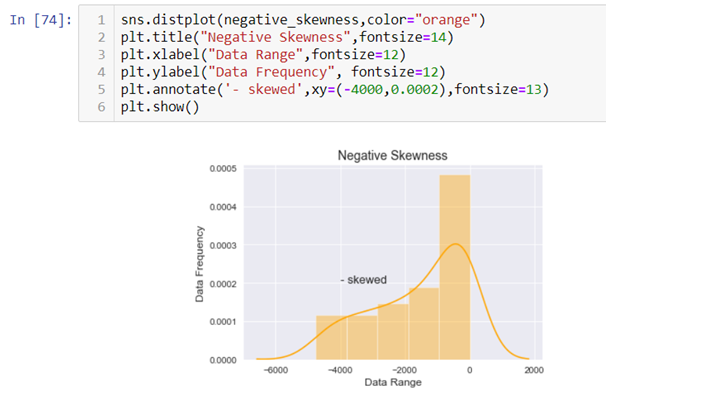
To visualize the data we have created again we will use the Seaborn and Matplotlib library.
The above graph is stretched towards left, hence it is negatively skewed.
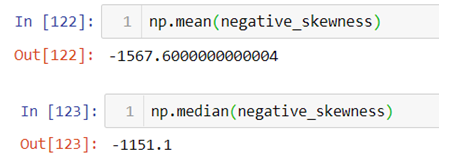
To check whether Mean<Median<Mode or not again we will be using the following code:-
The above result shows that the value of mean is less than mode and since each observation is unique mode cannot be calculated.
Now let’s calculate skewness in Python.
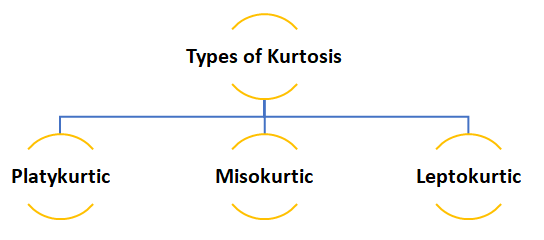
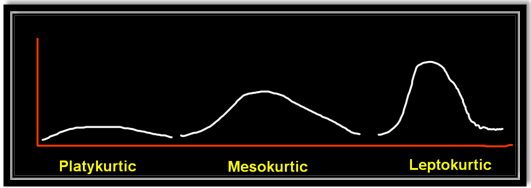
Kurtosis
Kurtosis is nothing but the flatness or the peakness of a distribution curve.
Platykurtic :- This kind of distribution has the smallest or the flattest peak.
Misokurtic:- This kind of distribution has a medium peak.
Leptokurtic:- This kind of distribution has the highest peak.
The video attached below will help you clear any query you might have.
So, this was the discussion on the Skewness and Kurtosis, at the end of this you have definitely become familiar with both concepts. Dexlab Analytics blog has informative posts on diverse topics such as neural network machine learning python which you need to explore to update yourself. Dexlab Analytics offers cutting edge courses like machine learning certification courses in gurgaon.
In this fifth part of the basic of statistical inference series you will learn about different types of Parametric tests. Parametric statistical test basically is concerned with making assumption regarding the population parameters and the distributions the data comes from. In this particular segment the discussion would focus on explaining different kinds of parametric tests. You can find the 4th part of the series here.
INTRODUCTION
Parametric statistics are the most common type of inferential statistics. Inferential statistics are calculated with the purpose of generalizing the findings of a sample to the population it represents, and they can be classified as either parametric or non-parametric. Parametric tests make assumptions about the parameters of a population, whereas nonparametric tests do not include such assumptions or include fewer. For instance, parametric tests assume that the sample has been randomly selected from the population it represents and that the distribution of data in the population has a known underlying distribution. The most common distribution assumption is that the distribution is normal. Other distributions include the binomial distribution (logistic regression) and the Poisson distribution (Poisson regression).
PARAMETRIC TEST
A parameter in statistics refers to an aspect of a population, as opposed to a statistic, which refers to an aspect, about a sample. For example, the population mean is a parameter, while the sample mean is a statistic. A parametric statistical test makes an assumption about the population parameters and the distributions that the data comes from. These types of tests assume to data is from normal distribution.
Data that is assumed to have been drawn from a particular distribution, and that is used in a parametric test.
Parametric equations are used in calculus to deal with the problems that arise when trying to find functions that describe curves. These equations are beyond the scope of this site, but you can find an excellent rundown of how to use these types of equations here.
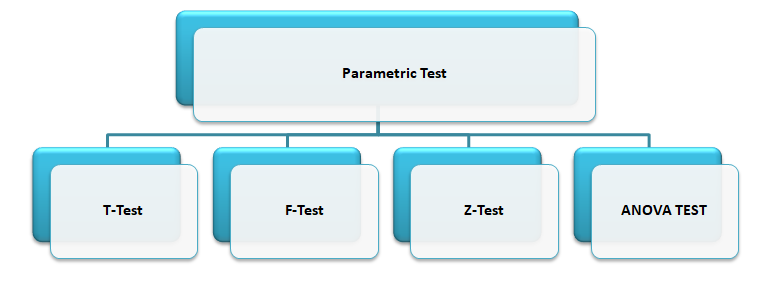
The parametric tests are: Let’s discuss about each test in details.
T-TEST
The T-test is one of, inferential statistics. It is used to determine whether there is a significant difference between the means of two groups or not. When the difference between two population averages is being investigated, a t-test is used. In other words, a t-test is used when we wish to compare two means. Essentially, a t-test allows us to compare the average values of the two data sets and determine if they came from the same population. In the above examples, if we were to take a sample of students from class A and another sample of students from class B, we would not expect them to have exactly the same mean and standard deviation.
Mathematically, the t-test takes a sample from each of the two sets and establishes the problem statement by assuming a null hypothesis that the two means are equal. Based on the applicable formulas, certain values are calculated and compared against the standard values, and the assumed null hypothesis is accepted or rejected accordingly.
If the null hypothesis qualifies to be rejected, it indicates that data readings are strong and are probably not due to chance. The t-test is just one of many tests used for this purpose. Statisticians must additionally use tests other than the t-test to examine more variables and tests with larger sample sizes. For a large sample size, statisticians use a z-test. Other testing options include the chi-square test and the f-test.
T-Test Assumptions
The first assumption made regarding t-tests concerns the scale of measurement. The assumption for a t-test is that the scale of measurement applied to the data collected follows a continuous or ordinal scale, such as the scores for an IQ test.
The second assumption made is that of a simple random sample, that the data is collected from a representative, randomly selected portion of the total population.
The third assumption is the data, when plotted, results in a normal distribution, bell-shaped distribution curve.
The final assumption is the homogeneity of variance. Homogeneous, or equal, variance exists when the standard deviations of samples are approximately equal.
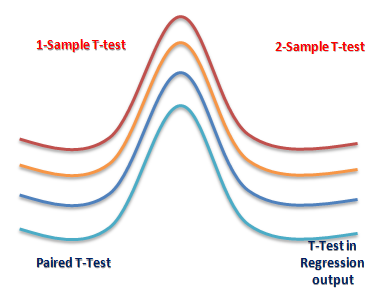
There are three types to T-test: (i) Correlated or paired T-test, (ii) Equal variance(or pooled) T-test (iii) Unequal variance T-test.
Z-TEST
A z-test is a statistical test used to determine whether two population means are different when the variances are known and the sample size is large. The test statistic is assumed to have a normal distribution, and nuisance parameters such as standard deviation should be known in order for an accurate z-test to be performed. A z-statistic, or z-score, is a number representing how many standard deviations above or below the mean population a score derived from a z-test is.
The z-test is also a hypothesis test in which the z-statistic follows a normal distribution. The z-test is best used for greater-than-30 samples because, under the central limit theorem, as the number of samples gets larger, the samples are considered to be approximately normally distributed. When conducting a z-test, the null and alternative hypotheses, alpha and z-score should be stated. Next, the test statistic should be calculated, and the results and conclusion stated. Examples of tests that can be conducted as z-tests include a one-sample location test, a two-sample location test, a paired difference test, and a maximum likelihood estimate. Z-tests are closely related to t-tests, but t-tests are best performed when an experiment has a small sample size. Also, t-tests assume the standard deviation is unknown, while z-tests assume it is known. If the standard deviation of the population is unknown, the assumption of the sample variance equaling the population variance is made.
One Sample Z-test: A one sample z test is one of the most basic types of hypothesis test. In order to run a one sample z test, its work through several steps:
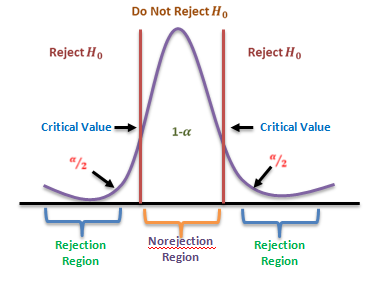
Step 1: Null hypothesis is one of the common stumbling blocks–in order to make sense of your sample and have the one sample z test give you the right information it must make sure written the null hypothesis and alternate hypothesis correctly. For example, you might be asked to test the hypothesis that the mean weight gain of an women was more than 30 pounds. Your null hypothesis would be: H0 : μ = 30 and your alternate hypothesis would be H, sub>1: μ > 30.
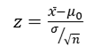
Step 2: Use the z-formula to find a z-score
All you do is put in the values you are given into the formula. Your question should give you the sample mean (x̄), the standard deviation (σ), and the number of items in the sample (n). Your hypothesized mean (in other words, the mean you are testing the hypothesis for, or your null hypothesis) is μ0 .
Two Sample Z Test: The z-Test: Two- Sample for Means tool runs a two sample z-Test means with known variances to test the null hypothesis that there is no difference between the means of two independent populations. This tool can be used to run a one-sided or two-sided test z-test.
ANOVA
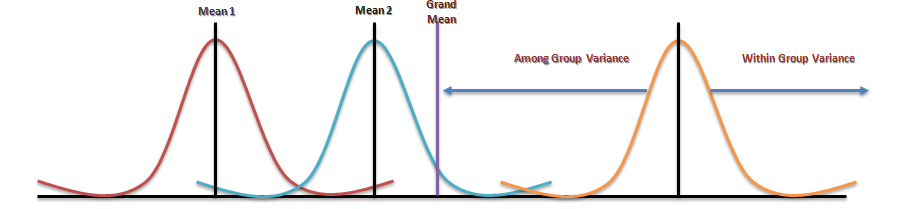
Analysis of variance (ANOVA) is an analysis tool used in statistics that splits an observed aggregate variability found inside a data set into two parts: systematic factors and random factors. The systematic factors have a statistical influence on the given data set, while the random factors do not. Analysts use the ANOVA test to determine the influence that independent variables have on the dependent variable in a regression study. The ANOVA test is the initial step in analysing factors that affect a given data set. Once the test is finished, an analyst performs additional testing on the methodical factors that measurably contribute to the data set’s inconsistency. The analyst utilizes the ANOVA test results in an f-test to generate additional data that aligns with the proposed regression models. The ANOVA test allows a comparison of more than two groups at the same time to determine whether a relationship exists between them. The result of the ANOVA formula, the F statistic (also called the F-ratio), allows for the analysis of multiple groups of data to determine the variability between samples and within samples.
If no real difference exists between the tested groups, which is called the null hypothesis, the result of the ANOVA’s F-ratio statistic will be close to 1. Fluctuations in its sampling will likely follow the Fisher F distribution. This is actually a group of distribution functions, with two characteristic numbers, called the numerator degrees of freedom and the denominator degrees of freedom.
One-way Anova: A one-way ANOVA uses one independent variable, use a one-way ANOVA when collected data about one categorical independent variable and one quantitative dependent variable. The independent variable should have at least three levels (i.e. at least three different groups or categories). ANOVA that if the dependent variable changes according to the level of the independent variable.
Two-way Anova: A two-way ANOVA is used to estimate how the mean of a quantitative variable changes according to the levels of two categorical variables. Use a two-way ANOVA when you want to know how two independent variables, in combination, affect a dependent variable.
F-TEST
An “F Test” is a catch-all term for any test that uses the F-distribution. In most cases, when people talk about the F-Test, what they are actually talking about is The F-Test to compare two variances. However, the f-statistic is used in a variety of tests including regression analysis, the Chow test and the Scheffe Test (a post-hoc ANOVA test).
F Test to Compare Two Variances
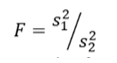
A Statistical F Test uses an F Statistic to compare two variances, s1 and s2 , by dividing them. The result is always a positive number (because variances are always positive). The equation for comparing two variances with the f-test is:
If the variances are equal, the ratio of the variances will equal 1. For example, if you had two data sets with a sample 1 (variance of 10) and a sample 2 (variance of 10), the ratio would be 10/10 = 1.
You always test that the population variances are equal when running an F Test. In other words, you always assume that the variances are equal to 1. Therefore, your null hypothesis will always be that the variances are equal. Assumptions
Several assumptions are made for the test. Your population must be approximately normally distributed (i.e. fit the shape of a bell curve) in order to use the test. Plus, the samples must be independent events. In addition, you’ll want to bear in mind a few important points:
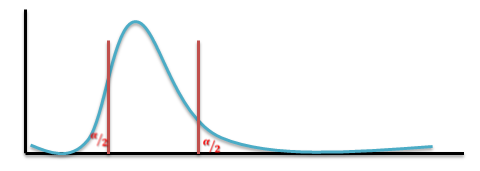
The larger variance should always go in the numerator (the top number) to force the test into a right-tailed test. Right-tailed tests are easier to calculate.
For two-tailed tests, divide alpha by 2 before finding the right critical value.
If you are given standard deviations, they must be squared to get the variances.
If your degrees of freedom aren’t listed in the F Table, use the larger critical value. This helps to avoid the possibility of Type I errors.
CONCLUSION
Conventional statistical procedures may also call parametric tests. In every parametric test, for example, you have to use statistics to estimate the parameter of the population. Because of such estimation, you have to follow a process that includes a sample as well as a sampling distribution and a population along with certain parametric assumptions that required, which makes sure that all components compatible with one another.
An example can use to explain this. Observations are first of all quite independent, the sample data doesn’t have any normal distributions and the scores in the different groups have some homogeneous variances. Parametric tests are based on the distribution, parametric statistical tests are only applicable to the variables. There’re no parametric tests that exist for the nominal scale date, and finally, they are quite powerful when they exist. There are mainly four types of Parametric Hypothesis Test which already mentioned in previous slides.
Advantages of Parametric Test
One of the biggest and best advantages of using parametric tests is first of all that you don’t need much data that could be converted in some order or format of ranks. The process of conversion is something that appears in rank format and to be able to use a parametric test regularly, you will end up with a severe loss in precision. Another big advantage of using parametric tests is the fact that you can calculate everything so easily. In short, you will be able to find software much quicker so that you can calculate them fast and quick. Apart from parametric tests, there are other non-parametric tests, where the distributors are quite different and they are not all that easy when it comes to testing such questions that focus related to the means and shapes of such distributions.
Disadvantages of Parametric Test
Parametric tests are not valid when it comes to small data sets. The requirement that the populations are not still valid on the small sets of data, the requirement that the populations which are under study have the same kind of variance and the need for such variables are being tested and have been measured at the same scale of intervals. Another disadvantage of parametric tests is that the size of the sample is always very big, something you will not find among non-parametric tests. That makes it a little difficult to carry out the whole test.
This particular discussion on parametric tests ends here, and at the end of this you must have developed clear ideas regarding these test categories. To find more such posts on Data Science training topics follow the Dexlab Analytics blog.
Market researchers usually have a hard time preparing and conducting surveys to gather valuable data on customers as well as competitors and sorting that data to offer actionable Intel to marketing heads to enable them to devise marketing strategies accordingly.
So, basically their job centers around data, data, and more data, it is solely reason enough for them to consider ditching their jaded and often erroneous data collecting system and step into the domain of AI by pursuing customer market analysis courses.
How Market Researchers View AI
Despite recognizing and appreciating the manifold advantages of AI, some uneasiness lingers in most industries regarding its applications and full integration.
However, market researchers were thankfully, quick to recognize the pros the AI package has to offer. The implementation of AI would take most of the hassle way from their job. Surveys conducted over the past couple of years show that almost 80% of market researchers are in favor of AI and they believe that it will be the harbinger of new opportunities.
How AI Can Address the Woes of Market Researchers?
Any conversation with a seasoned market researcher would reveal the issues that continuously bug them. A huge amount of time and money that go into the process along with the enormity of data they have to process, can lead to frustration.
With rampant consumerism becoming a reality of modern society, the market researchers would need to deal with an even bigger amount of data.
Some agencies have already started migrating to AI solutions to address these concerns and they are seeing the difference already. Machine Learning Using Python is becoming a trend which they are veering towards.
Although companies are still holding back from fully integrating AI into their operations, in near future the scenario might change considering the benefits AI can offer
Shortening data processing time: Usually, it takes months to complete projects, but, with AI-powered tools, the duration of the projects can be shortened. Data processing and producing insight based upon data findings can be almost instantaneous.
It would enable the marketing heads to tackle issues faster than ever before, thus gaining an edge over the competition. Report generation would take less time and the team can be employed to handle some other productive tasks.
Higher efficiency in data handling: Any organization has to deal with a huge amount of data, as every year new data gets added to their database. However, when it comes to market research, mostly experience data is put to use while operational data which is mainly old data is shifted to the backburner. AI integration can solve this issue by combining both data sets, and combing through this massive data to produce insights and find new patterns in customer behavior which was earlier missed by your team.
Improve survey quality:
Implementation of AI can take the errors out of the present survey system and make it more efficient. Using ML and NLP, survey questions can be shaped in a conversational style which would immediately put the respondents in a comfort zone thereby improving the chance of eliciting an accurate response. AI-powered tools can also put together a list of respondents who are apt for the survey and eliminating random ones out of the list.
Customize marketing strategy: As AI gets integrated into your market research process, it starts analyzing customer behavior by going through the bounce rate, as well as login data. As a result, it points out those customer, marketing teams need to work on. They get a chance to customize a marketing strategy for them.
There is no denying the fact that AI can transform the way market researchers work. Integration and adoption of AI would certainly take time but, eventually, the merger would happen. Since AI is a highly specialized domain, the market research teams need to upgrade themselves. Enrolling in a premier artificial intelligence certification in delhi ncr, would help them be prepared for a smarter future.
Do you aspire to be a data scientist? Then is it essential that you have a solid understanding of the core concepts of statistics. Everyone doesn’t have a Ph.D. in Statistics. And that isn’t the only way to excel in the field of data science. But yes, knowing stats well is a prerequisite for data science.
Nowadays, popularly used libraries, like Tesorflow, liberate the user from the intricacies of complex mathematics. Still, it is advisable to be familiar with the fundamental principles on which they work, because that will enable you to use the libraries better.
In this blog, we attempt to shed light on some basic concepts, theorems and equations of statistics for data science.
Statistical Distributions:
Statistical distributions are important tools that you must arm yourself with to be a skilled data scientist. Here, we shall talk about two important distributions, namely Poisson distribution and Binomial distribution.
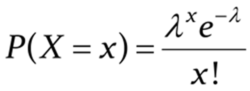
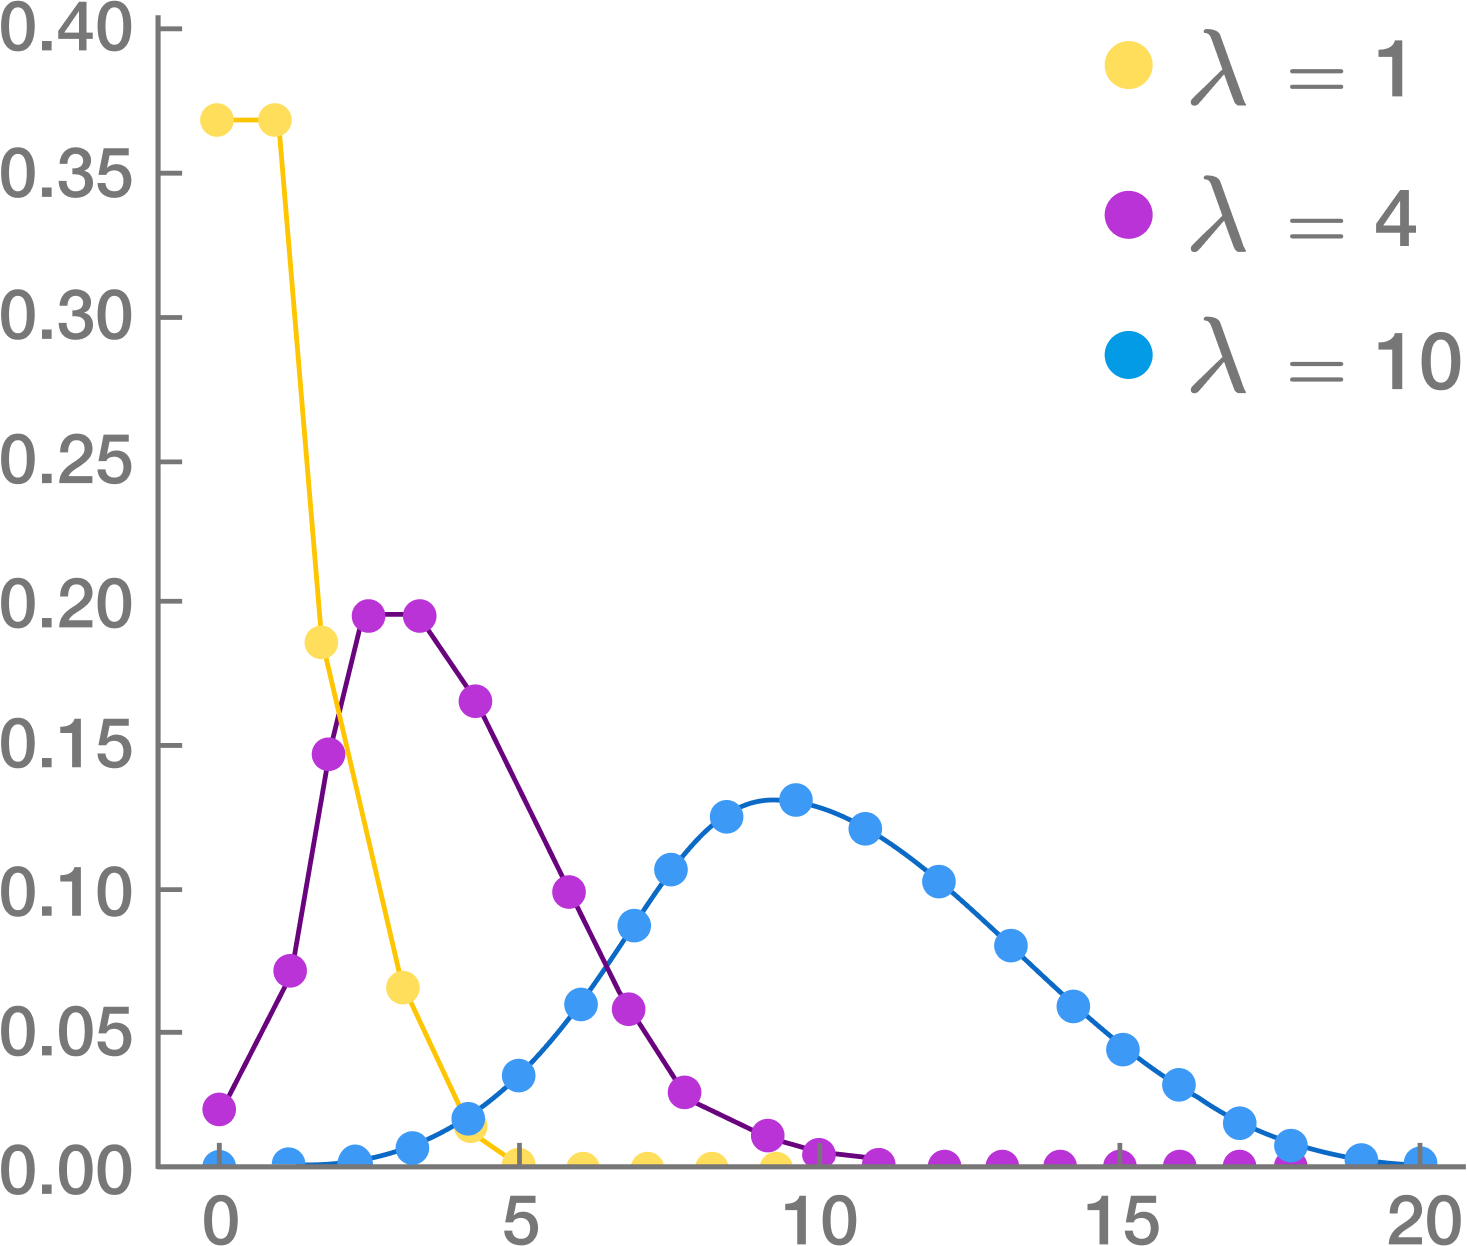
Poisson distribution: This distribution is used to find out the number of events that are expected to occur during an interval of time. For example, the number of page views in one second, the number of phone calls in a particular period of time, number of sales per hour, etc.
The symbols used in the equation are:
x: exact number of successes
e: constant equal to 2.71828 approximately
λ: average number of successes per time interval
Poisson distribution is used for calculating losses in manufacturing. Let us consider that a machine generates metal sheets that have ‘x’ flaws per yard. Suppose the error rate is 2 per yard of sheet (λ). Applying this information to Poisson distribution, we can calculate the probability of having exactly two errors in a yard.
Source: Brilliant.org
Poisson distribution is used for faster detection of anomalies.
Binomial distribution:
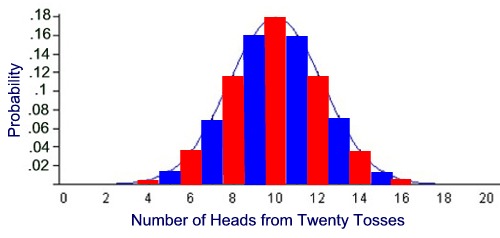
This is a very common distribution in Statistics. Suppose you have flipped a coin thrice. Using basic combinatorics for flipping a coin thrice, we see that there are eight combinations possible. We find out the probabilities of getting 0, 1, 2 or 3 heads and plot this on a graph. This gives us the binomial distribution for this particular problem. It must be remembered that Binomial distribution curve is similar to a Normal distribution Curve. Normal distribution is used when values are continuous and Binomial distribution is used for discrete values.
Source: mathnstuff.com
Binomial distribution is a discrete probability distribution where number of trials is predetermined and there are two possible outcomes– success and failure, win or lose, gain or loss. Depending on a few conditions, like the total number of trails is large, the probability of success is near 1 and the probability of failure is near 0, the trails are independent and identical, etc., the binomial distribution is approximated to a normal distribution.
Source: MathBitsNotebook
Binomial distribution has many applications in business. For example, it is estimated that 5% of tax returns for individuals with high net worth in USA is fraudulent. These frauds might be uncovered through audits. Binomial distribution is used to find out for ‘n’ number of tax returns that are audited, what is the probability for say 5 fraudulent returns to be uncovered.
There are some more probability distributions, like Bernoulli and Geometric distributions. We shall cover that and more in the following blogs. So, stay tuned and follow DexLab Analytics. The experts here offer top-quality data science courses in Delhi. Go through the data science certification details right now!
To learn more about Data Analyst with Advanced excel course – Enrol Now. To learn more about Data Analyst with R Course – Enrol Now. To learn more about Big Data Course – Enrol Now.
To learn more about Machine Learning Using Python and Spark – Enrol Now. To learn more about Data Analyst with SAS Course – Enrol Now. To learn more about Data Analyst with Apache Spark Course – Enrol Now. To learn more about Data Analyst with Market Risk Analytics and Modelling Course – Enrol Now.
New data objects, like data planes, data streaming and data fabrics are gaining importance these days. However, let’s not forget the shiny data object from a few years back-Hadoop data lake architecture. Real-life Hadoop data lakes are the foundation around which many companies aim to develop better predictive analytics and sometimes even artificial intelligence.
This was the crux of discussions that took place in Hortonworks’ DataWorks Summit 2018. Here, bigwigs like Sudhir Menon shared the story behind every company wanting to use their data stores to enable digital transformation, as is the case in tech startups, like Airbnb and Uber.
In the story shared by Menon, vice president of enterprise information management at hotelier Hilton Worldwide, Hadoop data lake architecture plays a key role. He said that all the information available in different formats across different channels is being integrated into the data lake.
The Hadoop data lake architecture forms the core of a would-be consumer application that enables Hilton Honors program guests to check into their rooms directly.
A time-taking procedure:
Menon stated that the Hadoop data lake project, which began around two years back, is progressing rapidly and will start functioning soon. However, it is a ‘’multiyear project’’. The project aims to buildout the Hadoop-based Hotonworks Data Platform (HDP) into a fresh warehouse for enterprise data in a step-by-step manner.
The system makes use of a number of advanced tools, including WSO2 API management, Talend integration and Amazon Redshift cloud data warehouse software. It also employs microservices architecture to transform an assortment of ingested data into JSON events. These transformations are the primary steps in the process of refining the data. The experience of data lake users shows that the data needs to be organized immediately so that business analysts can work with the data on BI tools.
This project also provides a platform for smarter data reporting on the daily. Hilton has replaced 380 dashboards with 40 compact dashboards.
For companies like Hilton that have years of legacy data, shifting to Hadoop data lake architectures can take a good deal of effort.
Another data lake project is in progress at United Airlines, a Chicago-based airline. Their senior manager for big data analytics, Joe Olson spoke about the move to adopt a fresh big data analytics environment that incorporates data lake and a ‘’curated layer of data.’’ Then again, he also pointed out that the process of handling large data needs to be more efficient. A lot of work is required to connect Teradata data analytics warehouse with Hortonworks’ platform.
Difference in file sizes in Hadoop data lakes and single-client implementations may lead to problems related to garbage collection and can hamper the performance.
Despite these implementation problems, the Hadoop platform has fueled various advances in analytics. This has been brought about by the evolution of Verizon Wireless that can now handle bigger and diverse data sets.
In fact, companies now want the data lake platforms to encompass more than Hadoop. The future systems will be ‘’hybrids of on-premises and public cloud systems and, eventually, will be on multiple clouds,’’ said Doug Henschen, an analyst at Constellation Research.
Large companies are very much dependent on Hadoop for efficiently managing their data. Understandably, the job prospects in this field are also multiplying.
Are you a big data aspirant? Then you must enroll for big data Hadoop training in Gurgaon. At Dexlab industry-experts guide you through theoretical as well as practical knowledge on the subject. To help your endeavors, we have started a new admission drive #BigDataIngestion. All students get a flat discount on big data Hadoop certificationcourses. To know more, visit our website.
To learn more about Data Analyst with Advanced excel course – Enrol Now. To learn more about Data Analyst with R Course – Enrol Now. To learn more about Big Data Course – Enrol Now.
To learn more about Machine Learning Using Python and Spark – Enrol Now. To learn more about Data Analyst with SAS Course – Enrol Now. To learn more about Data Analyst with Apache Spark Course – Enrol Now. To learn more about Data Analyst with Market Risk Analytics and Modelling Course – Enrol Now.
Data is the buzzword. It is conquering the world, but who conquers data: the companies that use them or the servers in which they are stored?
Let’s usher you into the fascinating world of data, and data governance. FYI: the latter is weaving magic around the Business Intelligence community, but to optimize the results to the fullest, it needs to depend heavily on a single factor, i.e. efficient data management. For that, highly-skilled data analysts are called for – to excel on business analytics, opt for Business Analytics Online Certification by DexLab Analytics. It will feed you in the latest trends and meaningful insights surrounding the daunting domain of data analytics.
A few years ago, Silicon Valley in San Francisco came under the influence of a new, mysterious thing known as Bitcoin. It swept away the tech enthusiasts off their feet. There were a wide set of rumors that Bitcoin was virtual money, invented by a pseudonymous math stalwart named Satoshi Nakamoto, who would later stir up the structure of modern finance and render government-powered currency antiquated.
To understand the phenomenon better, I once bought a single Bitcoin long time back, which then involved a strenuous labor-intensive process, where I had to go to CVS and use MoneyGram to wire dollar value of a Bitcoin to a crypto-currency exchange. After a month or so, I decided to sell it off for a slight loss, thoroughly convinced that this virtual money is nothing but just a passing fad.
R functions are used to produce chart templates to keep the look and feel of the reports intact.
In this post you will come across how to create chart templates with R functions – all the R users should be accustomed to the calling functions so as to perform calculations and outline plots accurately. Remember what colors and fonts to use each time: R functions are used as a short-cut for producing customary-looking charts.