tableau course details Archives - Page 2 of 4 - DexLab Analytics | Big Data Hadoop SAS R Analytics Predictive Modeling & Excel VBA

Top 3 Tableau Apps to Make the Most Out of Business Intelligence Software

Top 3 Tableau Apps to Make the Most Out of Business Intelligence Software

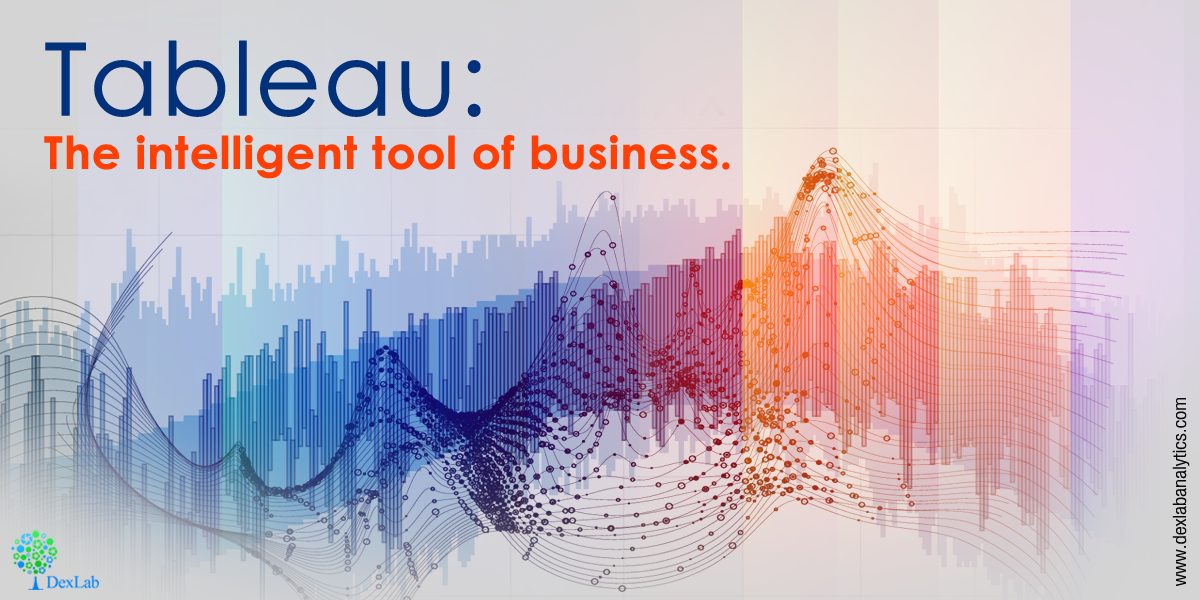
Dashboard visualization is big data’s next in-trend topic. Well-presented information boosts our processing capabilities. Programs like Tableau aim to do exactly that. Tableau uses state-of – art and highly functional graphics to transform big data into something pleasant to look at. More importantly, it has the profound ability to source data from cloud as well as hard drive units of various shapes and sizes, while simultaneously cross-paneling the information into meaningful graphs, charts and tables. This in turn have a remarkable impact on the overall speed to market time through the conversion of input information into interactive, actionable choices. As a result it speeds up the process of realizing the business decisions.

Today, there exists an intense competition between enterprise editions of Tableau. Many of these upon realizing the market value of the incredible visuals which are unique to Tableau have chosen build on it. This has been achieved through the addition of some useful functions and features. Following are the top 3 apps among these enterprise editions of Tableau.

  1. Alteryx

Alteryx fuels Tableau visualizations with an advanced level of data blending, transposing and analysis. As a result it is more efficient in presenting the data. It makes use of automated progresses thereby reducing the need to perform manual actions. Alteryx has been impressive in its exploration of spatial, predictive and statistical analysis, ease of transposability using drag/drop facility, and also because coding is not a requirement. It is capable of handling big data or cloud data in sequence with local or hard drive data. Collaborative information becomes scalable and more manageable.

  1. BI Connector

BI Connector is a self-serving data performer which seamlessly bridges the functions of Tableau and OBIEE without demanding the knowledge of an IT expert. Strong security protocol from OBIEE is utilized to safeguard data while it’s being exported, such as publishing worksheets with the drag/drop facility. The dashboard interface makes collaborating data more flexible. Also, the fluidity of its navigation is user-friendly and practical. Services on a server and desktop are equally powerful.

  1. Dataiku

Dataiku boosts the ability of its users to ‘think’ data. Its performance and credibility are honed through additional visual interfaces. In particular, Dataiku DSS lays emphasis on a capability pertaining to trending and predictive data. The users can even chose to share out code snippets or create their own model. This program exclusively caters to big data infrastructures. Dataiku permits users to quickly comprehend complex feature interactions and analyze coefficients. The best part about all these processes is their navigation which uses a rather visually-pleasing interface.

Hence Tableau enables users to interrelate with data and then proceed with its visualization which includes the creation of interactive and sharable dashboards. It enables the world’s largest organizations unleash the power of their most valuable asset- data. To know more about Data Visualization take a look at the Tableau BI Certification course conducted by DexLab Analytics-a premier institute offering professional courses on data science.

References:

https://www.biconnector.com/blog/3-apps-to-get-the-most-out-of-tableau/

http://www.dashboardinsight.com/articles/digital-dashboards/fundamentals/what-is-a-dashboard.aspx


Interested in a career in Data Analyst?

To learn more about Machine Learning Using Python and Spark – click here.

To learn more about Data Analyst with Advanced excel course – click here.
To learn more about Data Analyst with SAS Course – click here.
To learn more about Data Analyst with R Course – click here.
To learn more about Big Data Course – click here.

It’s Time to Upgrade Tableau with Hyper

On 10th January, 2018 Tableau 10.5 was launched!

 
It’s Time to Upgrade Tableau with Hyper
 

Once you upgrade yourself to Tableau’s latest version, you will automatically get access to Hyper, Tableau’s new, licensed data engine technology. Hyper harbors the cutting edge technology to deliver up to 3x enhanced extract creation speed and up to 5x improved query performance.

Continue reading “It’s Time to Upgrade Tableau with Hyper”

5 Sure-fire Ways to Develop a Powerful Customized Web Analytics Dashboard in Tableau [VIDEO]

Let’s kickstart creating a custom web analytics dashboard!

 
5 Sure-fire Ways to Develop a Powerful Customized Web Analytics Dashboard in Tableau [VIDEO]
 

This blogpost consists of all the resources you will need to build your own web analytics dashboard – some of the resources we have used ourselves and some we have culled down from the web.

Continue reading “5 Sure-fire Ways to Develop a Powerful Customized Web Analytics Dashboard in Tableau [VIDEO]”

5 Quick-Fire Tips and Tricks from Dashboard Specialists

No two dashboards are similar. They cater to different audiences, serves distinct purposes, and address individual problems as unique as you.


5 Quick-Fire Tips and Tricks from Dashboard Specialists


In this blog post, we will talk about the 5 best practices to apply right now to create attractive dashboards, and engage users effectively.

Continue reading “5 Quick-Fire Tips and Tricks from Dashboard Specialists”

Text Adventure – Using Control Flow In Python

Python wascreated by Guido van Rossum and first released in 1991.Python, as a programming platform, has gained a huge popularity within a short span of time because of its flexibility and the user-friendly interface. The software can be deployed easily for developing statistical models and machine learning algorithms

 
Text Adventure- Using Control Flow In Python
 

In fact, due to the advent of AI and ML, Python has a language has had a certain kind of rebirth as far as industrial use is concerned. Today, however, the focus is going to be on a particular section of the language, namely the control flow to create a basic system in Python.

Continue reading “Text Adventure – Using Control Flow In Python”

Tableau: The intelligent tool of business

Tableau: The intelligent tool of business.
 

Tableau plays a very crucial role in data intelligence, data representations, data visualizations, and data modelling. The time has gone when folks used to draw graph, charts, on excel and variant types of resources or tool. Because provide us live data source accessibility with number of data sources like – spark, Google Products, Social network, programming language (R,Python,JAVA) whereas tableau uses VIZQL in background to speed up the performance. So now the time is to move towards Business Intelligence.As of now, you don’t need to worry about either data or data sources.

Continue reading “Tableau: The intelligent tool of business”

5 Ways to Enhance Value of Your Dashboards Using Maps

Today, an effective dashboard is mostly insight-driven. And since a good lot of analysis projects stand upon spatial data, playing with maps is an indispensable skill you need to have in your visualization toolbox.  

 
5 Ways to Enhance Value of Your Dashboards Using Maps
 

Here, we will like to share a few handy tips to improve the analytic and aesthetic value of maps in your dashboard:

Continue reading “5 Ways to Enhance Value of Your Dashboards Using Maps”

What to Do and What Not to Do With Data Visualization

What to Do and What Not to Do With Data Visualization

Data Visualization can be your bow and arrow provided you know the exact way to use it.

In modern day scenario, data visualization has become the crux of efforts – raw data in various forms and statistics tends to be incredibly powerful, but only if you decide to work with them as a whole. After all, it’s not just the numbers but the story behind those numerical figures that reveals something. So, you require data visualization to brush up these notions and turn them into something more compelling to target audience. Data Visualization makes your messages more attractive, lively and enhances the impact, along with keeping your audience hooked.

Continue reading “What to Do and What Not to Do With Data Visualization”

Wanna Talk to a Database? Tableau Acquires ClearGraph

Wanna-Talk-to-a-Database
 

For 14 years, Tableau has solely focused on helping people understand their data better. To take this mission a notch higher, this August, Tableau announced they have acquired ClearGraph, a robust Palo Alto startup that facilitates smart data discovery and data analysis through Natural Language Processing (NLP). They have decided to work with ClearGraph team to incorporate its cutting edge technology into their own products to make data interaction easier via natural language, query technology. Continue reading “Wanna Talk to a Database? Tableau Acquires ClearGraph”

Call us to know more