tableau course details Archives - DexLab Analytics | Big Data Hadoop SAS R Analytics Predictive Modeling & Excel VBA

Why Tableau Is the Best Data Visualization Tool for Industries Worldwide?

Why Tableau Is the Best Data Visualization Tool for Industries Worldwide?

There are several data visualization tools available in the market but Tableau is the most popular and effective. Most of the key players from the BI industry depend on this software for transforming raw data into an easy-to-understand format.

What Makes Tableau So Popular?

Tableau is frequently used as a tool that helps to analyze data quickly and creates visualizations for worksheets and dashboards. It lets users design dashboards that generate actionable insights and takes businesses to new heights. Below, we’ve rounded up top 4 reasons why businesses rely on Tableau:

Amazing Visualizations

Tableau allows you to work with more unordered data and develop stunning visualization: courtesy an array of in-built features. You can also achieve superb context, different ways of drilling meaningful data and understand data in minutes.

Data Science Machine Learning Certification

Detailed Insights

The best thing about this visualization tool is that it lets you analyze future data; you can do that while observing data from several angles and approaches. Plus, you can frame hypothetical queries and work on that data correspondingly – possible only because of the feature of adding elements for comparison and analysis and ‘what-if’ visualizations!

Simple Approach

Being user-friendly is one of the major strengths of Tableau. Thanks to this feature, users with no coding or technical knowledge can use Tableau easily. Since most of the features are in a drag-and-drop format, any newbie can work on Tableau without possessing a prior set of skills.

DexLab Analytics is one of the most popular Tableau training institutes in Delhi. Take a look at their offerings.

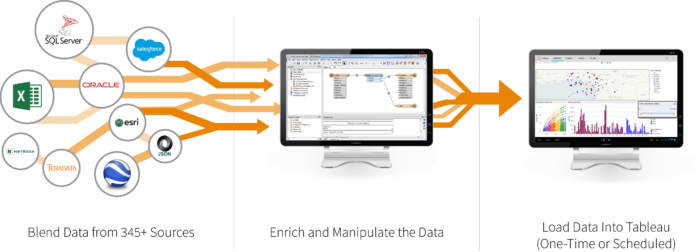
Works With Various Data Sources

This is what makes Tableau an absolute essential for business houses! In Tableau, data can be taken from anywhere irrespective of its sources. This feature makes it powerful as compared to other BI and Analytics tools. It lets you connect diverse data sources, cloud files, spreadsheet data, big data, data warehouses and various other types of data, including non-relational ones. The software can blend any kind of data to create amazing visualizations that are bound to garner admiration.

Are You Ready?

As of endnotes, a large number of Fortune Global 500 companies prefer Tableau over other data visualization tools. And why not! It is user-friendly and can solve complex business problems and prepare phenomenal visualizations within minutes.  

If you are interested in pursuing a business intelligence career, check out Tableau Certification Delhi. Such certification course will push your career to new heights. It will be a good start for your analytics career and you will get better opportunities to succeed.

Enroll now: <www.dexlabanalytics.com/courses/tableau-bi-visualization-certification>
 
The blog has been sourced from: www.knowledgehut.com/blog/business-intelligence-and-visualization/why-tableau-is-so-popular
 

Interested in a career in Data Analyst?

To learn more about Data Analyst with Advanced excel course – Enrol Now.
To learn more about Data Analyst with R Course – Enrol Now.
To learn more about Big Data Course – Enrol Now.

To learn more about Machine Learning Using Python and Spark – Enrol Now.
To learn more about Data Analyst with SAS Course – Enrol Now.
To learn more about Data Analyst with Apache Spark Course – Enrol Now.
To learn more about Data Analyst with Market Risk Analytics and Modelling Course – Enrol Now.

Know the Difference between Alteryx and Tableau

Know the Difference between Alteryx and Tableau

Alteryx and Tableau are two leading software products in the realm of data science with broad application. Both are pivotal in the analysis of data and obtaining important insights. But what is the specific role of each product in an enterprise? Are the products complementary or incompatible? Will using them jointly enhance performance? Read on to find out.

Function of Alteryx:

In general, data preparation takes up a major portion of an analyst’s time. Before the data can be analyzed, it needs to be prepped, which involves many humdrum tasks such as combining data sources together and changing the format of data. This process of readying the data in a format appropriate for analysis is called ETL, short for Extract, Transform and Load.

Alteryx is a top software product for simplifying the ETL process. It offers a large array of tools for handling data. From importing data from various sources to getting it ready for analysis work, Alteryx provides a tool for every task. After modifying the data, you can use Alteryx tools with advanced statistical capabilities to perform sophisticated analyses, like predictive analytics and time series forecasting.

For top rated Alteryx certification training in Delhi, get in touch with DexLab Analytics.

Function of Tableau:

Tableau is renowned as a useful data visualization tool, performing a distinct role in the world of data analytics.  Tableau helps transform data into charts and dashboards, revealing useful insights contained in the data. High-quality charts can be created with Tableau, which in turn leave an impactful impression on the audience.

Combination of the Two Tools:

Tableau and Alteryx complement each other really well. Alteryx comes in very handy in converting data into operable format, but it has limited capacity to display data before an audience. Tableau effectively fills this void. On the other hand, Tableau is unparalleled at data visualization, but is lacking in the field of data preparation, especially areas requiring advanced analytics. Hence, the combination of the two tools adds value to the overall task.

In a nutshell, Alteryx simplifies the tedious preparation process of data analysis and Tableau makes the explanatory part of analysis more enjoyable.

Who works with these products?

A good thing about Alteryx and Tableau is that they are user-friendly and hence, don’t demand advanced technical expertise. They contain easy-to-use drag and drop interfaces. So, data analysts with different levels of skill and experience are comfortable working with these tools.

However, these two software products are market leaders and that reflects in their cost. They are quite pricey and can be afforded only by companies greater than the average ones. It makes sense; because these companies generally work huge volumes of data and have the financial power to afford high-level analytics tools like these.

For companies with smaller budgets, Power BI can be an alternative to Tableau, but its functionality will not be at par with Tableau. In case of Alteryx, there isn’t a clear alternative. R and Python are typically used by businesses, but these are coding languages demanding high levels of skill.

2

Concluding Note:

Alteryx and Tableau are both leading products in the analytics industry, the former deals with data preparation whereas the latter deals with visualization. Together they boost up business operations. Affordability might be an issue for many organizations, but if you’re looking for the best products in the market, you cannot go wrong with Alteryx and Tableau.

Looking for ways to upskill and get a hefty pay hike in your analytics career? Check out the courses offered by DexLab Analytics. The faculty, comprising industry experts, provides professional certification courses in a number of key areas, like Tableau, credit risk modeling and more!

Reference: blog.kubicle.com/what-is-the-difference-between-alteryx-and-tableau


Interested in a career in Data Analyst?

To learn more about Data Analyst with Advanced excel course – Enrol Now.
To learn more about Data Analyst with R Course – Enrol Now.
To learn more about Big Data Course – Enrol Now.

To learn more about Machine Learning Using Python and Spark – Enrol Now.
To learn more about Data Analyst with SAS Course – Enrol Now.
To learn more about Data Analyst with Apache Spark Course – Enrol Now.
To learn more about Data Analyst with Market Risk Analytics and Modelling Course – Enrol Now.

Top 3 Data Visualization Tools Trending Now

Top 3 Data Visualization Tools Trending Now

The wave of digital transformation is ravaging all industry verticals. Big Data coupled with AI and ML is driving the force, with data being at the bull’s eye.

But, what if we say most of the data in the world is hardly used? What if it becomes a hefty liability? Yes, data can become a liability if we fail to understand it properly. For that, we’ve data visualization – it’s the best way to present your data to the world in order to gain meaningful insights.

Fortunately, data visualization is evolving rapidly. Charts, graphs, infographics, videos and AR/VR presentations have taken the channels of communication to an entirely different level. In this blog, we’ve compiled tip 3 most popular and effective data visualization tools – they are easy to use, do their job well and highly compatible with major software and programming languages. However, they are all paid, although they offer free-trials.

Tableau

With a huge customer base of 57000+accounts spread across diverse industry verticals, Tableau is the father of data visualization software and for the right reasons! Along with having the ability to generate interactive visualizations, Tableau is relatively easy to use and offers more than generic BI solutions.

Tableau is ideal for handling vast and fast-changing datasets that are used mainly for Big Data operations, such as ML applications and AI implementations. Developers and data scientists look up to Tableau as it integrates seamlessly with high-end database solutions, including My SQL, Hadoop, SAP, Amazon AWS and Teradata. Also, a wide number of third-party resources online are on offer plus a powerful community to aid and assist new users about how to integrate the tool seamlessly with their projects.

Interested in arming yourself with the skills of Tableau? Worry not; DexLab Analytics is a top-notch Tableau training institute in the heart of Delhi excelling in many other in-demand skill training courses.

Plotly

For highly advanced and complex data visualizations, Plotly is the key. All thanks to how well it homogenizes with cutting-edge programming languages, such as Matlab, Python and R! All of them being extremely analytics oriented.

Developed above the open source d3.js visualization libraries for JavaScript, this high-valued commercial package is extremely user-friendly, along with providing inbuilt support for APIs, like Salesforce.

Data Science Machine Learning Certification

QlikView

Touted as the biggest rival of Tableau, QlikView boasts of 40000 clients’ accounts across 100 countries. It is one of the most terrific players in the space of data visualization, and why not?! The customers who have used it have lauded QlikView because of its customized setup and versatile range of functionalities. However, this could also mean it takes some time to be familiar with entirely and then only it can be leveraged to its full potential.

Along with providing superior data viz capabilities, the tool excels in some of the best BI and analytics reporting capabilities. It’s simple, effective and non-clumsy user interface scores extra brownie points. Interestingly, customers use it in collaboration with its sister package, QlikSense – it manages data discovery and exploration to derive maximum benefits.

For more information on Tableau BI training courses, drop by DexLab Analytics! They are experts in everything DATA!


The blog has been sourced from:

www.forbes.com/sites/bernardmarr/2017/07/20/the-7-best-data-visualization-tools-in-2017/#6fdf13cf6c30


.

Guide on Tableau Essentials: Get Started with Calculated-Field User Functions

Guide on Tableau Essentials: Get Started with Calculated-Field User Functions

We are back with another article on Calculated Fields in Tableau! These step-by-step guides are for helping Tableau rookies master the basics of Tableau software. Not just beginners, these articles are suitable for all Tableau enthusiasts who want to explore the multiple cool features available in Tableau’s Calculated Field.

In today’s blog, we are discussing User Functions. User functions can generate filters depending on the data source. It is used to reference the identity, domain and membership of the current user on Tableau Server or Tableau Online. To access the User Functions window, right click on the Measure or Dimension window and select the option ‘’Create Calculated Field’’. Next select the option ‘’User’’ from the function drop-down menu.

Now, let’s examine the different User Functions one by one.

FULLNAME Function

FULLNAME()

The FULLNAME Function is used to return the full name of the current user. The full name is the Tableau Server or Tableau Online name used to sign in. Except for that, the Tableau Desktop user’s local or network full name is used. Example:

ISFULLNAME Function

ISFULLNAME(string)

This function gives back the value ‘’TRUE’’ if the user’s full name matches the specified string and returns ‘’FALSE” if it doesn’t match. Example:

ISMEMBEROF Function

ISMEMBEROF(string)

If the logged-in person currently using Tableau is a member of the group that matches the string then the ISMEMBEROF function gives back ‘’TRUE’’.  It returns ‘’FALSE’’ if the member is not signed in. Example:

ISUSERNAME Function

ISUSERNAME(string)

The ISUSERNAME Function is used to perform a true/false test where it returns ‘’TRUE’’ when the logged-in user’s name matches the string. Example:

USERDOMAIN Function

USERDOMAIN()

Once the user is signed into Tableau Server, the USERDOMAIN function may be used to return his/her domain. It returns the Windows domain when the user is on a domain. If not, then the function returns a null string. Example:

USERNAME Function

USERNAME()

The USERNAME function returns the username of the current tableau desktop user, which is the Tableau Server or Tableau Online username if the user is signed in. In case the user isn’t signed in, the local or network username is shown. Example:

This brings us to a close on user functions. These functions are one of the many amazing features of Tableau Software that offer users high-level of flexibility. They are very useful for developing customized views on Tableau server or Tableau Online, as the functions work like filters that limit what is visible to users depending on their username and domain.

Calculated fields make Tableau dashboards way more functional. In these blogs, we are covering the basics so you understand how to apply the functions. If you are interested to learn more about Tableau, then you must follow DexLab Analytics. We are a leading Tableau training institute in Delhi. Check back for our previous blogs on Tableau’s Calculated Field functions and definitely go through the details of Tableau BI training courses, which are available on our website.


This article has been sourced from: https://www.interworks.com/blog/ccapitula/2015/05/14/tableau-essentials-calculated-fields-user-functions


Interested in a career in Data Analyst?

To learn more about Data Analyst with Advanced excel course – Enrol Now.
To learn more about Data Analyst with R Course – Enrol Now.
To learn more about Big Data Course – Enrol Now.

To learn more about Machine Learning Using Python and Spark – Enrol Now.
To learn more about Data Analyst with SAS Course – Enrol Now.
To learn more about Data Analyst with Apache Spark Course – Enrol Now.
To learn more about Data Analyst with Market Risk Analytics and Modelling Course – Enrol Now.

Tableau Basics: An Article on Aggregate Functions in Calculated Fields

Tableau Basics: An Article on Aggregate Functions in Calculated Fields

Want to be an expert in Tableau? Then you must start with the basics and learn them well. And to help you in your endeavors, we have created a blog series covering the fundamentals of Tableau. These articles are easy-to-follow and shall help you understand how and when to use the Calculated Field functions.

In this blog, we discuss Aggregate Functions. In Aggregate Functions, we group together multiple rows of values to form a single input value that is more meaningful, like a set or list. In order to access these functions select the option ‘Aggregate’ from the drop down list for functions in the ‘Create Calculated Filed’ window.

Now, let’s discuss the different types of Aggregate Functions one by one ad look into a few examples. A person having some experience in Excel will find these functions familiar.


ATTR Function
ATTR(expression)


The ATTR function, short form for attribute, gives back a value when all rows have a single value. In case the values in the rows are different, the value ‘’*” is returned. It ignores null values. Example:

AVG Function
AVG(expression)


The AVG function returns a value that is the average of all the values in a given expression. It is used only for numeric fields. Null values are not considered. Example:

COUNT Function
COUNT(expression)


COUNT function returns the number of items present in a particular group. Null values are ignored. Example:

COUNTD Function
COUNTD(expression)


COUNTD function returns distinct items in a group and counts them only once. Null values are ignored.

The function isn’t offered in certain types of workbooks, like the ones that were created prior to Tableau Desktop v8.2, workbooks where MS Excel or text files are used as sources of data, etc. Example:

MAX Function
MAX(expression)


A MAX function is used to obtain the maximum of two expressions for each record or the maximum of a single expression across all records. The two expressions must have the same type of argument. If either of the arguments is NULL, then NULL value is returned. Example:

MEDIAN Function
MEDIAN(expression)


The median is the middle value of a sequence and the MEDIAN function is used to obtain the median for one particular expression. It only works for fields that are numeric. In case null values are present, they are ignored. Example:

MIN Function
MIN(expression)


The functionality of this function is similar to the MAX function. It is used to return the minimum of a single expression across all records or the minimum between two expressions for each record. If either of the two values is NULL, then a NULL value is returned. Like before, both the expressions need to have the same type of argument. Example:

PERCENTILE Function
PERCENTILE(expression, number)


A number between O and 1 is given and PERCENTILE function returns the percentile expression corresponding to that number. If 0.50 is given, then it returns the median number. Example:

STDEV Function
STDEV(expression)


This is actually a statistical function and stands for standard deviation. STDEV function is used to obtain the statistical standard deviation for all values for a specific expression pertaining to the sample of a population.


STDEVP Function
STDEVP(expression)


The STDEVP function is similar to the STDEV function above, but it returns the statistical standard deviation for all the values in an expression that pertains to a biased population.


SUM Function
SUM(expression)


Simply put, this function adds up all the values in an expression. Example:

VAR Function
VAR(expression)


VAR is another statistical function that returns the statistical variance for all the values in an expression pertaining to a sample of the population.


VARP Function
VARP(expression)


Similar to the function above, VARP function returns the statistical variance for all the values of an expression that pertains to the entire population.

Calculated Fields:

Calculated fields enable users to create more robust visualizations in Tableau. If you have missed our earlier blogs on Calculated Field functions, then visit the blog section of DexLab Analytics-we provide one of the best Tableau certifications in Delhi.

In order to be a Tableau expert, you need to enroll for comprehensive and well-structured Tableau BI training courses.


This article has been sourced from: www.interworks.com/blog/ccapitula/2015/05/07/tableau-essentials-calculated-fields-aggregate-functions


Interested in a career in Data Analyst?

To learn more about Data Analyst with Advanced excel course – Enrol Now.
To learn more about Data Analyst with R Course – Enrol Now.
To learn more about Big Data Course – Enrol Now.

To learn more about Machine Learning Using Python and Spark – Enrol Now.
To learn more about Data Analyst with SAS Course – Enrol Now.
To learn more about Data Analyst with Apache Spark Course – Enrol Now.
To learn more about Data Analyst with Market Risk Analytics and Modelling Course – Enrol Now.

Comprehensive Tableau Reference Guide: Calculated Field- Type Conversion Functions

Comprehensive Tableau Reference Guide: Calculated Field- Type Conversion Functions

In this blog, we introduce Type Conversion Functions. In the earlier blogs of the Comprehensive Tableau Reference Guide blog series, we have covered Logical Functions, Number Functions and Date Functions. These blogs are easy-to-read and particularly helpful for Tableau rookies who want to develop a foundational knowledge about the Calculated Field fundamentals. These step-by-step guides are perfect for Tableau enthusiasts who want to understand how and when to use the various functions available in Tableau’s calculated fields.  

Today, we will explain Type Conversion Functions. This group of functions enables users to change the data type of fields. You can convert the result of an expression to another data type. For example, using the Type Conversion functions, you can convert numbers, like age values, to strings. These functions are useful when the underlying data source needs some groundwork to harness the full potential of your visualization.

These functions are uncomplicated and easy to understand. So, let’s dive right in!

  • DATE Function

DATE(expression)

The date function is used to convert a number, string or date expression to a date. Example:

  • DATETIME Function

DATETIME(expression)

Datetime function takes the functionality of the Date function mentioned above a step further as it can be used to return a time component. This function is used to get back a datetime from a date, number or string expression. Example:

  • FLOAT Function

FLOAT(expression)

The Float function is used to return its argument as a floating point number. Example:

  • INT Function

INT(expression)

The INT function is used to convert its argument into an integer. This function truncates result of an expression to the integer closest to zero. Example:

  • STR Function

STR(expression)

The STR function is used to convert its argument into string data type. Example:

With the help of these functions, you can convert the result of arguments to different data types. For instance, if you want to make certain that all the values within date fields are date or datetime data types, then Date function and Datetime function comes very handy.

Want to learn about all the amazing features available in Tableau? Follow DexLab Analytics– we are among the leading institutes providing Tableau certification in Delhi. To know more about our Tableau BI training courses, visit our website. Check back for previous blogs where we have covered some essential Calculated Field functions.


This article has been sourced from: https://interworks.com/blog/ccapitula/2015/04/30/tableau-essentials-calculated-fields-type-conversion


Interested in a career in Data Analyst?

To learn more about Machine Learning Using Python and Spark – click here.

To learn more about Data Analyst with Advanced excel course – click here.
To learn more about Data Analyst with SAS Course – click here.
To learn more about Data Analyst with R Course – click here.
To learn more about Big Data Course – click here.

Comprehensive Tableau Reference Guide: Calculated Field-Date Functions

Comprehensive Tableau Reference Guide: Calculated Field-Date Functions

Calculated fields in Tableau are new fields created by a user that are saved in the data store and can be applied for constructing more robust visualizations.

Comprehensive Tableau Reference Guide is a blog series covering the fundamentals of Tableau Software to help you develop a foundational knowledge of the Calculated Field functions. So, if you are a newbie planning to get started with Tableau or if you simply want to explore the popular features in Tableau, then these step-by-step guides are perfect for you.

In this bog, we shall discuss about the Date Functions that you can use after creating a calculated field. In the previous two articles of this blog series, we explored Logical Functions and Number Functions. Now, let’s begin our exploration of Date Functions.

  • To open the Calculated Field window, right-click anywhere over the Date window (sidebar) and the menu appears on the screen.

  • Select the option ‘’Create Calculated Field”. This brings up the Calculated Field window. If you right-click on a specific dimension or measure to create a calculation, then the formula text region of the Calculated Field displays it.

  • Next, select the option ‘’Date’’ from the drop-down menu under ‘’Functions’’. This filters the functions to display only a list of Date Functions.

  • The date_part, which is applied in a number of Date Functions, can take the following values:
  • Second (0-60)
  • Minute (0-59)
  • Hour (0-23)
  • Day (1-31)
  • Weekday (1-7 or use their names, i.e. ‘’Monday’’, etc.)
  • Week (1-52)
  • DayofYear (1-365)
  • Month (1-12 or use their names, i.e. ‘’December’’, etc.)
  • Quarter (1-4)
  • Year (four-digit representation)

Next, let’s examine the Date Functions one by one:

  • DATEADD Function

DATEADD(date_part, interval, date)

The DATEADD function enables a user to specify a part of a date and then increment it. This function alters the date by incrementing the date_part by the number mentioned in the interval. Example:

  • DATEDIFF Function

DATEIFF(date_part, date1, date 2, start_of_week)

This function returns the difference between date1 and date2, expressed in units decided by date_part. The parameter start_of_week is optional, and if it is undefined, then the associated data source determines the start of the week.

  • DATENAME Function

DATENAME(date_part, date, [start_of_week])

Using this function, the date_part parameter of the date is returned as a string. Here also, the start_of_week parameter isn’t compulsory. Example:

  • DATEPARSE Function

DATEPARSE(format, string)

This function works exactly in the opposite manner of DATENAME function. It converts a string into a date or time following the format specified by the user. In case the string and specified format don’t match, then a Null value is returned. Example:

  • DATEPART

DATEPART(date_part, date, start_of_week)

This function returns the date_part parameter of the date as an integer. Again, the start_of_week parameter isn’t compulsory. Example:

When the date_part parameter is set as weekday, start_of_date parameter is excluded, as in this case Tableau uses a specific order to apply offsets.

  • DATETRUNC

DATERUNC(date_part, date, start_of_week)

This function is used to round off the date to the accuracy specified in the date_part of the function. Example:

The start_of_week is optional, and if excluded, then the data source determines it.

  • DAY

DAY(date)

This function is used to return the day of a specific date as an integer. Example:

  • ISDATE

ISDATE(string)

This function runs a logical test and is also incorporated within the list of Logical Functions. It tests a string and indicates if a specified data is valid (true) or not (false). Example:

  • MAX Function

MAX(expression) or MAX(expr1, expr2)

The MAX function is included in other categories of functions too. This function is used to return the maximum of a singular expression across all records or the maximum between two expressions for each record. Both the arguments need to be of the same type. In case one of the arguments is NULL, it returns a NULL value. Example:

  • MIN Function

MIN(expression) or MIN(expr1, expr2)

Similar to the MAX function, MIN function is popularly used as a Number Function, but is also used as a Date Function. This function is used to return the minimum of a singular expression across all records or the minimum between two expressions for each record. Both the arguments need to be of the same type. In case one of the arguments is NULL, it returns a NULL value. Example:

  • MONTH

MONTH(date)

This function is used to return the month of a particular date as an integer. Example:

  • NOW

NOW()

This function is used to get the current date and time. Example:

  • TODAY

TODAY()

This function is used to get the current date. Example:

  • YEAR

YEAR(date)

This function is used to return the year of a particular date as an integer. Example:

Want to learn more about Tableau? Follow DexLab Analytics, one of the leading Tableau training institutes in Delhi, to read more blogs covering all the fantastic features in Tableau. Check back for articles covering Logical Functions and Number Functions. If you are looking for Tableau certification courses in Delhi, check DexLab’s online and classroom tableau training courses.


This article has been sourced from: https://interworks.com/blog/ccapitula/2015/04/15/tableau-essentials-calculated-fields-date-functions


Interested in a career in Data Analyst?

To learn more about Data Analyst with Advanced excel course – Enrol Now.
To learn more about Data Analyst with R Course – Enrol Now.
To learn more about Big Data Course – Enrol Now.

To learn more about Machine Learning Using Python and Spark – Enrol Now.
To learn more about Data Analyst with SAS Course – Enrol Now.
To learn more about Data Analyst with Apache Spark Course – Enrol Now.
To learn more about Data Analyst with Market Risk Analytics and Modelling Course – Enrol Now.

Easy-to-Read Tableau Reference Guide on Calculated Fields – Number Functions

Easy-to-Read Tableau Reference Guide on Calculated Fields

It’s not possible for everyone to ace in Tableau, at least not yet. Tableau is a versatile data visualization application that facilitates users to examine structured data virtually, while displaying information in several interactive graphic perspectives. Though it’s very easy to use and a lot of individuals use Tableau Desktop for creating data visualizations, it churns out best results when employed by expert hands.

Thus, to help Tableau stalwarts, we’re here with a set of blogs on Tableau Essentials that will help you dig into the basics of using this powerful data visualization software, especially Desktop versions 8.1 and 8.2. This blog is a continuation of the Tableau blog on Logical Functions. It was part I and this one, which exclusively sheds light on Number Functions is part II. Here, we will deeply focus on another group of functions implemented for Tableau’s calculated fields. Scroll below to get started…

First, open the Calculated Fields window, right-click on the sidebar (Data window) and choose Create Calculated Field:

TECFNumber1_0-01

Now, in the Calculated Field Window, choose Number from the Functions drop-down menu:

TECFNumber5-02

LN FUNCTION

LN(number)

It returns the natural log of the number. Now, if the numbers appear to be less than or equal to zero, the function tends to return NULL.

For an example,

TECFNumber6-03

LOG FUNCTION

LOG(number,[base])

LOG brings back the log of the number for a given base. In case, there’s no base, the function will use base 10 by default.

For an example,

TECFNumber7-04

PI FUNCTION

PI()

It helps return the numeric constant of PI.

TECFNumber8-05

POWER FUNCTION

POWER(number, function)

This function increases the number to the defined power.

For an example,

TECFNumber9

RADIANS FUNCTION

RADIAN(number)

This is a superb function to convert numbers from degrees to radians.

TECFNumber10

ROUND FUNCTION

ROUND(number,[decimals])

Use this function to round off any number to the nearest integer or to a particular number of decimal places.

For an instance,

TECFNumber11

SIGN FUNCTION

SIGN(number)

This function brings back the sign of a number.

In case of positive numbers, it returns a 1.

For zero, it returns a 0.

For negative numbers, the function returns a -1.

For an example,

TECFNumber12

SQRT FUNCTION

SQRT(number)

It returns the square root of a number.

TECFNumber13

SQUARE FUNCTION

SQUARE(number)

This function returns the square of the number.

For an instance,

TECFNumber14

ZN FUNCTION

ZN(expression)

The specialty of ZN function is that it evaluates any expression.

If the function is NULL, it will return a value of 0, and if not, the expression is returned as before.

For example,

TECFNumber15

STATISTICAL

MAX FUNCTION

MAX(number, number)

This function returns the maximal of two expressions for each record or an expression throughout all records. However, the two statements have to be the same type. If one or the other argument turns NULL, the function returns a value of NULL.

TECFNumber16

MIN FUNCTION

MIN(number, number)

Just like MAX function, MIN function too returns the minimal of an expression across the records or minimal of two expressions for a particular record. The two arguments must be similar in type. Also, if one or the other arguments hold NULL, MIN returns a value NULL.

TECFNumber17

TRIGONOMETRIC

ACOS FUNCTION

ACOS(number)

ACOS function returns the arc cosine of the number and the outcome is in radians.

Take a look,

TECFNumber18

ASIN FUNCTION

ASIN(number)

This function returns the arc sine of the number. And as usual the outcome is in radians.

TECFNumber19

ATAN FUNCTION

ATAN(number)

It returns the arc tangent of any number, and as usual the outcomes is in radians.

TECFNumber20

ATAN2 FUNCTION

ATAN2(y number, x number)

It’s quite similar to the previous ATAN FUNCTION, except it’s used for two given numbers. Otherwise, all remains same.

TECFNumber21

COS FUNCTION

COS(number)

Cos returns the cosine of an angle. Just mention the angle in radians.

For example,

TECFNumber22

COT FUNCTION

COT(number)

COT FUNCTION returns the cotangent of an angle. Marking of angles in radians is important.

TECFNumber23

SIN FUNCTION

SIN(number)

This function returns the sine of an angle. For example,

TECFNumber24

TAN FUNCTION

TAN(number)

 TAN FUNCTION returns the tangent of an angle. You just need to mention the angle in radians and that’s it.

TECFNumber25

Typically, it all depends on the nature of your business; if it needs, you have to go through Number Functions routinely, otherwise not. Now, if you really have to use them then peruse over Tableau course details at DexLab Analytics. Being a premier Tableau training institute in Gurgaon, DexLab will offer a whole new layer of insight into Tableau Essentials.


The article has been sourced from – https://interworks.com/blog/ccapitula/2015/04/07/tableau-essentials-calculated-fields-number-functions


Interested in a career in Data Analyst?

To learn more about Machine Learning Using Python and Spark – click here.

To learn more about Data Analyst with Advanced excel course – click here.
To learn more about Data Analyst with SAS Course – click here.
To learn more about Data Analyst with R Course – click here.
To learn more about Big Data Course – click here.

Comprehensive Tableau Reference Guide: Calculated Fields-Logical Functions

Comprehensive Tableau Reference Guide: Calculated Fields-Logical Functions
Comprehensive Tableau Reference Guide is a blog series for explaining the basics of Tableau Software. So, if you are a newbie planning to get started with Tableau or if you simply want to explore the popular features in Tableau, then these step-by-step guides are perfect for you. In this blog, we will discuss about Logical Functions in Tableau.

  • Go to the Calculated Field window:

1

  • Go to Functions table. From the drop-down menu, select the option ‘’Logical’’:

2

  • This selection filters the list of functions to display a listing of only logical functions, which consists of seven different functions:

3

We will explain these functions one by one.

  • CASE Function:

CASE expression WHEN value1 THEN return1 WHEN value2 THEN return2… ELSE default return END

The CASE function is applied when we need to perform a logical test. This function returns values based on the result of the logical test. A CASE function can also be written as an IF function. Generally, CASE function statements are simpler and shorter.

Example of a formula using CASE function:

004

Going through the country field, when the function comes across the value ‘’United States’’, it uses ‘’USA’’. On the other hand, when it comes across “United Kingdom’’, the function uses ‘’UK”. For all other values in the country field, ‘’World’’ is used.

  • IF Function:

IF test THEN value END/IF test THEN value ELSE else END

A logical test can be created using the IF function. The function works like this- IF the test is true THEN carry out the given condition. The test portion of the function must be Boolean. This can be achieved either by selecting a Boolean field from data source or by constructing the expression using operators and logical comparisons (AND, OR, NOT).

Example:

Logical205

IF test1 THEN value1 ELSEIF test2 THEN value2 ELSE else END

This statement is used when the functionality of IF function needs to be expanded. Additional IF-THEN statements can be incorporated through ELSEIF. Here’s an example to rewrite the CASE formula above with IF-THEN-ELSEIF statement:

Logical3-03

The result is the same as before.

  • IFNULL Function:

IFNULL(expression1, expression2)

The IFNULL function is used to perform a true/false test and check if the value in the tested field is NULL or not. If the value isn’t null then the first value of the function is used, and if the value is null then the second one is used.

Logical4_05

If Total Population of a country has no value, then it will be reset as zero and the null shall be eliminated from the newly created field.

  • IIF Function:

IIF(test, then, else, [unknown])

IIF function is very much alike the IF function described above, just a shorthand version for the IF-THEN-ELSE statement. The final argument of IIF function can define a value in case the test produces an unknown result. Like the IF function, the test must be Boolean, either by data type or the result of the test must give a Boolean value.

Here’s an example:

Logical5-06

If the % of change field is lower than 5% then the value Poor will be returned, or else the value Good will be returned.

  • ISDATE Function:

ISDATE(string)

The ISDATE function is used to determine if a string argument can be converted to a valid date (TRUE) or not (FALSE).

Example:

Logical6_1

This formula is supported by Tableau since the field used is a string data type, however each result will be FALSE. This function comes handy in case dates are formatted in a manner that is unrecognizable by a user, like ISO 8601.

Example:

Logical7_2

The above value stands for September 1, 2014 and is obviously a valid date.

  • ISNULL Function:

ISNULL(expression)

This is a simple function that checks if an expression is null (TRUE) or not (FALSE).

Example:

Logical8-03

The Filter card enables users to filter null values from their visualization.

  • ZN Function:

Statement: ZN(expression)

The ZN function is a variant of the ISNULL and IFNULL functions. It tests whether a function is null or not. In case the function is null, it returns a zero value.

Example:

Logical9_04

It is natural to feel overwhelmed when you see a list of logical functions for the first time. Since we have discussed each one of them, hopefully these functions will come handy in your visualization and data leveraging pursuits.

To learn more about Tableau functions, follow Dexlab Analytics– it is one of the best Tableau training institutes in Delhi. Do take a look at their Tableau BI training courses.


This article has been sourced from:  https://interworks.com/blog/ccapitula/2015/04/01/tableau-essentials-calculated-fields-logical-functions


Interested in a career in Data Analyst?

To learn more about Machine Learning Using Python and Spark – click here.

To learn more about Data Analyst with Advanced excel course – click here.
To learn more about Data Analyst with SAS Course – click here.
To learn more about Data Analyst with R Course – click here.
To learn more about Big Data Course – click here.

Call us to know more