sas market risk courses Archives - DexLab Analytics | Big Data Hadoop SAS R Analytics Predictive Modeling & Excel VBA

Time Series Analysis Part I


A time series is a sequence of numerical data in which each item is associated with a particular instant in time. Many sets of data appear as time series: a monthly sequence of the quantity of goods shipped from a factory, a weekly series of the number of road accidents, daily rainfall amounts, hourly observations made on the yield of a chemical process, and so on. Examples of time series abound in such fields as economics, business, engineering, the natural sciences (especially geophysics and meteorology), and the social sciences.

  • Univariate time series analysis- When we have a single sequence of data observed over time then it is called univariate time series analysis.
  • Multivariate time series analysis – When we have several sets of data for the same sequence of time periods to observe then it is called multivariate time series analysis.

The data used in time series analysis is a random variable (Yt) where t is denoted as time and such a collection of random variables ordered in time is called random or stochastic process.

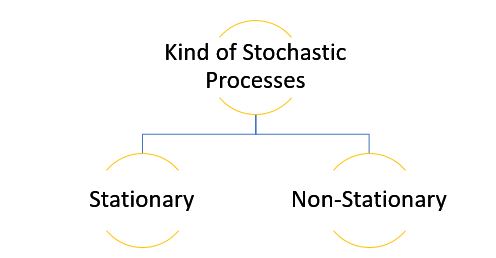
Stationary: A time series is said to be stationary when all the moments of its probability distribution i.e. mean, variance , covariance etc. are invariant over time. It becomes quite easy forecast data in this kind of situation as the hidden patterns are recognizable which make predictions easy.

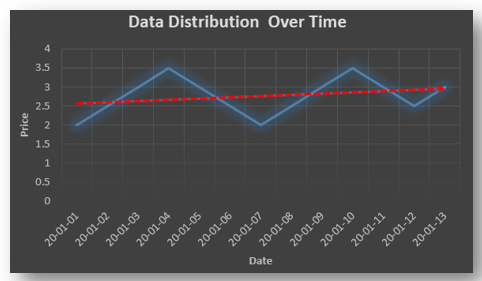
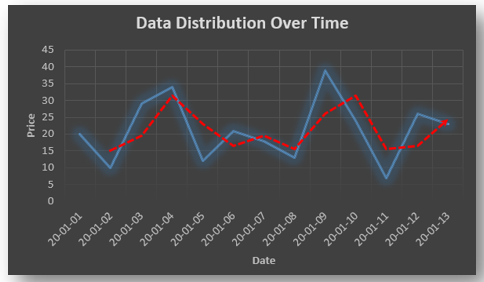
Non-stationary: A non-stationary time series will have a time varying mean or time varying variance or both, which makes it impossible to generalize the time series over other time periods.

Non stationary processes can further be explained with the help of a term called Random walk models. This term or theory usually is used in stock market which assumes that stock prices are independent of each other over time. Now there are two types of random walks:
Random walk with drift : When the observation that is to be predicted at a time ‘t’ is equal to last period’s value plus a constant or a drift (α) and the residual term (ε). It can be written as
Yt= α + Yt-1 + εt
The equation shows that Yt drifts upwards or downwards depending upon α being positive or negative and the mean and the variance also increases over time.
Random walk without drift: The random walk without a drift model observes that the values to be predicted at time ‘t’ is equal to last past period’s value plus a random shock.
Yt= Yt-1 + εt
Consider that the effect in one unit shock then the process started at some time 0 with a value of Y0
When t=1
Y1= Y0 + ε1
When t=2
Y2= Y1+ ε2= Y0 + ε1+ ε2
In general,
Yt= Y0+∑ εt
In this case as t increases the variance increases indefinitely whereas the mean value of Y is equal to its initial or starting value. Therefore the random walk model without drift is a non-stationary process.

So, with that we come to the end of the discussion on the Time Series. Hopefully it helped you understand time Series, for more information you can also watch the video tutorial attached down this blog. DexLab Analytics offers machine learning courses in delhi. To keep on learning more, follow DexLab Analytics blog.


.
5 On-Going Predictive Analytics Applications That Marketers Should Be Familiar With

5 On-Going Predictive Analytics Applications That Marketers Should Be Familiar With

Predictive Analytics is a very popular concept, and increasingly often, the marketing strategies are tied to the very idea of predictive analytics. However, businesses seeking insights about the future aren’t satisfied with whatever happened in the past. They want to know more, and that’s where the promising role of predictive analytics comes forth.

In this article, we will talk about some modern applications of predictive analytics that are deriving great results in the marketing sphere:

2

Five On-Going Predictive Analytics Marketing Applications

Customer behavior models

Once only bigwig companies, like Amazon and eBay had the ability to do customer behavior prediction, but with increasing expansion of technology, even smaller companies have adopted the practice. Developing a comprehensive catalogue of predictive models is for sure a challenging task, but fortunately a number of relatively easier model types are plying assistance in the marketing scope. Amongst them, three most significant predictive models are Cluster Models, Propensity Models and Collaborative Filtering.

Assessing and prioritizing leads

With 3 B2B marketing use cases, here’s how we can predict early success and prepare the base for more complex use of predictive analytics:

  • Predictive Scoring – Prioritizing known leads, prospects, and accounts based on how they are probable to act upon.
  • Identification Models – Determining and acquiring prospects with characteristics akin to existing consumers.
  • Automated Segmentation – It’s crucial to segmenting leads for customized messaging.

The above-said groundwork helps prepare sales team to better apply the strategies and prioritize leads that can be converted into buyers. But of course, the techniques mentioned above need a high sales volume to perfectly prepare a robust predictive model.

Assessing which products or services to introduce into the market

Data visualization is crucial. It is not only visually effective, but is also ideal in guiding actions, based on customer behavior. It notifies which type of customers lives near a particular store, what is their average age-density and what kind of products they buy: do they purchase hard or soft goods, who goes for grocery shopping, the aged ones or the younger ones, and so on.

Content is the king

Targeting the right customers with the right content at the right moment boosts customer segmentation. It’s one of the most common predictive analytics marketing tricks because it’s simple, effective and directly impacts ROI. Some of the most popular predictive analytic models for content targeting are response modeling, affinity analysis and churn analysis – all of them can foretell you whether it would be fruitful to combine digital and print subscriptions or keep them separate or help you differentiate between a content that should levy a subscription fee from a content that has a one-time sales price.

Enhancing marketing strategies with predictive analytics

 Apart from the above 4 uses, few other drilled-down uses of predictive analytics in the marketing domain are as follows:

  • Gaining access to internal structured data
  • Accessing social media data
  • Employing behavior scoring on customer data

These applications could ascertain whether a social media- based marketing campaign would meet a raging success or a mobile marketing strategy would be more beneficial for the target audience.

For readers interested in making predictive analytics your career option, opt for SAS certification for predictive modeling from DexLab Analytics. At present, SAS predictive modeling training is the go-to course program you need to give wings to your analytics career.


The article has been sourced from   https://www.techemergence.com/predictive-analytics-for-marketing-whats-possible-and-how-it-works


Interested in a career in Data Analyst?

To learn more about Machine Learning Using Python and Spark – click here.

To learn more about Data Analyst with Advanced excel course – click here.
To learn more about Data Analyst with SAS Course – click here.
To learn more about Data Analyst with R Course – click here.
To learn more about Big Data Course – click here.

Here’s All You Need to Know about DexLab Analytics’ Market Risk Modelling Live Demo Session

DexLab Analytics brings Market Risk Modelling training to India. Internet has helped people become technology-driven. Digital transformation is evident all around us. No more, gaining knowledge is a task like moving mountains – right from the confinements of your home, you can now get access to a plethora of information and knowledge, thanks to online learning. Several professionals and students are opting for e-learning method of education, owing to its flexibility and ease of access. And India is not lagging behind in this. Several online classes and sessions are being organized by premier data science learning institutes in India, and DexLab Analytics is one of them. 

 
Here’s All You Need to Know about DexLab Analytics’ Market Risk Modelling Live Demo Session
 

DexLab Analytics is here with an intensive live demo session on Market Risk Modelling Online for free. The online workshop is taking place on 25th October, 2017 from 10:00PM IST onwards, and will solely focus on how Market Risk Analytics has grown to be the new in-demand analytics course for the financial sector. Our in-house trainers will extensively explain the nitty-gritty of MRM, including its importance, major components, and why is it a must-to-have skill for the future. The interested candidates are asked to register as soon as possible by penning down a mail to DexLab Analytics, mentioning they would attend the workshop on the specified date and time.

Continue reading “Here’s All You Need to Know about DexLab Analytics’ Market Risk Modelling Live Demo Session”

Market Risk Analytics: What It is All About

Market Risk Analytics: What It is All About

With time, firms need more efficient, versatile and highly functional analytics tools to address new, complex issues related to market risk. Market risk analytics involve a comprehensive set of integrated, scalable and productive solutions for wide-range risk management across various verticals of asset classes.

A New Course Alert! DexLab Analytics Launches Market Risk Analytics and Modelling – @Dexlabanalytics.

Why Risk Analytics?

Risk analytics basically help organizations realize the existence of risks lying under business activities – by facilitating enterprises to identify, determine and manage their company risk. In lieu of this, the pressing need for risk analytics is going to increase across industries in the coming few years. New developments, like real-time risk analytics, which is an advanced form of traditional risk analytics process that calculates risk on a real-time basis, are influencing the entire market, while accentuating its mitigating abilities.

DexLab Analytics Introduces Market Risk Analytics and Modelling Online Session – @Dexlabanalytics.

What the Course Offers?

Many top notch education-providing companies are now offering Market Risk Analytics and Modelling online course to better alleviate and handle risks. Increasing needs to address particular risk-induced challenges and excessive focus on the financial market sector is driving the risk analytics market in India. Hence, learning and honing your skills on market risk is indispensable – DexLab Analytics brings Predictive modelling of market risk using SAS to India. The course module will address key issues, like the different types of risks faced by banks, the 1990’s financial crisis, sources and scope of market risk, theoretical probability distributions, volatility forecasting and clustering models, value at Risk Modelling, quantitative models of market risk and description of key financial products.

Some of the most common types of risks that banks are exposed to are Credit risk, Market risk, Operational risk, Liquidity risk, Business risk, Reputational risk, Systemic risk and Moral hazard. All banks need to establish separate risk management departments to manage, monitor and mitigate such high-flying risks. The concept of probability distributions sheds light on investing options – stock returns are expected to be distributed normally, but the reality may vary. They are mostly used in risk management to determine the probability of an event as well as the proportion of losses that it would strike based on a distribution of historical returns. Clustering models is another branch of risk analytics that helps in identifying groups of similar records and marking the records in accordance to the group in which it belongs. These models are also known as unsupervised learning models. Apart from this, other valuable concepts will be addressed during the online live sessions.

Closing Thoughts

Emergence of real time risk analytics is boosting the market of risk analytics. Technology being the driving factor for real-time analysis trades data to the organizations to balance market volatility. Leading service providers are on their quest to design and develop dynamically configurable risk analytics frameworks for clients. And why not, risk analytics boasts of widespread applications, starting from fraud detection to liquidity risk analysis, credit risk management and product portfolio management – various industries are nowadays looking up to market risk analytics, including banking, financial services, government, healthcare, insurance, manufacturing, transportation and logistics, consumer goods and retail, energy and utilities, telecommunication and information technology (IT), media and entertainment, and many others.

Reach us at DexLab Analytics for over-the-top SAS risk management certification course. Their courses are truly remarkable and perfect to take a step into the world of analytics.


Interested in a career in Data Analyst?

To learn more about Data Analyst with Advanced excel course – Enrol Now.
To learn more about Data Analyst with R Course – Enrol Now.
To learn more about Big Data Course – Enrol Now.

To learn more about Machine Learning Using Python and Spark – Enrol Now.
To learn more about Data Analyst with SAS Course – Enrol Now.
To learn more about Data Analyst with Apache Spark Course – Enrol Now.
To learn more about Data Analyst with Market Risk Analytics and Modelling Course – Enrol Now.

Call us to know more