SAS Courses and R Archives - Page 3 of 3 - DexLab Analytics | Big Data Hadoop SAS R Analytics Predictive Modeling & Excel VBA

Delimiters And Delimited Data in SAS

In this blog post we will delve into the world of delimiters as found in the SAS system of data analysis tools. Delimiters are an essential part of SAS without whose guidance SAS would be in some blind inspite of all the data that surrounds it as the data supplied to it either internally or as an external file.


sas courses

What are Delimiters?

Delimiters are essentially symbols to SAS that lets SAS know that the data is separate. They distinguish one set or category of data from others. This should give you an idea about how essential a part of data analytics, a delimiter plays.

How are the Delimiters Symbolized?

SAS accepts the following symbols and key strokes as delimiters:

  •  ,
  •  :
  • Tab
  •  ~
  • &
  •  –

How to Import Delimited Data?

This command imports data infile

Data claim_data;

infile datalines dlm = “,”;

Input sex $ name $ claim_amount ; datalines;

Male,Mahesh,15000

Male,Naveen,10000

Female,Neeta,18000

Male,Amit,7500

Female,Geeta,12000

;

run;

data claim_data ;

Infile E:\Project FT\SAS\Course Material\Class 1\Claim Data comma.txt’ dlm = “,”;

Input sex $ name $ claim_amount ;

Run;

What are the Functions of Delimiters?

An INFILE option, the DSD or delimiter-sensitive data serves varied functions. They are as follows:

  • The default delimiters are changed to wanted ones from the default blank.
  • In case a row contains two delimiters, SAS interprets that there is an instance of a case of missing value.
  •  Delimiters also strip the quotes within which character values are placed.

So the command would boil down to:

data claim_data ;

Infile E:\Project FT\SAS\Course Material\Class 1\Claim Data comma.txt’ dsd;

Input sex $ name $ claim_amount ;

Run

How to Read Data from an External CSV file?

Our next task is to read data from external CSV files. In order to do so we have to input the following:

proc import datafile = “E:\Project FT\SAS\Course Material\Class 1\exam_results.csv”

dbms = csv replace out = class_10_result; Getnames = yes; run;

In a Nutshell

What are Format, Informat and DSD?

  • Informat : This command instructs SAS how exactly to going about reading the data.
  • Format : This instructs SAS about the exact way in which to show the details.
  • DSD : This defines how data is separated by a delimiter.

10 Things You Might Not Have Known About Your Favorite SAS Authors

10 Things You Might Not Have Known About Your Favorite SAS Authors

If you are into the ecosphere of SAS it is most probable that at some point you have read their SAS books. But now it is time to be illuminated about a previously unknown side of your favorite SAS author.

  • Tricia Aanderud

    Tricia has the distinction of having 100 jokes committed to memory including some that would fall into the category of dubious taste.

  • Bill Benjamin

    Bill contemplated photography, art and even journalism classes during high school. When giving computers too a thought, the golden idea of flipping a coin to decide his destiny came upon him. And the result benefited the world of SAS.

  • Patricia Berglund

    She is game for adventures regarding sled dogs and racing too! Under her adaptation is a sled dog,  now retired from the wild sport.

  • Chuck Boiler

    Chuck has had a brief experience in teaching grade school where he fell in love with learning which he pursues through his popular SAS books.

  • Iain Brown

    Iain digs anything that is remotely associated with football and uses all the SAS tools to pick and maintain his very own fantasy team.

  • Michele Burlew

    Her SAS macro quoting functions comparison to cloaking devices referred to in Star Trek made by her husband found its way in the first edition of the book “SAS Macro Programming Made Easy”.

  • 2

  • Art Carpenter

    A backpacker by heart,  Art once hiked through the John Muir Trail along with his daughter.

  • Charlie Chase

    An avid jazz aficionado he has had the opportunity to watch Winton Marsalis, Dizzy Gillespie, David Benoit and Grover Washington Jr, his personal favorite,  in action.

  • Ron Cody

    One of the ruling passions of John is scuba diving and he is the sort who will work his way through datasets while being on vacation.

  • Lora D. Delwiche

    Lora spent a few months in Israel and Belgium while her husband took a long leave from his university job.

Endwords

Besides getting into the details of SAS authors, get yourself enrolled in state-of-the-art SAS courses. DexLab Analytics boasts of the best SAS certification and it will provide more of such trivia in the days to come. So stay tuned.


Interested in a career in Data Analyst?

To learn more about Machine Learning Using Python and Spark – click here.
To learn more about Data Analyst with Advanced excel course – click here.
To learn more about Data Analyst with SAS Course – click here.
To learn more about Data Analyst with R Course – click here.
To learn more about Big Data Course – click here.

How Much You Can Expect To Earn As A SAS Expert in India

The salary, on an average, for a SAS Programmer residing in India stands at Rs. 396,305. This salary is calculated on a yearly basis. It has been observed that most SAS programmers switch to other, mainly more senior, positions after 10 years in this particular career path. This is a field that has strong emphasis on experience which is reflected in the salary as well. For a higher paying position, associated skills like MS Excel, UNIX and SQL/PL are highly recommended.
How Much You Can Expect To Earn As A SAS Expert in India

Average Salary

According to National Salary Data, the salary of a SAS Programmer might range from anywhere in between Rs 201,550 at the bottom end of the spectrum to a whopping Rs 857,227 at the top. Further,  bonuses range from none to Rs 100,591. In some instances there is also an option of profit sharing which starts from none and caps at Rs 59,598. This pushes the pay range to lie anywhere in between Rs. 205,987 to Rs 917,343.

Continue reading “How Much You Can Expect To Earn As A SAS Expert in India”

Top 10 Books Essential for SAS Beginners – Part1

Statistical Analysis System or more popularly abbreviated simply as SAS is a suite of software tools which was created by the SAS Institute for use in business intelligence, analysis of multivariates, management of data as well as predictive analytics. The development of the SAS suite initially took place in 1966 at the “ North Carolina State University” and was maintained by the same institute till 1976 when the SAS Institute happened to be incorporated. Later on new procedures in statistics, more components and JMP were introduces as part of the SAS Bundle. A point and click UI was followed in its 9th version realized in 2004. Social Media analytics found its pride of place in 2010.

Top 10 Books Essential for SAS Beginners Part-I

Continue reading “Top 10 Books Essential for SAS Beginners – Part1”

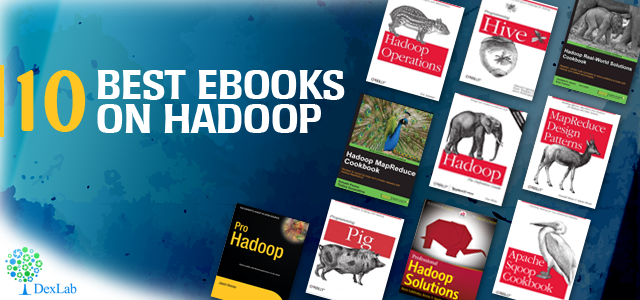
Top 10 Best Hadoop EBooks That You Should Start Reading Now

Top 10 Best Hadoop EBooks That You Should Start Reading Now

Based on Java, Hadoop is a free open source framework for programming where dealings with huge amounts of processed data in a computing environment is said to be distributed. None other than the Apache Software Foundation is sponsoring it. If you are looking for information about Hadoop, you will like to get in-depth information about the framework and its associated functions. To get you up to the mark with the concepts, the eBooks listed below will prove to be of invaluable help.

2

MapReduce

If you are looking forward to get started with Hadoop, and maximize your knowledge about Hadoop clusters, this book is of right fit. The book is loaded with information on how t o effectively use the framework to scale apps of the tools provided by Hadoop. This ebook lets you get acquainted with the intricacies of Hadoop with instructions provided on a step-by-step basis and guides you from being a Hadoop newbie to efficiently run and tackle complex Hadoop apps across a large number of machine clusters.

Also read: Big Data Analytics and its Impact on Manufacturing Sector

Programming Pig

Prog_pig_comp.indd

If you are looking for a reference from which you may learn more about Apache Pig, which happens to be the engine powering executions of parallel flows of data on the Hadoop framework which also is open source, the Programming Pig is meant for you. Not only does it serve the interests of new users but also provides advanced users coverage on the most important functions like the “Pig Latin” scripting language, the “Grunt” shell and the functions defined by users for extending Pig even further. After reading this book, analyzing terabytes of data is a far less tedious task.

Also read: What Sets Apart Data Science from Big Data and Data Analytics

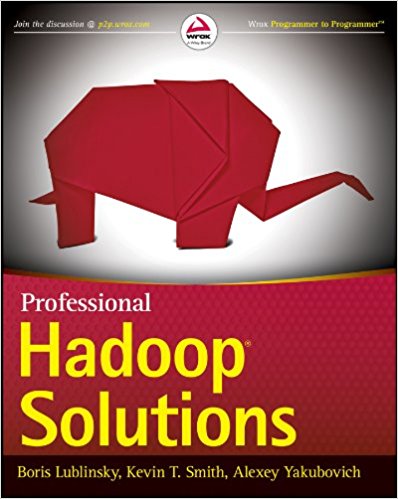
Professional Hadoop Solutions

51gb9XbHEmL._SX396_BO1,204,203,200_

This book covers a gamut of topics such as that how to store data with Hbase and HDFS, processing the data with the help of MapReduce and data processing automation with Oozie. Not limiting to that the book further covers the security features of Hadoop, how it goes along with Amazon Web Services, the best related practices and how to automate in real time the Hadoop processes. It provides code examples in XML and Java and refers to them in-depth along with what has been added to the Hadoop ecosystem of late. The eBook positions itself as comprehensive resource with API coverage and exposition of the deeper intricacies, which allow developers and architects to better customize and leverage them.

Also read: How To Stop Big Data Projects From Failing?

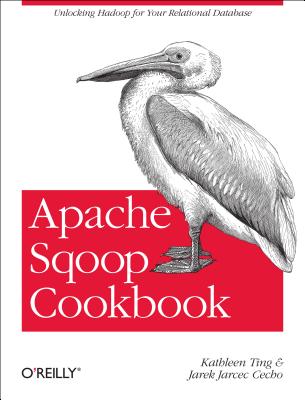
Apache Sqoop cookbook

9781449364625

This guide allows the user to use Sqoop from Apache with emphasis on application of parameters that are enabled by the Command Line Interface when dealing with cases that are used commonly. The authors offer Oracle, MySQL as well as PostgreSQL examples of databases on GitHub that lend themselves to be easily adapted for Netezza, SQL Server, Teradata etc relational systems.

Also read: Why Getting a Big Data Certification Will Benefit Your Small Business

Hadoop MapReduce Cookbook

51CBDiRJBPL._SX342_QL70_

The preface of the book claims that the book enables readers to know how to process complex and large datasets. The book starts simple but still gives detailed knowledge about Hadoop. Further, the book claims to be a simple guide on getting things done in one place. It consists of 90 recipes that are offered simply and in a straightforward manner, coupled with systematic instructions and examples from the real world.

Also read: How to Code Colour Values Within SAS Enterprise Guide

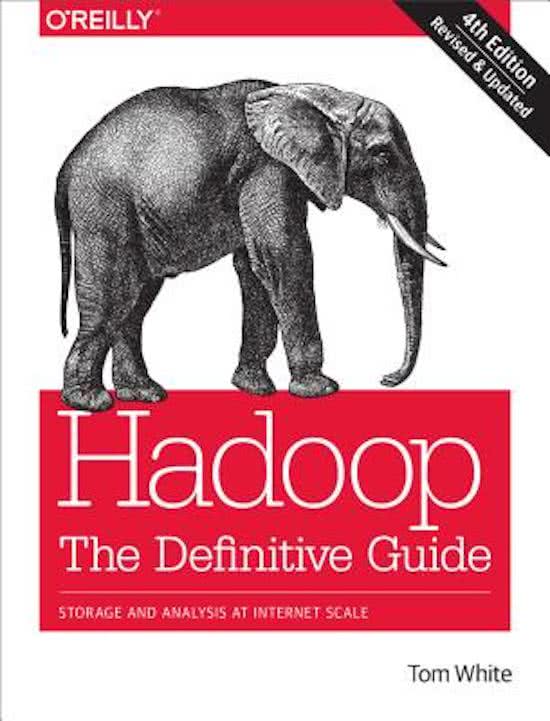
Hadoop: The Definitive Guide, 2nd Ed

9200000035483086

If you want to know how to maintain and build distributed systems that are both scalable and reliable within the framework of Hadoop then this book is for you. It is intended for – programmers who want to analyze datasets, irrespective of size; and – administrators, who seek to know the setting up and running of Hadoop Clusters, alike. New features like Sqoop, Hive as well as Avro are dealt with in the new second edition. Case studies are also included that may help you out with specific problems.

Also read: How to Use PUT and %PUT Statements in SAS: 6 Tips

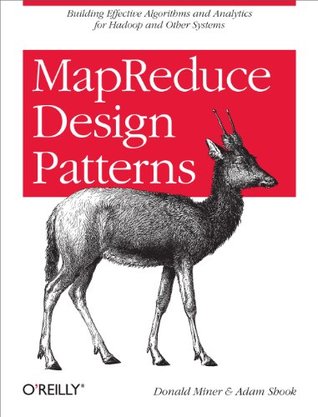
MapReduce Design Pattern

19057545

If one is to go by the book’s preface, the book is a blend of familiarity and uniqueness. The book is dedicated to design patterns by which we refer to the general guides or templates for solving problems. It is however more open-ended in nature than a “cookbook” as problems are not specified. You have to delve more in the subject matter than mere copying and pasting, but a pattern will get you covered about 90% of the whole way regardless of the challenge at hand.

Also read: SAS Still Dominates the Market After Decades of its Inception

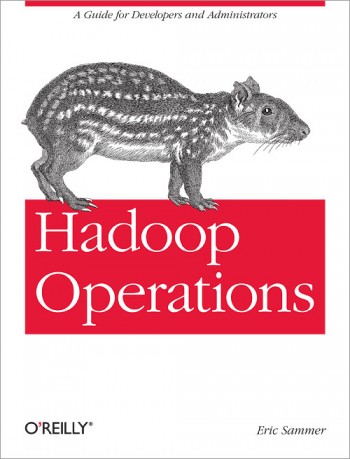
Hadoop Operations

lrg (1)

This book is necessary for those who seek to maintain complex and large clusters of Hadoop. Map Reduce, HDFS, Hadoop Cluster Planning. Hadoop Installation as well as Configuration, Authorization and authentication, Identity, Maintenance of clusters and management of resources are all dealt in it.

Also read: Things to judge in SAS training centres

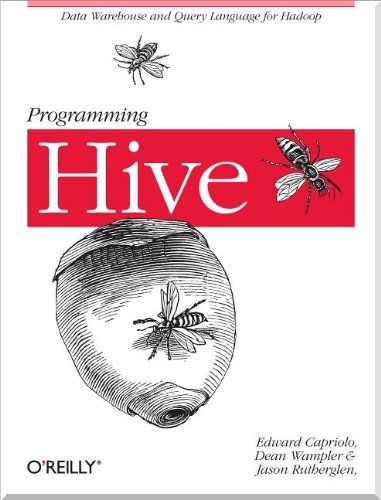
Programming Hive

programming-hive-repost-5332.jpeg

Knowledge on programming in Hive provides an SQL dialect in order to query data, which is stored in HDFS, which makes it an indispensable tool at the hands of Hadoop experts. It also works to integrate with other file systems, which may be associated with Hadoop. Examples of such file systems may be MapR-FS and the S3 from Amazon as well as Cassandra and HBase.

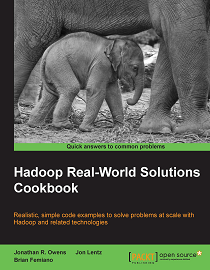
Hadoop Real World Solutions CookBook
Hadoop-Real-World-Solutions-Cookbook

The preface of this eBook illustrates its use. It lets developers get acquainted and become proficient at problem solving in the Hadoop space. The reader will also get acquainted with varied tools related to Hadoop and the best practices to be followed while implementing them. The tools included in this cookbook are inclusive of Pig, Hive, MapReduce, Giraph, Mahout, Accumulo, HDFS, Ganglia and Redis. This book intends to teach readers what they need to know to apply Hadoop knowledge to solve their own set of problems.


So, happy reading!
 

Enjoy 10% Discount, As DexLab Analytics Launches #BigDataIngestion

DexLab Analytics Presents #BigDataIngestion


Besides, feeding knowledge through eBooks, it is vital to be enrolled for an excellent Big data hadoop certification in Gurgaon. DexLab Analytics is here for you; it offers a gamut of high-end big data hadoop training in Delhi, courses that will surely hone your data skills.


Interested in a career in Data Analyst?

To learn more about Data Analyst with Advanced excel course – Enrol Now.
To learn more about Data Analyst with R Course – Enrol Now.
To learn more about Big Data Course – Enrol Now.

To learn more about Machine Learning Using Python and Spark – Enrol Now.
To learn more about Data Analyst with SAS Course – Enrol Now.
To learn more about Data Analyst with Apache Spark Course – Enrol Now.
To learn more about Data Analyst with Market Risk Analytics and Modelling Course – Enrol Now.
Munich Re Bets its Big Data on SAS

Munich Re which one of the leading reinsurers in the world, has opted to deploy SAS in order to achieve the goal of its Big Data strategy. Business units and specialist departments across verticals are all set to use the SAS platform in order to carry out critical functions like forecasts, analyses, pattern recognition and simulations.

Quotes

The SAS software suite automates the whole process of acquisition as well as analysis of content derived from complex contracts as well as claim notifications. Having access to a large pool of data the company is better placed to innovate by making use of Big Data analytics. This will let it offer new and customized offers or proposals, Put in place for access throughout the world, the Analytics platform from SAS comes into play by accessing a considerable number of internal and external sources of data. Its flagship in-memory tech makes it possible to analyze huge data quantities of data interactively so as to be able to find new correlations that would otherwise be impossible to recognize in the absence of highly advanced tools for analytics. The in-database processing model allows development and management of data models to be directly run from the database itself. This in simple terms translates to that the analyses are our in the platform SAP HANA or its open-source counterpart, the Hadoop framework. These tools enable analysis of unstructured text data in massive quantities.

The factors which turned the decision for Munich Re in favor of SAS were the speed at which the analyses were carried out, the upward graph in the tech graph, the performance of the team for SAS overall and the ability of the system to deliver and deploy results swiftly.

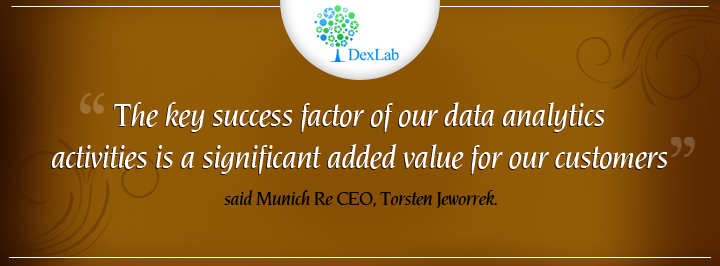
The CEO for Munich Re Torsten Jeworrek attributed the success of their analysis of data to it and added that it contributed significantly to the value gotten by their customers. He also forecasted that with the adaptation of these new technologies the ability of Munich Re to combine the customer data and compare it with the expert knowledge and findings of the company.

Data Preparation using SAS

Data Preparation using SAS

Before doing any data analysis, there are tasks which are critical to the success of the data analysis project. That critical task is known as data preparation. You may have heard that in the last years the data production is expanding at an astonishing pace. Experts now point to a 4300% increase in annual data generation by 2020. This can be due to the switch from analog to digital technologies and the rapid increase in data generation by individuals and corporations alike. The most of the data generated in the last few years are unstructured.

sass

In the above context, it is highly important to prepare your data from the unstructured dataset to a structured dataset to do a meaningful analysis.

“Data preparation means manipulation of data into a form suitable for further analysis and processing”

“Data Preparation techniques consists of Cleaning, Integration, Selection and Transformation”

We will discuss some of the data preparation techniques in SAS using SAS. INFORMAT is used to read the data with special characters. FORMAT is used to display the data with special characters.


Data DP.Practice;

length City $10.;
 input City $ ID $ Age Salary DOJ Profit;
 informat Salary dollar6. DOJ ddmmyy10. Profit dollar7.2;
 format Salary dollar6. DOJ ddmmyy10. Profit dollar7.2;
 label DOJ = "Date of Joining";
 rename Salary = Salary_of_Employee;
 datalines;
 Bangalore T101 24 $2,000 12/12/2010 $300.50
 Pune T102 29 $3,000 11/10/2006 $400.50
 Hyderabad T103 $5,000 12/10/2008 $500.70
 Delhi T104 $6,000 12/12/2009 $450.00
 Pune T105 $7,000 12/12/2009 $450.00
 ;
 run;


On the above SAS code, we have used both the INFORMAT and FORMAT to read and display the data with special characters. The SAS INFORMAT statement read the salary as numeric variable and in a specific format i.e. $5,000 which is of 6 characters including $. The FORMAT statement displays the same in your input data. Rename and label statements helps modify the variables metadata for further understanding of the dataset.

2

We will apply some transformations techniques in a dataset which helps us to apply some advanced analytical techniques in the data. We have a dataset that has various attributes of a customer who has subscribed or not subscribed an edition. In our dataset we have a categorical variable status which holds the observation either “Subscribed” or “Not Subscribed”.  We can transform the categorical variable into a dichotomous variable to run a logistic regression on our dataset.


Data media01;
 set DP.media;
 length status $15;
 If status =”subscribed” then status = “0”;
 else status = “1”;
 run;


On the above SAS code, we have applied simple If Else statements to transform our dataset called media. Transforming a categorical variable into a dichotomous variable helps us to apply the analytical techniques that we want to run in our dataset. Once after the transformation is done, the dataset is good to go for the next stage i.e. data analysis.

The more you torture your data i.e. Data Preparation, the more the success on the outcome of the data analysis.


DexLab Analytics offer state of the art SAS training courses. They are a premier SAS training institute that caters to the needs of their students round the clock.


Interested in a career in Data Analyst?

To learn more about Data Analyst with Advanced excel course – Enrol Now.
To learn more about Data Analyst with R Course – Enrol Now.
To learn more about Big Data Course – Enrol Now.

To learn more about Machine Learning Using Python and Spark – Enrol Now.
To learn more about Data Analyst with SAS Course – Enrol Now.
To learn more about Data Analyst with Apache Spark Course – Enrol Now.
To learn more about Data Analyst with Market Risk Analytics and Modelling Course – Enrol Now.

Quantitative Analysis 2 – Box Plot

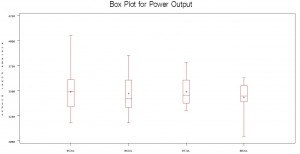
As we discussed about the Five Number Summary in the earlier blog post, we will continue to explore the Five Number Summary using Box Plot. Box Plot helps an analyst to identify the distribution of a numeric variable across multiple categorical variables. Box Plot is a graphical representation of data that shows a data set’s lowest value, highest value, median value and the size of the first and third quartile.

In the below example, we are inputting the data into the Base SAS using a simple data step procedure. We are creating a dataset called Turbine that has an average power output on a daily basis.

Box Plot 1

SAS Code to input the data:

data Turbine;
informat Day date7.;
format Day date5.;
label KWatts=’Average Power Output’;
input Day @;
do i=1 to 10;
input KWatts @;
output;
end;
drop i;
datalines;
05JUL94 3196 3507 4050 3215 3583 3617 3789 3180 3505 3454
05JUL94 3417 3199 3613 3384 3475 3316 3556 3607 3364 3721
06JUL94 3390 3562 3413 3193 3635 3179 3348 3199 3413 3562
06JUL94 3428 3320 3745 3426 3849 3256 3841 3575 3752 3347
07JUL94 3478 3465 3445 3383 3684 3304 3398 3578 3348 3369
07JUL94 3670 3614 3307 3595 3448 3304 3385 3499 3781 3711
08JUL94 3448 3045 3446 3620 3466 3533 3590 3070 3499 3457
08JUL94 3411 3350 3417 3629 3400 3381 3309 3608 3438 3567
;
run;

SAS Code to plot Box Plot:

title ‘Box Plot for Power Output’;

proc boxplot data=Turbine;

plot KWatts*Day;

run;
SKEWS in the data:
The Box Plot not only helps you to find the Five Number Summary, you can also find which way the data is skewed.
You can see in the below Box Plot, the data for the day 05July is Right Skewed and the data for 08July is Left Skewed. You can plot a box plot for the sales data across every month in a year. You can find whether any Skewness in you sales data of a month by looking at the Box Plot. This can help you identify the variances and the data distribution for the sales.

The prime importance of using Box Plot and interpretation of data distribution is that Box Plot helps to read the data distribution across multiple series of categories. A single Box Plot can helps you to identify the data distribution rather than looking at single data distribution.
You can create a Box Plot by following the below code in R.
Boxplot(KWatts ~ Day, data=Turbine, main= “Box Plot for Power Output”, xlab = “Average Power Output”, ylab = “Days”)
R software gives lot of functions to play around the Box Plot with different colors. You can explore those options for better interpretation and the visual appealing for presenting your analysis.

Import and Export of dataset using SAS and R

Import and Export of dataset using SAS and R
 

For an analyst, data is a primary raw material, which is used to draw conclusions and inferences for taking business decisions. Raw data is of less help to draw conclusions and inferences. Hence, we need to put the data into any statistical analysis software to slice and dice to bring inference for better decision making. In this post, we will discuss about the steps to import and export of a dataset using SAS and R.

Continue reading “Import and Export of dataset using SAS and R”

Call us to know more