sas certification Archives - Page 3 of 4 - DexLab Analytics | Big Data Hadoop SAS R Analytics Predictive Modeling & Excel VBA

Predictive Analytics: In conversation with Adam Bataran, Managing Director of GTM Global Salesforce Platforms at Bluewolf

To discuss about Predictive Analytics, we have Adam Bataran, Managing Director of GTM Global Salesforce Platforms at Bluewolf with us.


Follow the answers Mr. Bataran pitches to understand the entire concept better.

 
Predictive Analytics: In conversation with Adam Bataran, Managing Director of GTM Global Salesforce Platforms at Bluewolf
 

The question: What does predictive analytics mean and what value it imparts to the businesses today?


The answer: Predictive Analytics functions by implementing data, machine learning techniques and statistical algorithms to predict the future business outcomes and trends, based on past data and figures. It involves a number of distinct but advanced analytics disciplines and technologies – from deep data mining techniques and statistical analysis to predictive modeling and machine learning answers the most sought after question, “what will happen next?” or “how the customers will react to this?”.

Continue reading “Predictive Analytics: In conversation with Adam Bataran, Managing Director of GTM Global Salesforce Platforms at Bluewolf”

New and Improved Data Pane in SAS Visual Analytics Now Goes Painless

New-and-Improved-Data-Pane-in-SAS--Visual-Analytics-Now-Goes-Painless
 

It seems some good news is waiting for you – honing your data for effective reports are easier now with the 8.1 release of SAS Visual Analytics. In this technical blog, we will understand the structure of data pane, how it exhibits data from an active data source, and a handful number of tasks, which you might want to perform – like viewing measure details, adjusting data item properties and fabricating geographic data items, custom categories and hierarchies.

Continue reading “New and Improved Data Pane in SAS Visual Analytics Now Goes Painless”

When Machines Do Everything – How to Survive?

In the coming years, jobs and businesses are going to be impacted; reason AI. Today’s generation is very much concerned about how the bots will consume everything; from jobs to skills, the smart machines will spare nothing! It is true that machines are going to replace man-powered jobs – by using robots, mundane jobs can be performed in a flick of an eye freeing people working in bigger organisations to innovate and succeed.


Machine Learning training course Pune

Continue reading “When Machines Do Everything – How to Survive?”

Trends to Watch Out – Global Self-service Business Intelligence (BI) Market 2017

Gartner says – By 2020, the global BI and Analytics market is expected to flourish to USD 22.8 billion.


Trends to Watch Out - Global Self-service Business Intelligence (BI) Market 2017


The Global Self-Service Business Intelligence (BI) Market Research Report 2017 provides a comprehensive, detailed analysis of Self-Service BI industry, including the present Self-Service BI market trends and norms. It mainly focuses on the market of big continents, like North America, Europe and Asia, coupled with countries like Germany, US, China and Japan.

Continue reading “Trends to Watch Out – Global Self-service Business Intelligence (BI) Market 2017”

Using Predictive Modelling to Determine How Well Michael Jordan Performed Under Pressure

Using Predictive Modelling to Determine How Well Michael Jordan Performed Under Pressure

Continue reading “Using Predictive Modelling to Determine How Well Michael Jordan Performed Under Pressure”

How to Determine the Size of a SAS Data Set

How to Determine the Size of a SAS Data Set

When program codes, applications and SAS data sets are developed, enough attention is often not given to EFFECIENCY, especially during the initial phases of development. Since, data size and system conduct can influence a program or an application’s functioning, SAS users need to access information about a data set’s size and content. To ascertain how much disk space a data set is using, users can easily do a few calculations to learn to access metadata content and attain the important information. Determine, estimate and understand information with this following tip, which helps improve SAS performance and fine-tuning of techniques.

Also read: How to Code Colour Values Within SAS Enterprise Guide


Implementing PROC SQL and DICTIONARY.TABLES

The SAS system accumulates valuable information (also known as metadata) about all-familiar SAS libraries, indexes, data sets (tables), system options, views, catalogs, macros and an assemblage of other “read-only” tables called Dictionary tables and SASHELP views. TABLES, a particular Dictionary table and its SASHELP view equivalent, VTABLE, consists details about a SAS session’s data set. Check the following PROC SQL code as its specification will help us get access to the contents of four columns observed in the TABLES Dictionary table, namely BNAME, MEMNAME, MEMTYPE and FILESIZE to exhibit the size of the CARS data set.

Also read: How to Use PUT and %PUT Statements in SAS: 6 Tips


PROC SQL and Dictionary.TABLES:

PROC SQL ;
  TITLE ‘Filesize for CARS Data Set’ ;
  SELECT LIBNAME,
         MEMNAME,
         FILESIZE FORMAT=SIZEKMG.,
         FILESIZE FORMAT=SIZEK.
    FROM DICTIONARY.TABLES
      WHERE LIBNAME = ‘SASHELP’
        AND MEMNAME = ‘CARS’
        AND MEMTYPE = ‘DATA’ ;
QUIT ;

Results

Size-of-SAS-data-set1

Analysis

The above results show that the CARS data set filesize is 192KB.

Nota bene: If the SIZEKMG.format is mentioned in a format=option, SAS ascertains whether it should apply KB for kilobytes, MB for megabytes or GB for gigabytes, and divide the filesize value with the help of one of the following values:

KB           1024

MB          1048576

GB           1073741824


Using PROC PRINT and SASHELP.VTABLE

In the following example, the provisions of a PROC PRINT are explained to access the constituents of three columns found in the VTABLE SASHELP view, particularly LIBNAME, MEMNAME and FILESIZE to exhibit the size of the CARS data set.

Also read: SAS Still Dominates the Market After Decades of its Inception


PROC PRINT and SASHELP.VTABLE

PROC PRINT DATA=SASHELP.VTABLE NOOBS ;
  VAR LIBNAME MEMNAME FILESIZE ;
  WHERE LIBNAME = ‘SASHELP’
    AND MEMNAME = ‘CARS’ ;
  FORMAT FILESIZE SIZEKMG. ;
  TITLE ‘Filesize for SASHELP.CARS Data Set’ ;
RUN ;

Results

Size-of-SAS-data-set2


Using DATA _NULL_, SASHELP.VEXTFL and CALL SYMPUTX

Lastly, a DATA_NULL_ is depicted to approach the contents of the VEXTFL SASHELP view with a FILENAME statement. An assignment statement is specified to determine the FILESIZE value for the size of the CARS data set. The CALL SYMPUTX left supports and chops off the trailing blanks from the digital FILSESIZE value of 196608.

Also read: Things to judge in SAS training centres


DATA_NULL_and SASHELP.VEXTFL

filename myfile 'C:\Program Files\SAS9.4\SASFoundation\9.4\\CORE\SASHELP\Cars.sas7bdat' ;
DATA _NULL_ ;
  SET SASHELP.VEXTFL (WHERE=(FILEREF=’MYFILE’)) ; 
  /* Calculate the Filesize in MB */
  FILESIZE = FILESIZE / (1024 ** 2) ;
  CALL SYMPUTX (‘FILESIZE’,FILESIZE) ;
RUN ;

Results

Size-of-SAS-data-set3


Learn more about SAS Predictive Modelling by taking up SAS certification courses in Delhi and Gurgaon. DexLab Analytics offers excellent SAS analytics course for data enthusiasts.

 
This post originally appeared onblogs.sas.com/content/sastraining/2017/04/25/determining-the-size-of-a-sas-data-set
 

Interested in a career in Data Analyst?

To learn more about Machine Learning Using Python and Spark – click here.
To learn more about Data Analyst with Advanced excel course – click here.
To learn more about Data Analyst with SAS Course – click here.
To learn more about Data Analyst with R Course – click here.
To learn more about Big Data Course – click here.
Apple Watch’s Strategy Analytics, Return to 1% Growth

As per the latest research from strategy analytics, the global smart watch shipments of Apple has grown by 1 percent annually to hit the major record of 8.2 million units in the 4th quarter of the year 2016. The growth of apple watch drove and got dominated with 63 percent in global smart watch share of market and Samsung still continues to hold its second position.
 
Apple Watch’s Strategy Analytics, Return to 1% Growth


Neil Mawston, the Executive Director at Strategy Analytics stated on the issue by saying – the global shipments have grown by 1 percent annually from the pre-existing 8.1 million units in quarter 4 in 2015 to 8.2 million in quarter 4 in 2016. The market shows a marked growth in the fourth quarter for growth in smart watches industry after the past two consecutive quarters for declining volumes. The smart watch growth is also seen to be recovering ever so slightly due to new product launches from other company giants. Moreover, there is a seasonal demand for these gadgets, and a giant such as Apple is launching stringer demand in the major developed markets in the US and UK. Hence, the international smart watch shipments grew by 1 percent annually; from the previously existing 20.8 million in full-year 2015 to a record high of 21.1 million in 2016.

Continue reading “Apple Watch’s Strategy Analytics, Return to 1% Growth”

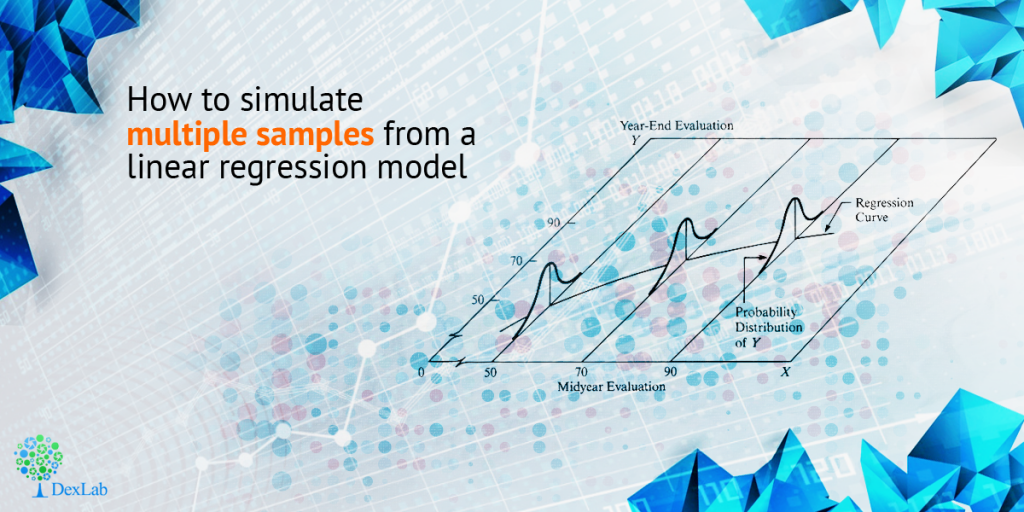
How to Simulate Multiple Samples From a Linear Regression Model

In this blog post, we will learn how to simulate multiple samples efficiently. In order to keep the discussion, easy we have simulated a single sample with ‘n’ number of observations, and ‘p’ amount of variables. But in order to use the Monte Carlo method to approximate the distribution sampling of statistics, one needs to simulate many specimens with the same regression model.


How to Simulate Multiple Samples From a Linear Regression Model


The data steps in SAS in  most blogs have 4 steps mentioned for so. However, to simulate multiple samples, put DO loop around these steps that will generate, the error term and the response variable for very observation made in the model.

Continue reading “How to Simulate Multiple Samples From a Linear Regression Model”

How to Code Colour Values Within SAS Enterprise Guide

Colours are amazing, they are the subject of many romantic poems and songs, they are what can alter our moods drastically, they are these magical wavelengths that transform into incredible visions for our eyes.

 
How to Code Colour Values Within SAS Enterprise Guide
 

Some feel warm, while others feel cool, some make us happy while others make us sad… but as colours are so important, how to add these values within the SAS Enterprise Guide?

Continue reading “How to Code Colour Values Within SAS Enterprise Guide”

Call us to know more